Transcription
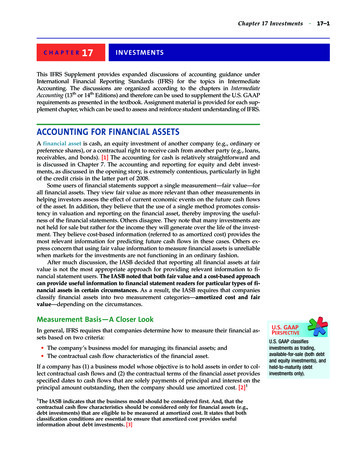
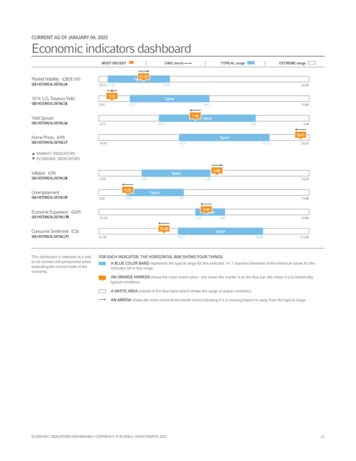
CURRENT AS OF JANUARY 04, 2022Economic indicators dashboardMOST RECENT3-MO. trendTypical10.13 12.2227.921.5210 Yr. U.S. Treasury 1.46Yield 86Home Prices (HPI)SEEHISTORICALDETAILS7EXTREME range21.35Market Volatility (CBOE VIX)SEEHISTORICALDETAILS4TYPICAL range4.0918.41Typical-19.01-4.2012.7220.02 MARKET INDICATORS ECONOMIC INDICATORSInflation 067.4714.802.00Economic Expansion 70.40Consumer Sentiment is dashboard is intended as a toolto set context and perspective whenevaluating the current state of theeconomy.FOR EACH INDICATOR, THE HORIZONTAL BAR SHOWS FOUR THINGS.74.2798.86112.00A BLUE COLOR BAND represents the typical range for this indicator. /- 1 standard deviation of the historical values for theindicator fall in this range.AN ORANGE MARKER shows the most recent value – the closer the marker is to the blue bar, the closer it is to historicallytypical conditions.A WHITE AREA outside of the blue band which shows the range of actual conditions.AN ARROW shows the most recent three-month trend indicating if it is moving toward or away from the typical range.ECONOMIC INDICATORS DASHBOARD // COPYRIGHT RUSSELL INVESTMENTS 2022p1
Frequently Asked QuestionsWhat does the dashboard tell me? The dashboard offers a snapshot of current U.S. economic and market conditions, based on key economic and market indicators. Thedashboard contextualizes the current reading of each indicator by comparing them to their typical, historical ranges of month-end values.Can I use the dashboard as a forecasting tool? No. The dashboard is not meant to serve as a direct prediction regarding the future performance of any economic or financial market. It is notintended to predict or guarantee future investment performance of any sort or serve as a market timing tool. Instead, the dashboard isintended to provide advisors with context and perspective about the current state of the economy.What defines typical? The dashboard definition of "typical range" is /- 1 standard deviation* away from the mean of all historical month-end values, or 68% ofhistorical values.1 The typical ranges are based on historical month-end data. Since each data point reports data at a different time, each typical range iscalculated independently using data through the end of the previous month. Revised ranges are usually published during the first quarter ofthe year, whenever an indicator reports data for a new year, or whenever there are revisions to historical data.How should I interpret the chart? The charts show the relationship between the most recent values and their typical historical range. Blue color band: represents the typical range (one standard deviation from the mean, i.e. 68% of all historical observations) Indicates moretypical behavior for that indicator. If it lies outside, that points to extreme behavior. Arrow: shows the most recent three-month trend. A grey bar: shows the full range of historical values for each indicator. The lowest recorded value is shown on the left side of the bar and thehighest recorded value on the right side of the bar. Orange marker: represents the current reading.Why are these indicators important? In order to monitor the current health of the economy and its trend, we believe it's important to keep an eye on both the broad economy aswell as key indicators in the market. More information about each of these indicators is available by following the “historical details” links on the left side of the dashboard.How often is the dashboard updated? The dashboard shows the most recent month end values for each indicator. It is updated periodically to capture previous month-end orquarter-end values as they become available. Additionally any revisions to the historical data will be captured with each update. Each indicator reports month-end data with the exception of GDP, which is reported quarterly. While some of the indicators may be measured daily, we choose to include only the monthly/quarterly numbers, as they are better indicatorsof the overall economic trend. With each update revisions to the historical data may occur.How can I use the dashboard to talk to my clients? You can use the dashboard to show your clients how the current market and economy, based on these indicators, compare to historicallytypical conditions and to show them which direction the market and economy seem to be moving.ECONOMIC INDICATORS DASHBOARD // COPYRIGHT RUSSELL INVESTMENTS 2022p2
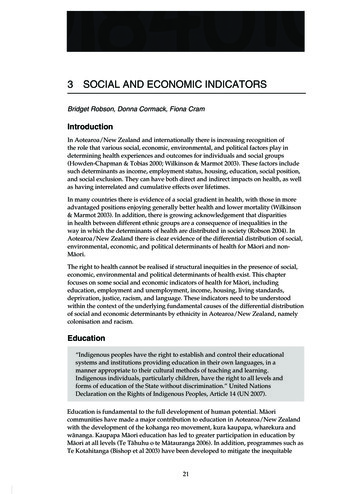
ECONOMIC INDICATORS DASHBOARD // COPYRIGHT RUSSELL INVESTMENTS 2022p3
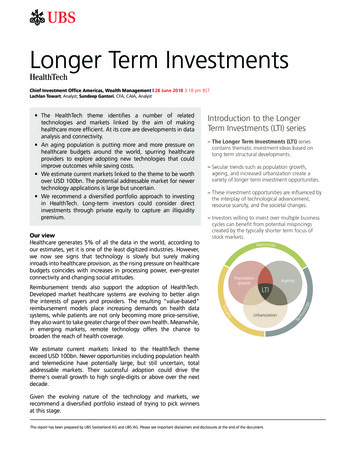
Market Volatility (CBOE VIX)MARKET INDICATORMONTHLY VALUES (%): JANUARY '90 - DECEMBER '21CURRENT12 MONTH TREND /- 1 STANDARD DEVIATION OF CBOE S&P 500 VOLATILITY INDEXFIGURES FALL INTO THIS RANGE.7060'21J F MA M J J A S O N D50403021.3520100.0'90'95'00'05'10'15'20 '21JAN '2124.91FEB '2123.14MAR '2121.84APR '2117.42MAY '2119.76JUN '2116.96JUL '2117.60AUG '2117.47SEPT '2119.82OCT '2117.87NOV '2118.50DEC '2121.35Frequently Asked QuestionsWhat is it? The Chicago Board Options Exchange Volatility Index (CBOE VIX) measures annualized implied volatility conveyed by S&P 500 stock indexoption prices. The indicator value reflects a month end reading of the trailing daily average for the month.Why is it important? Considered a key measure of market expectations of near-term volatility.How do we interpret it? An increasing VIX represents an increase in investor uncertainty about the near-term direction of the market. A decreasing VIX suggests theopposite.Typical historical range1 As of December 2020, /- 1 standard deviation* of historical month-end values have ranged from 12.22% to 27.92%.ECONOMIC INDICATORS DASHBOARD // COPYRIGHT RUSSELL INVESTMENTS 2022p4
10 Yr. U.S. Treasury YieldMARKET INDICATORMONTHLY VALUES (%): APRIL '53 - DECEMBER '21CURRENT12 MONTH TREND /- 1 STANDARD DEVIATION OF US GOVERNMENT 10 YEAR U.S.TREASURY YIELD FIGURES FALL INTO THIS RANGE.20'2115J F MA M J J A S O N D1051.520.0-5'53 '55'60'65'70'75'80'85'90'95'00'05'10'15'20'21JAN '211.11FEB '211.44MAR '211.74APR '211.65MAY '211.58JUN '211.45JUL '211.24AUG '211.30SEPT '211.52OCT '211.55NOV '211.43DEC '211.52Frequently Asked QuestionsWhat is it? The average interest rate on the 10 year U.S. Treasury note issued by the U.S. Government.Why is it important? It is important because it is seen as a benchmark for interest rate movements and borrowing costs in the economy.How do we interpret it? Rising value levels indicate increasing interest rates. Decreasing value levels indicate the opposite.Typical historical range As of December 2020, /- 1 standard deviation* of historical month-end values have ranged from 2.77% to 8.61%.1ECONOMIC INDICATORS DASHBOARD // COPYRIGHT RUSSELL INVESTMENTS 2022p5
Yield SpreadMARKET INDICATORMONTHLY VALUES (%): JANUARY '82 - DECEMBER '21CURRENT12 MONTH TREND /- 1 STANDARD DEVIATION OF US GOVERNMENT YIELD SPREAD (10 YR. 3 MO.) FIGURES FALL INTO THIS RANGE.4.54.0'213.5J F MA M J J A S O N D3.0JAN '211.052.5FEB '211.402.0MAR '211.711.5APR '211.64MAY '211.57JUN '211.400.5JUL '211.180.0AUG '211.26-0.5SEPT '211.48OCT '211.50NOV '211.38DEC '211.461.461.0-1.0'82'85'90'95'00'05'10'15'20 '21Frequently Asked QuestionsWhat is it? The spread between the yields of the 10 Year US Treasury Note and the 3 Month US Treasury Bill.Why is it important? The spread measures the market's outlook for future interest rates.How do we interpret it? An increase in the yield spread generally indicates that investors expect interest rates to increase. A decrease in the spread usually means theopposite.Typical historical range As of December 2020, /- 1 standard deviation* of historical month-end values have ranged from 0.61% to 2.86%.1ECONOMIC INDICATORS DASHBOARD // COPYRIGHT RUSSELL INVESTMENTS 2022p6
Home Prices (HPI)MARKET INDICATORMONTHLY VALUES (%): JANUARY '01 - OCTOBER '21CURRENT12 MONTH TREND /- 1 STANDARD DEVIATION OF S&P/CASE-SHILLER COMPOSITE-20 CITYHOME PRICE INDEX YOY % CHANGE FIGURES FALL INTO THIS RANGE.252018.4115'21N D J F MA M J J A S 0'11'12'13'14'15'16'17'18'19'20'21NOV '209.21DEC '2010.17JAN '2111.18FEB '2112.10MAR '2113.50APR '2115.19MAY '2117.26JUN '2119.22JUL '2120.02AUG '2119.67SEPT '2119.09OCT '2118.41Frequently Asked QuestionsWhat is it? The S&P/Case-Shiller Home Price Index is a measurement of U.S. residential real estate prices, tracking changes in top 20 metropolitanregions. This indicator value represents the trailing year over year % change in the home prices index as of last month-end.Why is it important? Residential real estate represents a large portion of the US economy and the Home Price index helps us monitor the value of real estate.How do we interpret it? Rising value levels indicate an improving economy and increased homeowner wealth. Declines in the value usually indicate the opposite.Typical historical range As of December 2020, /- 1 standard deviation* of historical month-end values have ranged from -4.20% to 12.72%.1ECONOMIC INDICATORS DASHBOARD // COPYRIGHT RUSSELL INVESTMENTS 2022p7
Inflation (CPI)ECONOMIC INDICATORMONTHLY VALUES (%): JANUARY '48 - NOVEMBER '21CURRENT12 MONTH TREND /- 1 STANDARD DEVIATION OF US CONSUMER PRICE INDEX YOY %CHANGE FIGURES FALL INTO THIS RANGE.15'20'21D J F MA M J J A S O N106.8850.0-5'48 C '201.30JAN '211.37FEB '211.68MAR '212.64APR '214.15MAY '214.93JUN '215.32JUL '215.28AUG '215.20SEPT '215.38OCT '216.24NOV '216.88Frequently Asked QuestionsWhat is it? The Consumer Price Index (CPI) SA (Seasonally Adjusted) measures changes in the price level of a market basket of consumer goods andservices purchased by households. This indicator value represents the trailing year over year % change in the CPI index as of last month-end.Why is it important? CPI measures inflation in the US Economy which can decrease the purchasing power of a consumer and decrease the demand for goods andservices.How do we interpret it? Rising value levels indicate increasing inflation. Decreasing value levels indicate the opposite.Typical historical range1 As of December 2020, /- 1 standard deviation* of historical month-end values have ranged from 0.55% to 6.35%.ECONOMIC INDICATORS DASHBOARD // COPYRIGHT RUSSELL INVESTMENTS 2022p8
UnemploymentECONOMIC INDICATORMONTHLY VALUES (%): JANUARY '48 - DECEMBER '21CURRENT12 MONTH TREND /- 1 STANDARD DEVIATION OF US UNEMPLOYMENT RATE - SEASONALLYADJUSTED FIGURES FALL INTO THIS RANGE.15'21J F MA M J J A S O N D1054.200.0-5'48 N '216.30FEB '216.20MAR '216.00APR '216.10MAY '215.80JUN '215.90JUL '215.40AUG '215.20SEPT '214.80OCT '214.60NOV '214.20DEC '214.20Frequently Asked QuestionsWhat is it? The Bureau of Labor Statistics measures employment and unemployment of all persons over the age of 15 using two different labor forcesurveys conducted by the United States Census Bureau (within the United States Department of Commerce) and the Bureau of LaborStatistics (within the United States Department of Labor) that gather employment statistics monthly. The data reported here is seasonallyadjusted (SA) to account for seasonal gains in employment leading up to Christmas.Why is it important? Employment reflects the health of the businesses in the economy. Businesses in a strong economy hire to meet demand for their goods orservices which rise with improved economic conditions.How do we interpret it? Rising value levels indicate increasing unemployment. Decreasing value levels indicate the opposite.Typical historical range As of December 2020, /- 1 standard deviation* of historical month-end values have ranged from 4.06% to 7.47%.1ECONOMIC INDICATORS DASHBOARD // COPYRIGHT RUSSELL INVESTMENTS 2022p9
Economic Expansion (GDP)ECONOMIC INDICATORQUARTERLY VALUES (%): JUNE '47 - SEPTEMBER '21CURRENTQUARTERLY TREND /- 1 STANDARD DEVIATION OF GDP US CHAINED 2009 DOLLARSQUARTER OVER QUARTER % CHANGE FIGURES FALL INTO THIS RANGE.4030'20Q420102.000.0Q1Q2Q3Q4 '204.50Q1 '216.30Q2 '216.50Q3 '212.00-10-20-30-40'47 equently Asked QuestionsWhat is it? Gross Domestic Product (GDP) seasonally adjusted measures the total market value of the United States' output of goods and services during aspecific time period. It is measured on a quarterly basis. This indicator value represents the trailing quarter over quarter % change as of lastmonth-end.Why is it important? GDP is considered a measure of a country’s economic health.How do we interpret it? Rising indicator levels indicate increasing GDP. Decreasing indicator levels indicate the opposite.Typical historical range1 As of December 2020, /- 1 standard deviation* of historical month-end values have ranged from -1.52% to 7.85%.ECONOMIC INDICATORS DASHBOARD // COPYRIGHT RUSSELL INVESTMENTS 2022p10
Consumer Sentiment (CSI)ECONOMIC INDICATORMONTHLY VALUES (%): NOVEMBER '52 - DECEMBER '21CURRENT12 MONTH TREND /- 1 STANDARD DEVIATION OF UNIVERSITY OF MICHIGAN SURVEY OFCONSUMER SENTIMENT FIGURES FALL INTO THIS RANGE.120110'21J F MA M J J A S O N D100908070.4070605040'52 '55'60'65'70'75'80'85'90'95'00'05'10'15'20'21JAN '2179.00FEB '2176.80MAR '2184.90APR '2188.30MAY '2182.90JUN '2185.50JUL '2181.20AUG '2170.30SEPT '2172.80OCT '2171.70NOV '2167.40DEC '2170.40Frequently Asked QuestionsWhat is it? The University of Michigan Survey of Consumer Sentiment Index is an economic indicator which measures the degree of optimism thatconsumers feel about the overall state of the economy and their personal financial situation.Why is it important? How confident people feel about stability of their incomes affect their economic decisions, such as spending activity, and therefore serves asone of the key indicators for the overall shape of the economy.How do we interpret it? Rising value levels indicate improving consumer confidence. Decreasing value levels indicate the opposite.Typical historical range As of December 2020, /- 1 standard deviation* of historical month-end values have ranged from 74.27% to 98.86%.1ECONOMIC INDICATORS DASHBOARD // COPYRIGHT RUSSELL INVESTMENTS 2022p11
CONNECT WITH USALSO OF INTERESTInternshipsBlogOur investment approach* Standard Deviation is a statistical measure that reflects the degree to which an individual value in distribution tends to vary from themean of the distribution. Standard Deviation is a useful tool in measuring the historical typical range as 1 Standard Deviation includesapproximately 68% of the historical values in a normal distribution. Using this measurement allows us to exclude the more extremevalues which would not be as probable to see from the indicator.1 Note that this a new typical range methodology. Prior to June 2014 it was shown as 90% of the historical values.Data stated is historical and not a guarantee of future results.Russell Investments or its affiliates make no representations regarding the data that results dependent upon such information andhereby disclaim all warranties related to information and results are dependent hereon, including but not limited to warranties ofmerchantability or fitness for any particular purpose.Data displayed in the Economic Indicators Dashboard are reflective of current data as provided by the data sources including anyrevisions to previous data. These revisions may change historic data points and historic ranges for some or all indicators. These changesare usually due to seasonal adjustments to previously supplied data.The information, analyses and opinions set forth herein are intended to serve as general information only and should not be relied uponby any individual or entity as advice or recommendations specific to that individual entity. It is not intended to constitute legal, tax,securities, or investment advice, nor an opinion regarding the appropriateness of any investment, nor a solicitation of any type. Anyoneusing this material should consult with their own attorney, accountant, financial or tax or consultants on whom they rely for investmentadvice specific to their own circumstances.This analysis is not meant to serve as a direct prediction regarding the future performance of any economic or financial market.Similarly, they are in no way intended to predict or guarantee future investment performance of any sort. Other economic or financialmarket indictors not considered in this analysis may produce different results.This analysis represents an economic analysis utilizing varying analytical data. It is not representative of a projection of the stock market,or of any specific investment.The Russell 3000 Index measures the performance of the largest 3,000 U.S. companies representing approximately 98% of theinvestable U.S. equity market.Indexes shown are economic indicators and are for comparative purposes only. They are not meant to represent any actual investment.Indexes are unmanaged and cannot be invested in directly.This is not an offer, solicitation or recommendation to purchase any security or the services of any organization.Please remember that all investment markets carry some level of risk, including the potential loss of principal invested. They do nottypically grow at an even rate of return and may experience negative returns.Diversification and strategic asset allocation do not assure profit or protect against loss in declining markets.No investment strategy can guarantee a profit or protect against a loss in a declining market.Russell Investments Financial Services, LLC, member FINRA, part of Russell Investments.First used September 2009Revised May 2018RIFIS 20030p12
Revised May 2018RIFIS 20030Products and services described on this website are intended for United States residents only. Nothing contained in this material isintended to constitute legal, tax, securities, or investment advice, nor an opinion regarding the appropriateness of any investment, nor asolicitation of any type. The general information contained on this website should not be acted upon without obtaining specific legal,tax, and investment advice from a licensed professional. Persons outside the United States may find more information about productsand services available within their jurisdictions by going to Russell Investments' Worldwide site.Russell Investments is committed to ensuring digital accessibility for people with disabilities. We are continually improving the userexperience for everyone, and applying the relevant accessibility standards.Russell Investments' ownership is composed of a majority stake held by funds managed by TA Associates, with a significant minoritystake held by funds managed by Reverence Capital Partners. Russell Investments' employees and Hamilton Lane Advisors, LLC alsohold minority, non-controlling, ownership stakes.
Economic indicators dashboard MARKET INDICATORS ECONOMIC INDICATORS FOR EACH INDICATOR, THE HORIZONTAL BAR SHOWS FOUR THINGS. MOST RECENT 3-MO. trend TYPICAL range EXTREME range 10.13 62.64 Typical 12.22 27.92 21.35 Market Volatility (CBOE VIX) SEEHISTORICALDETAILS4 0.55 15.84 Typical 2.77 8.61 1.52 10 Yr. U.S. Treasury Yield File Size: 284KB