Transcription
Socioeconomic Indicators ReportTHE SACRAMENTOSAN JOAQUIN DELTAM. Anne VisserCatherine BrinkleyJessica ZlotnickiJanuary 2019Suggested Citation: Visser, M.A.; Brinkley, C.; Zlotnicki, J. (2018) Socioeconomic Indicators Report: TheSacramento-San Joaquin Delta. Sacramento, CA: The Delta Protection Commission.
TABLE OF CONTENTSABOUT THIS REPORTTHE SACRAMENTO-SAN JOAQUIN DELTAKEY FINDINGS137POPULATIONPopulation by Age GroupsPrimary and Secondary Level Education CompletionSchool District Poverty10111213JOBS AND THE ECONOMYUnemployment RateMedian Household IncomeMedian Individual EarningsAverage Commute Time1415161717WORKING LANDSProduction by Land useTrends in ProductionLand ConversionLand CoverFishing and Hunting LicensesState Park Use Data18192022242627HOUSING AND ROADSMedian Home ValueHomeownershipHomeowner and Rental Vacancy RatesOvercrowded HousingRoad Pavement Conditions282930313132EDUCATIONEnrollment CharacteristicsCost-adjusted Revenues Per PupilHigh School Graduation Rate34353637APPENDIX A38
ABOUT THIS REPORTThe Socioeconomic Indicators Report provides a quantitative snapshot forbenchmarking policy progress in the Sacramento-San Joaquin River Delta region (theDelta. The Delta contains historic, economic, cultural, natural, and agriculturalresources that benefit both the residents and visitors who enjoy the region. TheState’s goals for the Delta to provide a reliable water supply for California andprotect, restore, and enhance the Delta ecosystem are to be achieved in a mannerthat protects and enhances the unique cultural, recreational, natural resource, andagricultural values of the Delta as an evolving place (Public Resources Code section29702 and California Water Code section 85054). Policies in the Delta are focusedon protecting agriculture, increasing agricultural economic vitality, and ensuringenvironmental health, while continuing to provide high-quality amenities to itsresidents and visitors.This policy focus is rooted in the unique history and geography of the region. Overhalf a million people live in the Delta, which encompasses 740,000 acres. Nestledbetween the highly urbanized San Francisco Bay Area and the metropolitan areas ofStockton and Sacramento, the Delta is an important agricultural area and waterwayfor the Golden State. Formed by the confluence of the state’s largest rivers, theDelta provides drinking water for millions of Californians and filters over 50% of allCalifornia runoff. The majority of the Delta’s total land area comprises active farms,with 75% on prime agricultural soils. By comparison, only 18 percent of the state’sagricultural land is classified as prime farmland. The Delta supports a 30 billionagricultural economy1, and the diverse microclimates of the region provide habitatsfor wildlife, migratory birds, and numerous fish species. Over 1,000 miles of leveesencircle the Delta providing protection for farms, cities, schools, and people.HOW TO USE THIS REPORTThe data presented here offer a set of statistical indicators that can be replicatedon a continual basis to monitor and track the socioeconomic health and vitality ofthe Delta region. The Delta leaders and residents join many communities acrossAmerica in a concerted effort to take stock of resources and improve quality oflife. The indicators combine measures of physical and human capital, revealingcharacteristics particular to the Delta as a whole along with social characteristicsparticular to the specific communities. The set of indicators outlined in this reportwere selected through an iterative process with policymaker and communitystakeholders of the Delta region.1. html1
This report uses a regional framework to assess socioeconomic well-being. This means it incorporates data frommultiple jurisdictions to fit the broader unit of analysis ofthe Delta. A regional approach is important because thedrivers of change and the resulting patterns are not limitedto individual communities, but instead are best understoodand acted upon in ways that span multiple jurisdictions. Inthis case, the scale of analysis—the Delta Region—matchesthe scale of action of the Delta Protection Commission. Theindicators selected do not present the entire picture ofconditions or issues within the Delta, but they serve as aguide for further research and dialogue. As with any effortof this nature, the data should be used and approachedwith an understanding that in the future there may bemore information available to create a more completeanalysis. The indicators assemble publicly available datagathered every year. Five year averages2 are reportedwhere appropriate to improve accuracy in reporting trends.Where possible and meaningful, Delta indicators have beencompared to indicators of the State of California and theSan Joaquin Valley, another rural/peri-rural and primarilyagricultural area. Such comparisons offer context for theDelta findings. Future iterations can track these indicatorsover time and use these baseline indicators to measureprogress to specific policy goals. Future research shouldtrack these indicators in consideration with decennial Censusdata in order to track population growth and turnover inthe Delta as it relates to the indicators reported here.Based on the information, analysis, and structure providedin this report, individual communities may also wish todevelop indicators specific to their geography and concernswithin the Delta. This report can serve as a guide fordeveloping an indicator-based assessment of smallercommunities. The impact of policies implemented ormodified can also be assessed based on the indicatorsover time.WHAT MAKES A GOODINDICATOR?Good indicators are:1. Clear and understandable, easy tocommunicate in concept, value, andimportance2. Can be tracked over time, arestatistically measured at regularintervals, and come from a reliablesource3. Can be verified by triangulatingmultiple sources4. Measure an outcome rather than aninput5. Gauge policy efficacy by providing abenchmark to track progress overtime6. Spatially specific and can allowcomparison to similar regions ofinterest2. Researchers rely on data collected annually.To improve accuracy or reporting on trends,researchers use five-year averages from AmericanCommunity Survey (2011–2015). Some datapoints are median, (eg. median householdincome), but in this report researchers use thefive-year average of median household income, adata point that is collected every year.2
WHAT ARE INDICATORS?Socioeconomic indicators are powerful tools for monitoring and tracking overallquality of life and policy benchmarks. Indicators can help communities and regionalpublic agencies monitor conditions by providing baseline measures against whichpolicy interventions and socioeconomic change can be measured. These tools helpto answer some basic questions such as: what are the primary challenges facingcommunities and regions, and in what ways are they doing well? How well is theeconomy functioning and where are its key areas of growth? What is the quality oflife in the region, and is it improving? What are the implications of current land useand resource policies on the future of the region?THE SACRAMENTOSAN JOAQUIN DELTA REGIONThe Delta is defined by its natural and cultural features and the regional boundariesdo not neatly follow jurisdictional boundaries such as county lines. The Deltaconstitutes parts of six counties: Sacramento, San Joaquin, Yolo, Solano, ContraCosta, and Alameda. Political boundaries often form the units of analysis for publicdata collection, making it difficult to delineate Delta-specific trends from those ofadjacent large, urban areas. This report seeks to overcome some of these obstaclesin benchmarking policy by providing indicators tailored to the Delta region’s specificboundaries.While the majority of the region has a rural character comprised of farms and smalltowns, the edges of the Delta are more urban with higher density developments andresidents who commute for employment. The Delta Protection Act of 1992 delineatesbetween a primary and secondary zone within the legal confines of the Delta.The primary zone encompasses much of the agriculturally focused land, while thesecondary zone is more urban-influenced and includes the Delta’s cities and themajority of the Delta’s population.Policy efforts in the region have been aimed at preserving working farms and cleanwaterways, particularly in the primary zone. Policies to encourage infill developmenthave also been promoted, particularly in the secondary zone. Given these realitieswe provide separate analyses of the indicators for the primary and secondary zonesin the Delta.3
4
SELECTING AND IDENTIFYING INDICATORSFOR THE DELTAThe set of indicators included in this report were identified through an iterativeprocess between UC Davis researchers, stakeholders in the Delta, and the staffof the Delta Protection Commission. During the months of May-August 2016the research team met with Delta Protection Commission staff and Commissionmembers to review suggested indicators for the region. Based upon thesemeetings, and substantial feedback from a public presentation of theseindicators at the Delta Protection Commission meeting in November 2016,22 indicators were identified across six categories to be included in the final report.The final set of indicators was selected with an understanding that they arenot an exhaustive measure of socioeconomic conditions in the region. However,given the challenges of the Delta geography these indicators are the bestavailable and most reliable data to provide a comprehensive understanding ofthe socioeconomic conditions in the region which can be tracked over time.The 22 indicators included in this statistical snapshot are displayed on page 6.A detailed description of the data sources for each indicator is included inAppendix A.Each indicator is explored in detail in the remaining sections of this report.5
CATEGORYPOPULATIONINDICATORS Population by Age Group Primary and Secondary Education Levels School District Poverty Unemployment RateMedian Household IncomeMedian Individual EarningsAverage Commute TimeWORKING LANDS Production by Land UseTrends in ProductionLand ConversionLand-CoverFishing and Hunting LicensesPark UseHOUSING AND ROADS Median Home ValueHomeownershipOwner and Renter Vacancy RatesOvercrowded HousingPavement ConditionsJOBS AND THE ECONOMYEDUCATION Enrollment Characteristics Cost-adjusted Revenues per Pupil High School Graduation Rate6
KEY FINDINGSThe Delta has a cyclical economy based in the agriculture and tourism industries.Over two-thirds of the land-cover in the primary zone, and nearly half of thesecondary zone are dedicated to active farming. The Delta’s working lands alsosupport a large share of the state’s hunting, with over 12% of hunting licensesissued in Delta-specific zip codes. These economic sectors are affected by globalmarket changes. Total acres of the Delta’s working lands have stayed steady duringa recovering economy and housing market, a good indicator that current farmlandprotection policies are effective.The Delta’s combination of scenic farmland, high-demand recreational areasand affordable housing near major urban hubs contributes to a high quality oflife in the Delta. Life quality for Delta residents is bolstered by school districtswhich outperform the state average, despite higher childhood poverty rates. Highhomeownership rates compared to the state also show a long-term communitycommitment to the Delta and a willingness to invest in its future success.Labor market dynamics in the region reveal a need to supportthe Delta’s economic base with infrastructure investments Agricultural-based economies like the Delta tend to have higher unemploymentrates than other areas. Unemployment in the Delta remains higher than theunemployment rate in California, but comparable to that of other agriculturalbased regions in the state. Median household income levels between the primary and secondary zonesindicate two distinct standards of living within the region. Median householdincome in the primary zone is nearly 1/3 less than the median household incomeof the secondary zone. Agriculture and tourism are the primary backbones of the Delta’s economy.These industries are cyclical in nature and vulnerable to economic shocks andenvironmental changes (such as recessions and droughts). Monitoring thesesocioeconomic indicators can provide information on how the Delta fares inrelation to state-level trends.7
A well-research understanding of how the Delta fares in relation to California'sbroader economic and environmental conditions may also help support timelyinfrastructure investments. While the majority of Delta highways surveyed are ingood condition, nearly a quarter are considered distressed and in need of repairs.Investments at the nexus of waterway infrastructure, wildlife habitat quality, andtourism will likely benefit Delta residents, visitors and the state more broadly.Future reports can add to this understanding as new data becomes available onroads, docks, energy infrastructure, campsites and park visitation.Agriculture in the region is changing, bringing new opportunitiesand challenges The amount of acreage devoted to farming in the primary and secondary zoneremained steady over the course of this study (2011-2015). However, the specifictypes of farming is changing. The primary crop by acreage in the Delta is alfalfa, covering 17% of the primaryzone and 12% of the secondary zone. It remains important to support thedominant production paradigm in addition to the aforementioned trends towardmore permanent tree and vine crops. Similar to broader state trends, agricultural production in the Delta is shifting awayfrom commodity crops to permanent crops such as trees and vines. This transitionmarks a longer-term land-use commitment and higher investment, but one thatalso typically yields higher economic returns. If trends continue, this may haveramifications for the conservation values involved in habitat management, andwater management. Permanent high value crops may not be eligible for federalinsurance and will cost more in recovery. Changes in types of production will also change the seasonal demands on theagricultural workforce, potentially making way for longer seasons of employmentand the need for permanent housing options near work sites. The proliferation of wineries and orchards produces secondary benefits ofattracting agricultural tourism, particularly with added on-farm event space.These developments present economic development opportunities while alsoincreasing usage and traffic along Delta roads.8
Economic development and population growth should be tracked as bothare affecting many aspects of the region’s economy, and current and futureworkforce Median household income should be monitored over time alongside unemploymentand population changes. This will help to identify income (and job polarization),and any sources of downward pressure or demographic changes that may driveincreasing wage and income disparities in the region. Housing is relatively affordable, but also in high demand. Delta housing pricesare roughly half the median prices of the state. Homeownership is higher thanthe state average- particularly in the secondary zone- where the number ofhomes that are vacant and/or listed for sale is five times less than the stateaverage.3 Growth in the housing market will need to be watched with continuedattention to farmland conversion. One-third of the total Delta population is under the age of 19, compared to only5% of the population aged over 75. This future workforce presents an incredibleeconomic opportunity if it can be trained and retained in the Delta.3. icas-other-housingcrisis/565901/9 The Delta's high-quality schools may also drive future housing demand. Deltaschools are well-funded on a per-pupil basis, compared to the state average. Anddespite higher rates of children living in poverty, Delta high schools have higherrates of high school graduation.
POPULATIONA large youth population will remain a primary challenge andopportunity for the Delta Region In 2015, youth under the age of 19 accounted for almost 1/3 of the population ofthe Delta region, while those individuals ages 75 and older accounted for only 5%. Upwards of 20% of school-aged population in the Delta lived in poverty in 2015. 83.8% of adult Delta residents have at least a High School (or equivalent) degree.This is higher than the state average of 81.8%. Of the population of Delta residents aged 25 or older, only 8.4% have less than a9th-grade education level.10
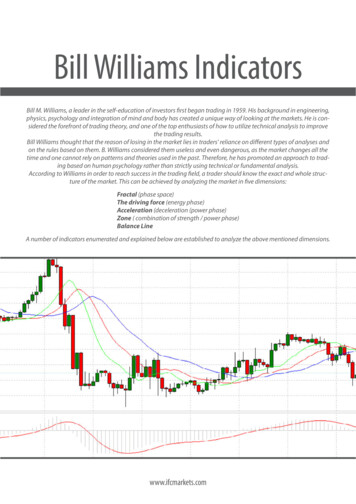
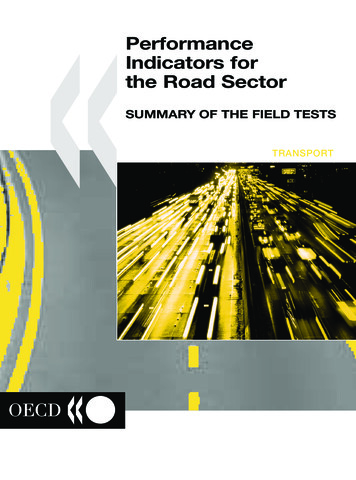
POPULATION BY AGE GROUPSDefinitionThis indicator shows the breakdown of the population residing in a region. Theindicator includes the following age groups: individuals under 5 years of age;individuals 5-17 years of age; individuals 18-24 years of age; individuals 25-44 yearsof age; individuals 45-64 years of age; and those ages 65 and older. The informationis gathered from the American Community Survey and is collected every five years.Why is this indicator important?2. Researchers rely on datacollected annually. Toimprove accuracyor reporting on trends,researchers use five-yearaverages from AmericanCommunity Survey(2011–2015). Some datapoints are median,(eg. median householdincome), but in this reportresearchers use the fiveyear average of medianhousehold income, a datapoint that is collected everyyear.This indicator gives a snapshot of the composition of the Delta population. It allowsfor an understanding of what portion of the population is of working age, the size ofthe aging community, and how many young people are being raised in the region.How is the Delta doing?American Community Survey five-year population estimates show that 582,884individuals lived in the Delta from 2011-2015 The secondary zone had a total of573,483 residents. The primary zone had a total of 9,401 residents.2Population by Age 2011–2015Primary ZoneSecondary Zone16%Percentage of Population14%12%10%8%6%4%2%0%Source: American Community Survey11Age in YearsDelta
PRIMARY AND SECONDARY LEVEL EDUCATION COMPLETIONDefinitionThe secondary level education rate reports the percentage of residents aged 25 andolder in an area that have completed a high school or equivalent level of education.The primary education completion rate reports the percentage of residents aged 25and older in an area that have completed up to a primary (elementary) educationlevel of schooling. The information is gathered from the American Community Surveyand is collected annually.Why are these indicators important?These indicators offer insight into the human capital available in a local labor market.Completion of a high school education is often considered to be linked to higher ratesof labor market participation and increased labor market competitiveness. In contrast,the completion of primary/elementary education alone often correlates with holdinglow-wage and low-skill jobs.How is the Delta doing?Over the five-year period from period 2011-2015, the American Community Surveyprovided the mean population over a 5-year time period to provide additional accuracy.According to the results, the average of 83.8% of the Delta residents aged 25 andolder had at least a high school education. The high school completion rate in theprimary zone was 78.6% and the secondary zone 83.8%. Overall, the Delta region hasa higher rate of secondary education completion than the state of California at 81.8%.8.4% of Delta residents report having only an elementary school level of education.10.4% of residents living in the primary zone and 8.3% of residents living in thesecondary zone report having less than a 9th grade education level.12
SCHOOL DISTRICT POVERTYDefinitionThe school district poverty rate is calculated as the number of children ages 5 to 17who live in families with income below the poverty line as the share of the totalnumber of children ages 5 to 17 in a school district. School district poverty rates areused to determine Title 1 status in California (qualifying for free and reduced costmeals and other programs). This data comes from Small Area Income and PovertyEstimates produced by the school districts annually.Why is this indicator important?Levels of school district poverty are important indicators of socioeconomicopportunity and educational access. School districts with a higher proportion oflow income students are eligible to receive increased federal funding, as well asprovide for additional educational and well-being needs of students.Tracking levels of school district poverty over the long term can help informeducational policy planning and initiatives necessary to support changingeconomic conditions that may affect the education of young people in the region.How is the Delta doing?In 2015, the school district poverty rate for districts that fell within the boundaries ofthe Delta was 20.54%. This means 1 in every 5 children in this age range live in povertypoverty. This level of school district poverty is similar to statewide level rate at 19.88%.13
JOBS AND THE ECONOMYThe Delta’s economy is strong, but may benefit from diversification In 2015, the Delta had an average unemployment rate of 12.2%. This rate is higherthan the state average at 9.9% but comparable to other agriculture-based regions inthe state like the San Joaquin Valley (12.1%). The secondary zone had a higher unemployment rate (12.4%) than the primary zone(10.9%). Median household income is slightly lower in the Delta when compared to the statemedian ( 59,844 vs. 61,818). However, the Delta region has higher medianhousehold incomes than other agricultural based economies like the San Joaquin Valley( 49,880), which is likely driven by higher wages paid to workers in the Delta region. Delta residents travel an average of 35 minutes to get to work, which indicates thatresidents are more likely to work outside of the communities in which they reside.This commute time is longer than that for residents of California as a whole (28minutes).14
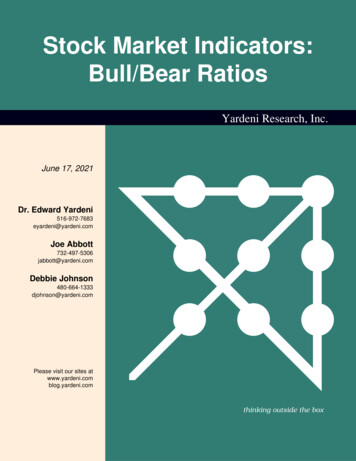
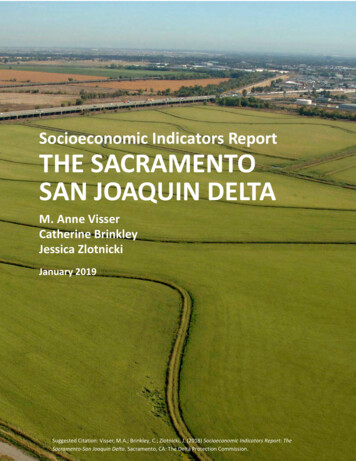
UNEMPLOYMENT RATEDefinitionThe number of employed individuals and the size of the labor force are estimated bya survey of households conducted by the US Census Bureau. The information isupdated annually. Unemployment rates measure the percentage of individuals ages16 and older in an area who are actively seeking work but who are not employed orself-employed on a full or part-time basis.Why is this indicator important?Unemployment rates are one of the most common ways to measure the economichealth of a region. High unemployment means that there is saturation in the labormarket - that is, that there are more workers seeking work than there are jobsavailable. High unemployment rates can also generate competition for existing jobsand lead to lower overall wages in a region. At the individual level, unemploymentcan affect household incomes and well-being which can in turn have negativespillover effects into the community and impact the larger economy as a whole.How is the Delta doing?Over the time period 2011-2015, the average unemployment rate for the Deltaregion was 12.4%. The unemployment rate was slightly higher for the secondaryzone (12.4%) than the primary zone (10.9%). Compared to the state of California asa whole, the Delta had a higher unemployment rate (12.4%). Local economies basedon agriculture and tourism tend to have cyclical employment and thus higher ratesof unemployment than other regions that have a more diverse economic base.Unemployment .00%DeltaPrimary ZoneSecondary ZoneCaliforniaSan Joaquin ValleySource: American Community Survey 5 year estimates 2011–201515
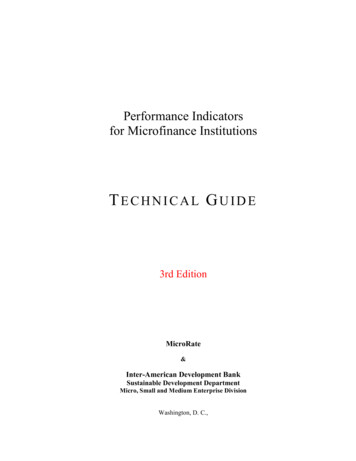
MEDIAN HOUSEHOLD INCOMEDefinitionMedian household income is the number that divides all household incomes in anarea into two equal groups. Half of this group has incomes above this amount, andthe other half has incomes below. A household consists of all the people who occupya housing unit. Income includes wages in addition to dividends and interest accruedby all household heads. The data is from the American Community Survey and isupdated annually.Why is this indicator important?Median household income is an indicator of a region’s standard of living. The medianis less influenced by outliers (like small highly wealthy populations) than per capitaincome. As such, median household income is a useful measure of regional prosperity.How is the Delta doing?From 2011-2015, the median household income in the Delta Region was 59,844.The median household income is nearly 30% greater in the secondary zone than inthe primary zone ( 60,539 vs. 40,347). Household median incomes in the regionare lower than the state household median of 61,818.Median Household Income 2011–2015 70,000 60,000 50,000 40,000 30,000 20,000 10,000 -DeltaPrimary ZoneSecondary ZoneCaliforniaSan Joaquin ValleySource: American Community Survey 2011–201516
MEDIAN INDIVIDUAL EARNINGSDefinitionIndividual earnings is a measure of all income earned by an individual (includingwages, salary, social security payments, pensions, child support, public assistance,annuities, money derived from rental properties, interest, and dividends). The medianearnings of individuals is the number at which half of the individuals earn above thisnumber, and half earn below. Median individual earnings are different than medianhousehold income as household income includes incomes from multiple individualsand does not account for earnings from dividends and interest. This data comes fromthe American Community Survey which is updated annually.Why is this indicator important?Individual earnings is an important measure of socioeconomic status and both reflectsand drives overall regional economic strength.How is the Delta doing?Over the years 2011-2015 median earnings for individuals living in the Delta regionwas 31,023. This median is comparable to the median earnings in the state ofCalifornia ( 31,069). Median earnings of individuals in the primary zone were lowerthan those in the secondary zone ( 24,606 vs. 31,069)AVERAGE COMMUTE TIMEDefinitionAverage commute time refers to the total number of minutes a person spendscommuting to work. Travel time includes time spent waiting for public transportation,picking up passengers in carpools, and time spent in other activities related to gettingto work. It also includes commute times for workers who travel between counties forresidence and work. This data comes from the American Community Survey which isupdated annually by the US Census Bureau.Why is this indicator important?The amount of time it takes to get to work affects a worker's ability to secureemployment. Living in more rural counties is often identified as a difficult andcontributing factor to higher unemployment rates due to lack of local jobs and longcommute times. The indicator also reveals commute times for Delta residents whotravel within the Delta region for work.How is the Delta doing?Delta residents commute on average 35 minutes to work. Delta residents in thesecondary zone commute on average 36 minutes to work. The average commutetime in the primary zone is substantially lower at 11 minutes. The average commutetime of Delta residents is longer than the average for California residents as a whole.(35 minutes vs. 28 minutes).17
WORKING LANDSAgriculture in the region is changing, mirroring broader trends in California The predominant land use in the Delta continues to be farming, with land inproduction constituting 70% and 50% of the primary and secondary zonesrespectively in 2015. Fallowed land is also considered an agricultural use and isin addition to these percentages. Most urban development occurs in the secondary zone, which is in accordance withstate policy objectives. In 2015, developed land (land units with at least 20% ofimpervious surface) made up 3% of the primary zone and 34% of the secondary zone. From 2011-2015, less land was devoted to annual crops such as corn and alfalfaas fields are increasingly converted to permanent crops such as vineyards andalmonds. These crops yield higher values per acre than commodity crops, makingconversion to urban land-uses less likely. Farming continues to be the primary land use within the primary zone. Thesecondary zone, however, is facing greater urban development. Other nonurban land-uses are remaining stable. The Delta remains a popular venue for hunting and fishing and 12% of the state’shunting and 8% of the state’s fishing licenses are sold in the region.18
PRODUCTION BY LAND USEDefinitionAgricultural land use refers to the number of acres devoted to particular crops.Data are derived from the National Agricultural Statistics Service CropScape satelliteimagery, which covers over 300 distinct land-covers in the Delta. Satellite imagery iscollected and interpreted annually by the United States Department of Agriculture.We use CropScape to match the 2011-2015 year range of other indicators. WhileCalifornia has state-specific data through the Farmland Mapping and MonitoringProgram (FMMP), data for comparable years are not readily available. In addition,CropScape allows users to select a specific geography for analysis, thus allowing theprimary zone and secondary zone boundaries to be utilized.Why is this indicator important?Knowing the largest crops by acreage in the Delta can help predict which cropservices and supporting industries will be needed in future years based on theexisting agricultural base.How is the Delta doing?A total of 333,000 acres were in active production in the primary zone in 2015. Inthe primary zone, the top five crops by total land-cover in 2015 were alfalfa (25% ofthe total area in active production in the primary zone, 84,000 acres), cor
indicators at the Delta Protection Commission meeting in November 2016, 22 indicators were identified across six categories to be included in the final report. The final set of indicators was selected with an understanding that they are not an exhaustive me