Transcription
Creative Inquiry Electronics ProjectLab Manual NI myDAQ 1
TABLE OF CONTENTSIntroduction . 5LabVIEW Package and Driver Installation Tutorial for ENGR 190. 5Basic Troubleshooting . 6Files on ENGR190 VIs.zip . 7Lab 01: myDAQ, LabVIEW , and MySnapTM . erview . 8Topics covered in Lab 01 . 8Objective: . 8What You Need: . 8Instructions:. 9Resistors . 11Insulators . 12Review . 12MyDAQ and LabVIEW : . 12Building the Front Panel: . 13Coding Strategy: . 17How It Works: . 19Storing Data: . 19Tips and Tricks: . 20Lab 02 (Part I): Multisim & Resistors in Series . 212.12.22.32.42.52.62.7Topics covered in Lab 02 (Part I) . 21Objective: . 21What You Need: . 21Multisim & Circuit Emulation . 22NI myDAQ and Real World . 23LabVIEW . 24How It Works: . 25Lab 02 (Part II): Multisim and Resistors in Parallel . 262.82.92.102.112.122.13Topics covered in Lab 02 (Part II) . 26Objective: . 26Multisim & Circuit Emulation . 26MyDAQ & Real World . 27LabVIEW : . 28Review . 29Lab 03: Voltage Generators and Viewers . 303.13.23.33.43.53.63.7Topics covered in Lab 03 . 30Objective: . 30What You Need: . 30Definitions . 30Water Pipe Analogy . 31Building in the Lab: AC and DC Voltage Sources . 33Summary . 36Lab 04: Ohms Law . 374.14.24.34.44.54.6Topics covered in Lab 04 . 37Objective: . 37What You Need: . 37Ohms Law: . 38Multisim: Virtual World . 38MySnapTM: Real World . 402
4.74.84.9Hardware Limits . 41Summary: . 43Know Your Equipment Review: . 43Lab 05: Kirchhoff's Voltage Law . 445.15.25.35.45.55.65.7Topic covered in Lab 05 . 44Objective: . 44What You Need: . 44The Circuit:. 45Multisim Verification of Kirchhoff’s Voltage Law (KVL): . 45MyDAQ DMM Measurements. 45Sources for Error . 46Lab 06: Capacitors . opics covered in Lab 06 . 47Objective: . 47What You Need: . 48Water Pipe Analogy: . 48Understanding Capacitor Properties:. 49Multisim Capacitor Circuit:. 50More About Capacitor Properties: . 51Transient Responses: . 52RC time constant:. 53The Real World - MySnapTM: . 54Actual Values and Tolerances: . 55LabVIEW RC Meter: . 56How it Works: . 57Review: . 57Lab 07: Inductors . opics covered in Lab 07 . 59Objective: . 59What You Need: . 60Water Pipe Analogy: . 60In electric circuits:. 61Multisim Inductor Circuit: . 62More About Inductor Properties:. 62Transient Responses: . 63RL time constant: . 64The Real World - MySnapTM: . 64Actual Values and Tolerances: . 66LabVIEW LCR Meter: . 66How it Works: . 68Review: . 68Lab 08: The Diode . 708.18.28.38.48.58.68.78.88.98.108.11Topics covered in Lab 08 . 70Objective: . 70What You Need: . 71Water Pipe Analogy: . 71In Electronic Circuits: . 72Multisim Diode Circuit: . 73AC to DC Conversion: . 73More About Diode Properties: . 73The Real World Diode: . 74Diode (D1) Measured Parameters . 76Diode Equation . 773
8.12Review: . 78Appendix A: Basic Definitions and Conventions . 79Appendix B: Multisim Setup . 83Appendix C: Building Snap-Circuits . 84Appendix D: Worksheets . 854
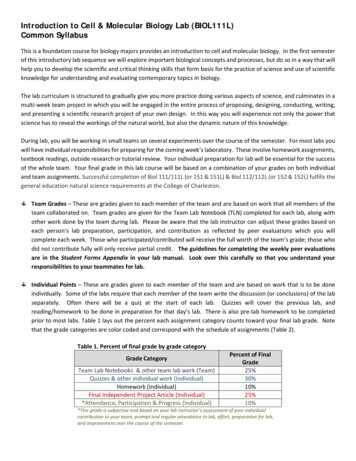
IntroductionThis document is based on the “Learn-by-Doing” principle because simplyreading about a technical subject is not the best way to learn. After all, you don'tread about putting together a jigsaw puzzle, you put the puzzle together to solvethe picture! Reading about a maze may help you to move through but doing themaze gives you the course you must take to get through it. Engineering is thesame way. You must actually build circuits and programs in order to reallyunderstand the concepts.The topics are covered in a straightforward, simplified manner whichallows you to quickly understand the fundamental principles. After the main topicof each chapter is introduced, sub-topics are explored in a step by step mannerwith explanations given for each new engineering principle. Each chaptercontains single topic-usually. First, you read about the topic and then you seeexamples that let you work in the virtual world to understand how the conceptscan be applied to actual circuits. You then work in the real world with realelectronic components to see how they differ from the mathematical models andwhat their limitations might do to an engineered design.Each section finishes with a review of what was covered in the material inthat section. The principles usually come from the text or are deducible from thetext, but occasionally you might need to experiment a little to really understandhow to use them. After completing each section you'll begin to understand moreof the concepts and realizing that now you know the answers can be a bigconfidence builder.LabVIEW Package and Driver Installation TutorialIt is important that student should install all the required software for the coursebefore continuing to next section. A tutorial is provided on course webpage forstep by step installation of the LabVIEW, NI Multisim and MyDAQ drivers.5
WARNING: SHOCK HAZARDNever connect any component or lead to electrical outlets in any way!WARNING: EXTERNAL POWER SOURCESUse external power sources or batteries at your own risk as they may causedamage to components or Computer USB ports.Basic Troubleshooting1. Most circuit problems are due to incorrect assembly, always double checkthat your circuit exactly matches the drawing for it.2. Be sure that parts with positive or negative markings are positioned asshown in the drawings.3. Be sure that all connections are securely fastened.4. Always use a power switch to remove power when building circuits.5. Always check circuits before turning on power.6. Use myDAQ digital multi-meter (DMM) to test MySnap components if theyappear to be damaged or not working properly.7. Use eye protection when experimenting on your own circuits.8. Always remove power if circuit does not perform properly, and then usemyDAQ DMM to check circuit for shorts or opens.6
Files on ENGR190 VIs.zipThe ENGR190 Vis.zip file is available to students on following course rad/ElectronicsProject.htmlStudents should download above file and unzip in on his/her computer. The Zipfile contains LabVIEW VIs and other files which will be used in some of theexperiments during the course. Resistors.pdf - Description of how resistors are manufactured andconstructed. Cap.gif - Water pipe analogy of a Capacitor. Coil.gif - Water pipe analogy of an Inductor. Diode.gif - Water pipe analogy of a diode. RinParallel.gif - Water pipe analogy of two resistors in parallel. VI’s on zip file: C Meter.vi, Diode.vi, LCR Meter.vi, PartsTest1.vi, R Graph.vi,RinSeries.vi, Karaoke myDAQ.vi7
Lab 01: myDAQ, LabVIEW , and MySnapTM1.1 OverviewThis section explores using a National Instruments myDAQ to measure theresistance Conductors, Insulators, and Resistors. The measurements will betaken with the myDAQ DMM (Digital Multi-Meter). The components needed aresupplied in the MySnap kit for myDAQ. Real life applications apply to anyoccupation that uses electrical components or devices.1.2 Topics covered in Lab 01 Objective What You Need Instructions Resistors Insulators Review myDAQ and LabVIEW Building the Front Panel Coding Strategy How It Works Storing Data Tips and Tricks1.3 Objective:Use the DMM terminals on the NI myDAQ and LabVIEW to measure and recordthe DC resistance of various conductors, resistors, and insulators supplied in theMySnapTM kit.1.4 What You Need: NI myDAQ Computer with LabVIEW and NI ELVISmx installed MySnap kit8
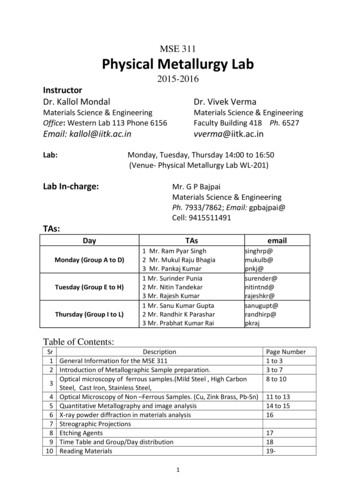
1.5 Instructions:Assemble the circuit shown in Figure 1-3 using MySnap kit.Connect the myDAQ to your computer system with the proper software installed.Click on the DMM button in the Instrument Launcher when it appears.Figure 1-1When the Digital Multimeter window appears; Click on the run button. Click on the sound button. Connect leads as shown below.TO COMPUTERFigure 1-232322312111111131K ResistorsFigure 1-3210K Resistors1100K Resistor2111231423CONDUCTORS9
The DMM should appear as shown inFigure 1-4 and if computer sound isactivated a beep will indicate a lowresistance. The actual value of theresistance is shown on the display as1.5 Ohms and should be less than 3ohmsforyourreading.Theresistance measured is for the redsnap lead, shorting snap wires 1(x1),2(x6), 3(x2), 4, 5, 6, & 7, and theblack snap lead all in series. Likegarden hoses connected one afterthe other, the same current flowsthrough each conductor. If any one ofFigure 1-4these is open the DMM will read asOPEN. Snap the red and black DMMleads across press switch S2 to verify that it is near zero when ON and OPEN whenOFF. The lowest the DMM ohm scale can read is 0.1 ohms. Snap the meter lead tipstogether and observe the amount of resistance in the leads themselves. This processcan be repeated for each snap piece connected to the series chain by placing the DMMred snap lead on the open end of thatFigure 1-5component.Click Run buttonClick on Ω buttonChange to Specify RangeSet range to 200 ohmsSnap the DMM leads together to read theirresistance then change the range level tonext highest level. On this range, anythingbelow 1 Ω will read 0.10
TO COMPUTER1.6 ResistorsFigure 1-6Change the mode to Auto on the Ohm Measurement Setting of your myDAQDMM and read the values for the resistors by placing the red probe snap at:PRINT LAST PAGE IN THIS MANUAL FOR YOUR WORKSHEET1Strips (1-7 in series)Value of reading (shown above)2S1ONValue of reading2S1OFFValue of reading3R1Value of reading4R2Value of reading5R2Value of reading6R2Value of reading7R2Value of reading8R2Value of reading9R4Value of reading10 R4Value of reading11 RVmax SLIDER UPValue of reading12 R5Value of reading13 RVmin SLIDER DOWNValue of reading11
1.7 InsulatorsUsing the DMM pointed probes try measuring the resistance of the myDAQ case,the MySnapTM base grid, or the outside of the wire on the jumper leads. Takecare when measuring wire insulation and do not push points into the insulation.Use the flat side of the probe tips.1.8 Review Conventional electric current moves from the positive surplus side of thebattery ( ) to the deficiency side of the battery (-)Conductors allow electrical current to easily flow because of their freeelectrons.Resistors allow current to flow to some degree in proportion to theirresistance in ohms.Insulators oppose electrical current.The MySnapTM system includes components that can be classified asconductors, resistors, or insulators.The myDAQ DMM can be used to determine the class of a componentand can measure the value of resistance in most components that are notinsulators or good conductors.1.9 MyDAQ and LabVIEW :LabVIEW was designed to quickly check and record electronic data. In thissection you will use LabVIEW to measure and record the resistance values ofthe components you measured previously. Each part will be measured and datarecorded in a similar fashion to the testing performed when these componentswere manufactured. The numeric indicator will display the instantaneous valueand the table will store the data when the record button is clicked. The values willbe graphed for a quick visual display of all the values.Open LabVIEW program that has been installed on your computer. When thegetting started screen appears, pick the Blank VI option to build the program thatwill be used to check your MySnapTM parts. Your process will be as follows;1.) Build the front panel screen.2.) Open the programming window and build program to drive front panel.3.) Measure, Display, and Store resistive data about each part.12
1.10 Building the Front Panel:After opening a blank VI, right click on the background and bring up the ControlsExpress screen.Figure 1-7Click on the Text Inds to bring up the Express Table then click on the Table Icon andplace it on the front panel.Right click on the table and open theproperties window to make thetable that will record the data weare going to measure.Figures 1-813
ght and Width settings.Figure 1-9Save the front panel as PartsTest1.VI. Add the XY graph screen by;Right click to get theExpress menu,ThenclickontheGraph icon to get theXY Graph and place iton the front panel nextto the table as shownFigure 1-10on the next page.14
Right click on the XYGraph frame to bringup its menu andselect visible pane.Adjust the visibleitems as shown onnext page.Set checked items asshown here.Click on Propertiesand make changesshown in blue boxesfirst then set the otherproperties in the ordershown in the redboxes below.Double Click on words andchange to read as shownin Figure 1-10Figure 1-11Can change X-axis & Y-axislabels by double clicking orby method shown in Fig. 1-1214Change this next to“Resistance”.Change this first to show“Reading Number”.23Figures 1-1215
After adjusting the graph, add the row headings for the measurements to thetable.Then add two indicators by right clickingthe front panel and picking the Num Indsicon from the Express menu.Finally add the buttons shown here.Record was an OK button with textchanged to RECORD.Under window on the main menu click“Show Block Diagram”. A window similar toFigure 1-13the following will open;Before we proceed with the coding, let’sFigure 1-14add the myDAQ multi-meter to the blockdiagram by following these steps.1. Be sure your myDAQ is connected2. Press Ctrl-Space to bring up theQuick Drop Window (takes a few minutes toload on the first use)3. Search for DAQ Assistant and double click on it when it appears in the list4. Drop it on the Block diagram (white window)5. When the Create a New Express Task configuration pane appears, selecta. Acquire Signalsb. Analog Inputc. Resistanced. Dev 1 (NI myDAQ) *Note: If you have other NI hardware installed, themyDAQ will not be Dev1.e. DMMf.Finish6. Timing Settings should be 1 Sample (On Demand), Iex Source should be set toInternal, and Signal Input Range should be 200K in top box and 0 in bottom box.7. Press OK16
1.11 Coding Strategy:A front panel to display the resistance values in a numerical indicator, a table tostore this data, and a graph to display data has been created in LabVIEW . Wewill acquire the data using the DAQ Assistant you just placed on the blockdiagram and then pass the data to the indicator. After the reading appears, wewill store the data in the table and on the graph. The reading number is thenincremented, the resistance probe is moved, and the process is repeated.Figure 1-15: Coding Block DiagramAcquire SeriesRecord Value in TableMove to Next DataResistance on DMM& Plot on GraphPoint and RepeatTerminalsProcessCancel Process andReset Table &GraphThe LabVIEW block diagram will be very similar to the coding block diagram.After some wiring and clean up, add a “while Loop” to repeat the process.Right Click on white area or empty space to bring up programming window. Clickon while loop under structures and use it to surround all the objects in the blockdiagram. Add wiring from stop button and data source.Use this icon toadd for Loop.To expand theboxes use pulldown arrow atbottom of box.Figures 1-16Place For Loop here.17
It is highly recommended to learn LabVIEW you add logic and numeric functionsto block diagram as shown here and save your work as PartsTest1.VI.Items added From Boolean;OR GateBool to 0,1From Numeric;DBL NumericIncrementFrom Comparison;SelectLeft double click“build table” andadjust to decimal.Replace tunnelswith shift registerto get orange arrowsby right click on tunnel.Figure 1-17LabVIEW PartsTest1 Block DiagramRun LabVIEW andPartsTest1.VI from ENGR190 Vis.zip or your savedprogram to open the front panel screen. With S1 “ON”, use Figure 1-6 to movered snap lead to the number shown in the Reading # indicator before clicking therecord button.Y scale has been changedfrom log to linear, and fromautomatic to min of –1100and max of 110000.Figure 1-1818
{THE PREVIOUS VIRTUAL INSTRUMENT WAS SHOWN IN DETAIL TO HELPTHE USER UNDERSTAND THE POWER OF LABVIEW . FUTURE VI’S WILLBE PROVIDED WITHOUT THIS IN DEPTH DETAIL.}1.12 How It Works:Inside the while loop on the upper-left is the DAQ Assistant used to input theresistance data from the DMM terminals. The resistance values are indicated onthe front panel in the Measurements numeric indicator labeled “Resistance”. Inthis VI the DAQ Assistant is configured for on-demand input on the analogchannel. Therefore every time the red snap lead is moved, the ResistanceIndicator will be updated. After the record button is clicked, the Reading numberwill increment for the next reading. The red snap in Figure 1-7 should always beon the number label that is the same as the Reading # when the record button isclicked.1.13 Storing Data:After table is populated with data and the graph is finished, they can be stored ina word document, spread sheet, or picture file by right clicking on the front panelobject and using the export menu. Figure 1-19 shows “Export Simplified Image”storage of the data and chart shown in Figure 1-18.Figure 1-1919
1.14 Tips and Tricks: Run the animated gif file called RinParallel.gif that is on the MySnap disc for ananalogy of resistance using water pipes. The top water pipe is filled with rocksand has low resistance, while the lower pipe is filled with sand and has highresistance.Review the Resistors.pdf file for more information on how resistors aremanufactured and the different types of resistors.Use the R Colors.exe program on MySnap disc to get values of standardresistors and to determine their markings. You can use the phrase { BlackyBrown Rode Our Young Green Bull “ Violence Gone Wild”} to remember thevalue of each WILDFigure 1-20 BLACK BROWN RED ORANGE YELLOW GREEN BLUE VIOLET GREY WHITE 0 1 2 3 4 5 6 7 8 9A four band resistor is shown in the charton the left using the color code above.On the bottom of the chart a five bandresistor is shown. Note that one band isused as a multiplier to cover the fullrange of resistance. The R Colors.exeprogram on the MySnapTM CD will alsotell you if the value is available and canbe bought from standard sources.20
Lab 02 (Part I): Multisim & Resistors in SeriesThis portion explains using Multisim, myDAQ, LabVIEW , and MySnapTM to study andobserve the effect of resistors that are connected in a manner that forces the samecurrent to pass through each resistor. This type of connection is called seriesconnection.2.1 Topics covered in Lab 02 (Part I) Objective What You Need Multisim & Circuit Emulation MyDAQ & Real World LabVIEW How it Works2.2 Objective:Use Multisim to emulate and study a circuit on a computer, and then use myDAQwith LabVIEW to measure and observe the same circuit as resistors are placedin series on the MySnap base. Real life applications apply to any occupationthat uses electronic test equipment to measure resistance.2.3 What You Need: Multisim NI myDAQ LabVIEW MySnap BASIC ELECTRONICS EE100 kit Computer System with above software installed.21
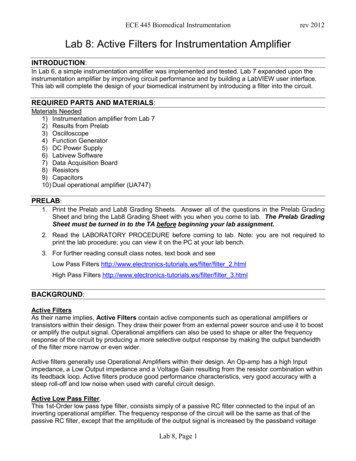
2.4 Multisim & Circuit EmulationOpen NI Multisim program and start a new Design. Save the design as “SeriesResistors”. Place the resistors on the grid as shown below. Add Multimeter and doubleclick its icon to open the display. Start with Ground at C2, (Fig 2-2).Click OhmMust have red dot orground wire is notconnected.Double right click atjunction to connect ifdot is missing or moveground and make anew lead to connect.Figure 2-1Click run button to display value then click stop button. Move ground to C5 as shownabove and repeat measurement. Move ground (easier to move than wire in Multisim) toC8 and other points as shown here and repeat process. Enter results in Table belowunder Multisim column.Junction Multisim MyDAQC2C5C8C2C5C8D10D7D4E2E4D10D7D4E2Figure 2-2E422
2.5 NI myDAQ and Real WorldOpen the myDAQ multimeter with the NI ELVISmx Instrument Launcher and set to ohmsin auto mode. Use MySnapTM kit to build the circuit shown here. Connect the leads asshown below and read the resistance. Record the first reading in the table above underthe myDAQ column. Move the black snap lead (ground lead to match Multisim) to basegrid locations C5, C8, D10, D7, D4, E2, and E4. Enter new reading with each move tocomplete the column data.Figure 2-3Figure 2-4 shows DMM reading at positionC5. As the process is repeated for C8, D10,D7, D4, E2, and E4 the resistance willincrease. The bar graph under the readingshows the % of the full scale reading for thisvalue. Because the Mode is set to auto, thescale will change as required for bestreading.Figure 2-423
2.6 L
Students should download above file and unzip in on his/her computer. The Zip file contains LabVIEW VIs and other files which will be used in some of the experiments during the course. Resistors.pdf - Description of how resistors are manufactured and