Transcription
POWER ELECTRONICS LAB MANUALPrepared By:MUHAMMEDALI SHAFEEQUE KAl Ameen Engineering College
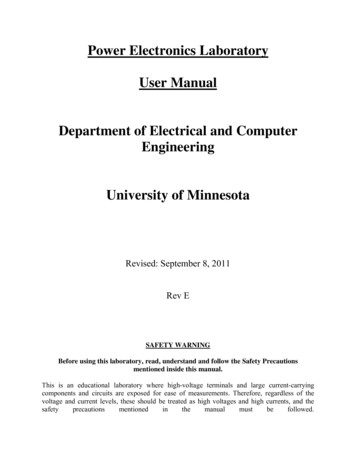
Al Ameen Engineering College,KulappullyS7 Power Electronics LabEXPERIMENT 1SINGLE PHASE FULLY CONTROLLED SCR BRIDGE CIRCUITAIM:i.ii.To study operation of single phase fully controlled rectifier for R loadTo study operation of single phase fully controlled rectifier for RL load with and withoutfreewheeling diodePRINCIPLE:Circuit diagram of single phase fully controlled rectifier consists of four SCRs. During the positivehalf cycle, SCRs T1 and T2 are forward biased and can be fired for conduction applying a positivevoltage to their gate with respect to cathode. At ωt α, SCRs T1 and T2 are triggered, then thecurrent flows through the P– T1- R load – T2 – N. At ωt π, supply voltage falls to zero and thecurrent also goes to zero. Hence SCRs T1 and T2 turned off. During negative half cycle (π to 2π),SCRs T3 and T4 forward biased and can be fired for conduction applying a positive voltage to theirgate with respect to cathode. At ωt π α, SCRs T3 and T4 are triggered, then current flows throughthe path N – T3 – R load- T4 – P. At ωt 2π, supply voltage and current goes to zero, SCRs T3 andT4 are turned off. The Fig-3, shows the current and voltage waveforms for this circuit.PROCEDURE:1. Complete the connections as per the circuit diagram.2. Keep the firing angle controlling knob at 00 position.3. Keep switch S1 in internal position for using internal control voltage of gatetrigger circuit.4. Keep switch S2 and S3 in on position.5. Turn on the power switch6. Observe the input voltage waveform using CRO7. Observe the output voltage waveform, SCR voltage and gate signals for variousfiring angleRESULT:Studied operation of single phase fully controlled SCR rectifier circuit for both R and RL load.Department of Electrical And Electronics
Al Ameen Engineering College,KulappullyCIRCUIT DIAGRAM:WAVEFORMS:Department of Electrical And ElectronicsS7 Power Electronics Lab
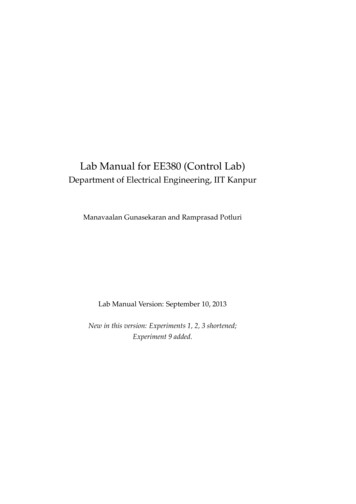
Al Ameen Engineering College,KulappullyS7 Power Electronics LabEXPERIMENT 2R AND RC FIRING CIRCUIT FOR SCRAIM:To study operation of R and RC firing circuit for SCR.THEORY:RESISTANCE FIRING CIRCUIT:Resistance trigger circuits are the simplest & most economical method. During the positive half cycleof the input voltage, SCR become forward biased but it will not conduct until its gate current exceeds gatethreshold, Vgt . Diode D allows the flow of current during positive half cycle only. R1 is the variableresistance and is used to limit the current through the circuit (Ig) and to vary the gate voltage and thus thefiring angle. During the positive half cycle current Ig flows. Ig increases and when Vg Vgt IgminR theSCR turns ON .The firing angle can be varied from 0 — 90 by varying the resistance R1.RC FIRING CIRCUIT:By varying the variable resistance R1, the firing angle can be varied. Capacitor, C charges anddischarges with a phase shift. When the capacitor voltage equal to the gate threshold voltage V gt,SCRget triggered. Diode D prevents the negative voltage to gatePROCEDURE:RESISTANCE FIRING CIRCUIT:1.2.3.4.5.Complete the connections as per the circuit diagram.Keep the potentiometer R1 in minimum position (maximum resistance in the circuit)Turn on the power switchObserve the output voltage waveform, SCR voltage and gate signals for various firing angleObserve the range of firing angle control.RC FIRING CIRCUIT:1. Complete the connections as per the circuit diagram.2. Keep the potentiometer R1 in minimum position (maximum resistance in the circuit)3. Turn on the power switch4. Observe the output voltage waveform, SCR voltage and gate signals for various firing angle5. Observe the range of firing angle control.RESULT:Studied the operation of R and RC firing circuit for SCR for different firing angles.Department of Electrical And Electronics
Al Ameen Engineering College,KulappullyCIRCUIT DIAGRAM:RESISTANCE FIRING CIRCUIT:RC FIRING CIRCUIT:Department of Electrical And ElectronicsS7 Power Electronics Lab
Al Ameen Engineering College,KulappullyWAVEFORMS:RESISTANCE FIRING CIRCUIT:RC FIRING CIRCUIT:Department of Electrical And ElectronicsS7 Power Electronics Lab
Al Ameen Engineering College,KulappullyDepartment of Electrical And ElectronicsS7 Power Electronics Lab
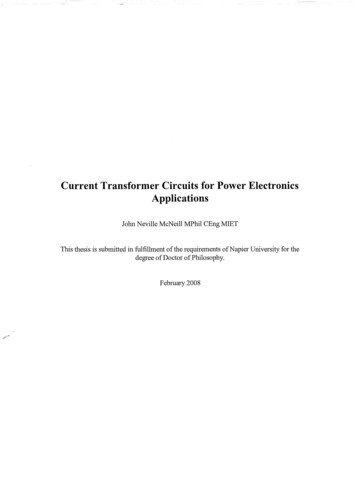
Al Ameen Engineering College,KulappullyS7 Power Electronics LabEXPERIMENT 3UJT TRIGGER CIRCUIT FOR SCRAIM:To study the operation of UJT firing circuit for SCR.THEORY:A synchronized UJT triggered circuit using an UJT is shown in the figure. Diode Rectifier convertsinput ac to dc. Resistor R limits the circuit current to a suitable value for the zener diode and UJT.Zener diode ‘Z’ functions to clip the rectified voltage to a standard level. The zener voltage V2 isapplied to the RC charging circuit. Charging of capacitor C is at a rate determined by R1 andR3.When voltage across the capacitor,V3 reaches the unijunction threshold voltage ηV2, the UJTjunction breaks down and the capacitor C discharges through the primary of pulse transformer. Asthe current is in the form of pulse, windings of the pulse transformer have pulse voltages at theirsecondary terminals and can turn on the SCR.As the charging rate of capacitor varies by varying R3,firing angle can be controlled by varying R3.Firing angle can be controlled in a range of 0 0 to 1800 .PROCEDURE:1.2.3.4.5.Complete the connections as per the circuit diagram.Keep the potentiometer R1 in minimum position (maximum resistance in the circuit)Turn on the power switchObserve the output voltage waveform, SCR voltage and gate signals for various firing angleObserve the range of firing angle control.RESULT:Studied the operation of UJT firing circuit for SCR for different firing angles.Department of Electrical And Electronics
Al Ameen Engineering College,KulappullyCIRCUIT DIAGRAM:WAVEFORMS:Department of Electrical And ElectronicsS7 Power Electronics Lab
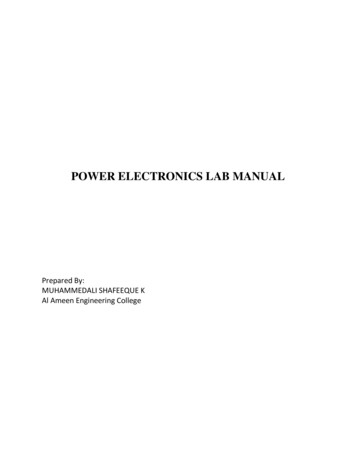
Al Ameen Engineering College,KulappullyS7 Power Electronics LabEXPERIMENT 4SIMULATION OF THREE PHASE CONTROLLED RECTIFIER CONVERTERAIM:i.ii.To simulate three phase controlled rectifier circuit for R load and R L load in MATLABTo compare the theoretical and simulation results for different firing anglesSIMULATION BLOCKS:AC voltage source, Thyristors,Pulse Generators (for Thyristor gate pulse) , Series RLC block (forR and RL load) ,Voltage and Current measurement blocks, Mean Value block, THDmeasurement block, Scope and Display blocks, Powergui block (Continuous).THEORY:Figure shows the circuit diagram of three phase bridge controlled rectifier. It consist of upper group(T1,T3,T5) and lower group (T2,T4,T5) of thyristors .Thyristor T1 is forward biased ad can be triggeredfor conduction only when Va is greater than both Vb and Vc. From figure this condition occurs at wt 300.Hence T1 can be triggered only at wt 300.If firing angle is α, then T1 starts conduction at wt 30 α andconducts for 1200 where it get commutated by turning on of next thyristor ie,T3.Similarly triggeringinstant for T3 and T5 are determined when considering Vb and Vc respectively. For lower group T4,T6and T2, negative voltages,ie,-Va,-Vb and -Vc respectively are considered. Thus the forward bias instantand triggering instants are obtained 150210270330Department of Electrical And ElectronicsBias Triggeringinstant(degree)30 α90 α150 α210 α270 α330 αConductionperiod(degree)30 α to 150 α90 α to 210 α150 α to 270 α210 α to 330 α270 α to 390 α330 α to 450 α
Al Ameen Engineering College,KulappullyS7 Power Electronics LabAverage Value of output voltage is given by𝑉𝑎𝑣𝑔 3 3𝑉 𝑐𝑜𝑠𝜋 𝑚𝛼where 𝑉𝑚 is the maximum value of phase toneutral voltageAverage Value of output current is given by𝐼𝑎𝑣𝑔 3 3𝑉 𝑐𝑜𝑠𝜋𝑅 𝑚𝛼where R is the load resistancePROCEDURE:1. Create a new MATLAB model file and create the MATLAB model as shown in figure 2corresponding to the three phase controlled rectifier circuit.2. Give the run time value as 0.1 secs to obtain simulation results for 5 input cycles(5x1/50HZ 0.1 sec)3. In MATLAB command window give the value of variable ‘a’ (assigned in pulse generatorblocks) which is equal to firing angle in degrees.4. Run the simulation model and obtain the results.5. Repeat the simulation for different values of firing angle for both R and RL load.RESULT:i.ii.Simulated single phase controlled rectifier circuit for both R and RL load using MATLABCompared the simulation results obtained with theoretical calculations.Department of Electrical And Electronics
Al Ameen Engineering College,KulappullyS7 Power Electronics LabMATLAB MODEL:OBSERVATIONS:Input Peak Voltage 100 V, Frequency 90Theoretical CalculationsSimulation Results(in Average Output Average Output Average Output Average Output THD of SourceVoltage (V)Current (A)Voltage (V)Current (A)Current (in %)Department of Electrical And Electronics
Al Ameen Engineering College,KulappullyWAVEFORMS:(a) R load: α 300(b) RL load: α 300Department of Electrical And ElectronicsS7 Power Electronics Lab
Al Ameen Engineering College,KulappullyS7 Power Electronics LabEXPERIMENT 5SIMULATION OF THREE PHASE SINE PWM INVERTERAIM:i.ii.To simulate Three Phase Sine PWM Inverter for R Load in MATLABTo compare the theoretical and simulation results for different values of modulation index.SIMULATION BLOCKS:DC voltage source, MOSFET , Series RLC block (for RL load) ,Voltage and Current measurementblocks, Mean Value block, THD measurement block, Scope and Display blocks, Powergui block(Continuous).THEORY:Figure shows the three phase inverter circuits with on and off controlled switches such as MOSFET orIGBT. Sine PWM pulses are used to gate the switches. Upper switches are gated with signals obtained bycomparing three reference sine waves each are phase shifted with 1200 with a high frequency triangularcarrier wave. Thus switches are ON when amplitude of corresponding reference sine wave is greater thanamplitude of triangular carrier wave. Lower switches are gated with a gate signal which is complement ofupper switches of same leg.Rms Value of phase to neutral output voltage is given by𝑉𝑝 .𝑟𝑚𝑠 Department of Electrical And Electronics𝑚. 𝑉𝑑𝑐2 2
Al Ameen Engineering College,KulappullyS7 Power Electronics LabRms Value of line to line output voltage is given by𝑉𝐿𝑖𝑛𝑒 .𝑟𝑚𝑠 3 𝑚. 𝑉𝑑𝑐2 2PROCEDURE:1. Create a new MATLAB model file and create the MATLAB model as shown in figure 2corresponding to the three phase inverter circuit.2. Give the run time value as 0.1 secs to obtain simulation results for 5 output ac cycles(5x1/50HZ 0.1 sec)3. In MATLAB command window give the value of variable ‘m’ (assigned in reference sine blocks)which is equal to modulation index.4. Run the simulation model and obtain the results.5. Repeat the simulation for different values of modulation index.RESULT:i.ii.Simulated three phase sine PWM inverter circuit using MATLABCompared the simulation results obtained with theoretical calculations.Department of Electrical And Electronics
Al Ameen Engineering College,KulappullyS7 Power Electronics LabMATLAB MODEL:Subsystem (SPWM Generator):OBSERVATIONS:Input DC Voltage 500 VModulation index Theoretical Calculations(m)RMSRMSOutputPhase OutputVoltage (V)Voltage (V)0.850.750.60.5Department of Electrical And ElectronicsSimulation ResultsRMSRMSLine OutputPhase OutputVoltage (V)Voltage (V)Line
Al Ameen Engineering College,KulappullyWAVEFORMS:(a) Non filtered Line to Line output voltages (Va,Vb,Vc)(b) Phase to neutral output Voltages:(c) Line to Line output voltages:Department of Electrical And ElectronicsS7 Power Electronics Lab
Al Ameen Engineering College,KulappullyS7 Power Electronics LabEXPERIMENT 6DESIGN AND SIMULATION OF BUCK CONVERTERAIM:i.ii.To design DC-DC buck converter and simulate it with MATLABTo compare the theoretical and simulation results for different values of duty cycle.SIMULATION BLOCKS:DC voltage source, MOSFET , Series RLC block ,Voltage and Current measurement blocks, Scope,Powergui block (Continuous).THEORY:Figure shows the circuit diagram of step down DC-DC converter, commonly known as buck converter.When switch S is ON, diode D is reverse biased and voltage across inductor will be Vs-Vo. So inductorcurrent increases and attains apeak.When switch S is OFF, diode D is forward biased and voltage acrossinductor will be -Vo. So inductor current decreases. Hence inductor with diode ensures an uninterruptedcurrent flow and hence a constant output voltage with capacitor for removing voltage ripples.Output voltage is given by𝑉𝑜 𝐷 𝑉𝑠Where D is duty cycle and VS is input voltagePROCEDURE:1. Create a new MATLAB model file and create the MATLAB model as shown in figure 2corresponding to DC-DC buck converter.2. Give the run time value as 0.5 secs .3. Run the simulation model and obtain the results.4. Repeat the simulation for different values of duty cycles.RESULT:i.ii.Simulated DC-DC buck converter circuit using MATLABCompared the simulation results obtained with theoretical calculations.Department of Electrical And Electronics
Al Ameen Engineering College,KulappullyDESIGN OF CIRCUIT COMPONENTS:Input voltage, VS 100VOutput Voltage requiredVO 60 VOutput current IO 0.6 ASwitching frequency, fS 50kHZRipple allowed in inductor current, 𝐼 2mARipple allowed in capacitor voltage, 𝑉𝑐 50mVInductor,𝐿 𝑉𝑂 (1 𝐷) 𝑓𝑠 𝐼Capacitor ,C 8𝑂𝑓𝑉 (1 𝐷)2𝑠 𝑉𝑐 Load Resistance 𝑅 𝑉𝑂𝐼𝑂 MATLAB MODEL:Department of Electrical And ElectronicsS7 Power Electronics Lab
Al Ameen Engineering College,KulappullyS7 Power Electronics LabWAVEFORMS:(a) Output and input voltages:(b)Inductor voltage and current:OBSERVATIONS:Theoretical CalculationsSimulation ResultsOutput Voltage (V)Output Voltage (V)Duty Cycle (D)0.60.50.4Department of Electrical And Electronics
Al Ameen Engineering College,KulappullyS7 Power Electronics LabEXPERIMENT 7SIMULATION OF THREE PHASE INDUCTION MOTOR DRIVE
POWER ELECTRONICS LAB MANUAL Prepared By: MUHAMMEDALI SHAFEEQUE K Al Ameen Engineering College . Al Ameen Engineering College,Kulappully S7 Power Electronics Lab Department of Electrical And Electronics EXPERIMENT 1 SINGLE PHASE FULLY CONTROLLED SCR BRIDGE CIRCUIT AIM: i. To study operation of single phase fully controlled rectifier for R load ii. To study