Transcription
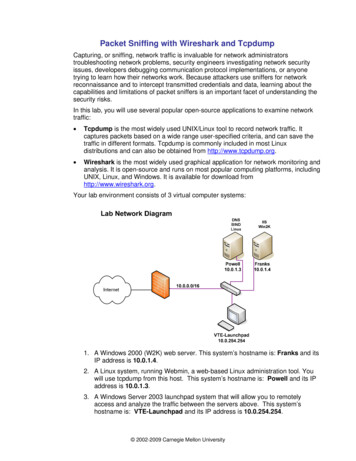
Packet Sniffing with Wireshark and TcpdumpCapturing, or sniffing, network traffic is invaluable for network administratorstroubleshooting network problems, security engineers investigating network securityissues, developers debugging communication protocol implementations, or anyonetrying to learn how their networks work. Because attackers use sniffers for networkreconnaissance and to intercept transmitted credentials and data, learning about thecapabilities and limitations of packet sniffers is an important facet of understanding thesecurity risks.In this lab, you will use several popular open-source applications to examine networktraffic: Tcpdump is the most widely used UNIX/Linux tool to record network traffic. Itcaptures packets based on a wide range user-specified criteria, and can save thetraffic in different formats. Tcpdump is commonly included in most Linuxdistributions and can also be obtained from http://www.tcpdump.org. Wireshark is the most widely used graphical application for network monitoring andanalysis. It is open-source and runs on most popular computing platforms, includingUNIX, Linux, and Windows. It is available for download fromhttp://www.wireshark.org.Your lab environment consists of 3 virtual computer systems:1. A Windows 2000 (W2K) web server. This system’s hostname is: Franks and itsIP address is 10.0.1.4.2. A Linux system, running Webmin, a web-based Linux administration tool. Youwill use tcpdump from this host. This system’s hostname is: Powell and its IPaddress is 10.0.1.3.3. A Windows Server 2003 launchpad system that will allow you to remotelyaccess and analyze the traffic between the servers above. This system’shostname is: VTE-Launchpad and its IP address is 10.0.254.254. 2002-2009 Carnegie Mellon University
Packet Sniffing with Wireshark and Tcpdump v1.11 Setting up the packet sniffer applicationsIn determining how to set up a network sniffer, the topography and type of the networkare key considerations. In particular, the difference between a switched network and ahub-based network plays a major role in what traffic is visible to the sniffer.When one host needs to communicate with another system it sends out an AddressResolution Protocol (ARP) broadcast to all hosts on its subnet to determine whetherone owns the destination IP address. ARP is an example of broadcast traffic that istraffic sent to all hosts on that switch or hub. Only the host with the desired IP addressshould respond to the ARP request, sending a reply that supplies its network interface’sunique MAC address. On a switched network, once communications begin between twohosts, their traffic is isolated by the switch to the physical link between the hosts.However, on a network hub, sometimes termed a repeater hub, the networkcommunications of all systems attached to the hub are copied to each system on thehub. Hubbed networks count on the attached systems ignoring the repeated traffic thatisn’t addressed to them.Passive Sniffing places a host’s network interface into promiscuous mode, whichmeans it captures everything it sees, including traffic addressed to other hosts. Onnetworks where repeater hubs are used this means capturing all hubbed traffic. Passivesniffing is also possible on some switches that have a SPAN or mirror port; a specialport to which all traffic is intentionally copied, by connecting the sniffer to this mirroredport. If the main interest for traffic analysis is traffic entering and exiting the localnetwork, then a passive sniffer positioned in parallel with the network gateway wouldprovide the best insight.The term active sniffing describes alternative tactics to sniff on a switched network. Asnoted, when a host on network needs to communicate with another, it uses ARPbroadcasts to request the correct network address of the destination. By design, onlythe host with the specified IP address should reply with its MAC address. However,there’s no security built into the ARP protocol, allowing another host running an activesniffer application to fake replies to the broadcast, supplying the sniffer’s MAC address.An active sniffer using ARP spoofing often tries to saturate the link with its replies tomake sure that the real destination’s MAC address is discarded or ignored. Using thismethod, the communications link will be established from the legitimate sender to thehost running the sniffing application. After capturing the packets, the active sniffer canthen forward them to the legitimate host.Another active sniffing method is MAC flooding. In this technique, a flooding toolgenerates a large number of packets with different, spurious MAC addresses. Networkswitches maintain a table of MAC addresses that map each address to the link thatcarries its traffic. If a switch is overwhelmed with too many frames to handle at once, orreceives so many MAC table entries that they exceed the maximum space allotted tothe table, some switches are configured to fail-open. That is, since the switch can nolonger reliably determine how to forward packets, it behaves like a repeater hub andpasses all traffic to all hosts.However, because different switches behave differently in response to active sniffingattempts and network performance generally suffers; active sniffing tactics are generallynot employed for legitimate network monitoring. In this lab, you will be passivelysniffing with freely available Linux and Windows tools. The network you will monitor willbehave like a hubbed network.2CERT Training and Education
Packet Sniffing with Wireshark and Tcpdump v1.11.1Start the Wireshark network analyzerWireshark can read capture traffic files from tcpdump, NAI's Sniffer, Sniffer Pro,NetXray , Microsoft's Network Monitor, and many others. It can grab live dataover Ethernet, FDDI, PPP, Token-Ring, IEEE 802.11, Classical IP over ATM, andloopback interfaces. Captured network traffic can be reviewed and analyzed via aGUI, or with a text-mode companion program ‘tethereal’. Capture files can beprogrammatically edited or converted, and Wireshark currently knows about andcan dissect hundreds of network protocols. Wireshark filters and parses trafficcaptures and can save output in various formats.1. From the Desktop of your VTE-Launchpad system, double click the Wireshark icon.2. On the toolbar menu select ‘Capture’, and then ‘Interfaces’.a. Select the button labeled ‘Options’ on the same line as the interface with theIP address 10.0.254.254b. In the resulting window, ensure the ‘Capture packets in promiscuous mode’option is checkedc. In the Name Resolution options, deselect the option to ‘Enable MAC nameresolution’d. Clear the text box next to the ‘Capture Filter:’ button.e. Accept all other default options and click the ‘Start’ button.f.Minimize the capture window and the Wireshark applicationFigure 1: Wireshark Options1.2Start capturing with tcpdump1. From the Desktop of your VTE-Launchpad system, double click the Putty SSH clienticon.2. Enter 10.0.1.3 for the Host IP address, and click the ‘Open’ button3. Click ‘Yes’, on the security alert4. Log in with username: root, password: tartansCERT Training and Education3
Packet Sniffing with Wireshark and Tcpdump v1.15. Type ifconfig and hit [Enter]. This will display information about your networkadapters, including IP address and system name. You will listen on the Ethernetinterface, eth0.6. To start tcpdump on this interface type:# tcpdump –i eth0 –s 1500 –w capture.txtThe target interface is designated by the ‘-i’ option. Tcpdump by default sends its outputto standard output, printing it to screen. With the ‘-w’ option, you can specify thecaptured traffic be saved to file instead. The ‘-s’ option indicates to Wireshark to storethe first 1500 bytes of each packet, instead of the default first 256 bytes of each packet.For more information about tcpdump options and configuration, see either theapplication’s man pages (man tcpdump) or, for a summary of command line usage,enter tcpdump --help.7. Minimize the Putty SSH session window.2 Generating sample network traffic2.1Unencrypted web browsing1. From the start menu of your VTE-Launchpad system, launch Internet Explorer.2. Enter Franks IP address following URL: http://10.0.1.4 in the address bara. Navigate to each of the four linked pages (‘News’, ‘References’, ‘Leaders’,and ‘Careers’).Figure 2: Franks webpage2.2Encrypted web browsing1. Access the Webmin application on Powell at the following URL:https://10.0.1.3:10000 (note the ‘https’, which signifies the SSL protocol)2. Click ‘OK’ on the security alert.3. Click ‘Yes’ on the security alert for the SSL certificate.4. Uncheck the ‘Continue to prompt when Web site content is blocked’ on the InternetExplorer Enhanced Security Configuration, and click ‘Close’.5. Log in with the username: root password: tartans, click the login button.4CERT Training and Education
Packet Sniffing with Wireshark and Tcpdump v1.16. Decline the auto complete prompt.7. Browse around several of the Webmin tabs (‘System’, ‘Servers’, ‘Networking’, etc.)and then log out by selecting the logout option in the top right.Figure 3: Powell Webmin8. Close Internet Explorer.2.3Telnet session trafficAttackers often use sniffers to harvest usernames and passwords transmitted withoutencryption over the network. It’s for this reason that authentication for network servicesshould be encrypted, as should remote administration sessions. The risks are welldemonstrated by capturing traffic from an unencrypted Telnet session.1. First, you’ll create a new user account for the Telnet session. From the Start menu,select ‘Administrative Tools Computer Management’.2. In the computer management interface, navigate to the ‘Local Users and Groups’section in the left pane and select ‘Users’. Right-click in the right pane and select‘New User ’ from the context menu.Figure 4: User Management3. Create a user with the name ‘telnet’ and password ‘tartans’. De-select the boxrequiring a password change on the next logon. Click ‘Create’.4. Click ‘Close’ to close the New User dialog.CERT Training and Education5
Packet Sniffing with Wireshark and Tcpdump v1.15. Now you need to make the user a member of the TelnetClients group to permitaccess to the system via telnet. Once the user is created, double-click the ‘telnet’user and, in the ‘Properties’ box, select the ‘Member Of ’ tab. Click the ‘Add ’button and type telnetclients into the entry box.6. Click ‘OK’ to add the user to the group and click ‘OK’ again to close the userproperties window.7. Close the ‘Computer Management’ window.8. Start the Telnet service on the VTE-Launchpad. From the Start menu, select‘Administrative Tools Services’.Figure 5: Service Administration9. Scroll down to the Telnet service entry anddouble-click it. In the resulting window,select ‘Manual’ start-up for Telnet and click‘Apply’. Then click the ‘Start’ button for theservice.10. Click ‘OK’ and then close the serviceswindow, after confirming that the Telnetservice is listed as running.Figure 6: Starting Telnet11. Click on the ‘Putty SSH client’ icon to open a new SSH client configuration screen.Do not restore the window of the existing Putty connection to Powell.12. Enter Powell’s IP address, 10.0.1.3 and establish a new SSH session with theUsername: root and Password: tartans.13. From Powell, telnet back to the VTE-Launchpad.# telnet 10.0.254.2546CERT Training and Education
Packet Sniffing with Wireshark and Tcpdump v1.114. Wait for the prompt, and then log in with username: telnet and password: tartans.Then list the contents of the C:\ directory with ‘dir C:’# dir C:Figure 7: Telnet session15. Quit the telnet session by typing exit. At the Powell command prompt, type exitagain to quit the SSH session.# exitCERT Training and Education7
Packet Sniffing with Wireshark and Tcpdump v1.13 Terminate the packet sniffers3.1Stop Wireshark1. Open the Wireshark Capture window and click the ‘Stop’ button.Figure 8: Wireshark capture dialog3.2Stop tcpdump1. Restore the minimized Putty SSH session with Powell, and press [Ctrl-C] tostop the capture. You will see a status window similar to Figure 8.Figure 9: Tcpdump packet capture4 Analysis with tcpdumpWith tcpdump, you can use expressions to match packets against a filter. Every field ofa packet can be used as a filter parameter, and you can use expressions when startinga capture or when replaying a capture file. Tcpdump expressions consist of one ormore of these qualifiers:typeAllows you to filter based on the addressing/ports within the packet. host, net,and port are all allowed keywords. Without any keywords, host is assumed.dirAllows you to narrow down the above type to the source or destination field inthe packet. The allowed options are src, dst, src or dst, and src and dst. Ifno direction is given, src or dst is assumed.proto Restricts the capture to a particular protocol. Some of the allowed protocols areip, ip6 (IPV6), arp, tcp and udp. If no protocol is given, all protocols matchingthe above type and direction are displayed/captured.Also, Boolean operators such as not, and and or can be used to further refine a filter.Follow the examples below to see how this works.8CERT Training and Education
Packet Sniffing with Wireshark and Tcpdump v1.14.1Replay the capture file1. If you wanted to replay the entire file of captured network traffic, you could use thecommand line:# tcpdump –r capture.txt2. All of the tcpdump filtering options available while capturing traffic, can be applied tofilter traffic replayed from a captured traffic file. Experiment with the followingcommands (note that you will use the “-tnn” options in each replay of the packetcapture file. ‘-t’ means don’t show timestamps, and “nn” means don’t translate IPaddresses or port numbers to names):tcpdump –tnn –r capture.txt arpThis shows the ARP broadcast traffic from the network’s three hosts.tcpdump –tnn –r capture.txt tcp port 10000All TCP traffic with a source or destination port of 10000 will be displayed.tcpdump –tnn –r capture.txt dst host 10.0.1.4All packets captured that had a destination address of 10.0.1.4 will be displayed.tcpdump –tnn –r capture.txt dst host 10.0.1.4 and tcp port80All packets captured that had a destination address of 10.0.1.4 and had TCPport 80 (the HTTP port) specified will be displayed, similar to below:Figure 10: tcpdump filtered outputtcpdump –tnn –r capture.txt not \(dst host 10.0.1.4 and tcp port80\)This expression is the opposite of the one before it. All packets not having adestination address of 10.0.1.4 and TCP port 80 (the HTTP port) specified willCERT Training and Education9
Packet Sniffing with Wireshark and Tcpdump v1.1be displayed. The backslash is required so that the Bash shell will notmisinterpret the parentheses characters.tcpdump –tnn –r capture.txt dst host \(10.0.1.3 or10.0.1.4\)This expression will capture all packets destined for either of two hosts, 10.0.1.3or 10.0.1.4.3. By default, tcpdump displays basic information about each packet that it captures.You can increase the information you see with the -v and -vv options. Try thiscommand:tcpdump –vv capture.txtThis will print the time to live, identification, total length and options in each packet. Ifyou add the -S option, you can see the output in hex along with ASCII.4. Note that the traffic displayed consists of header information and packet metadata,as opposed to the full contents of the transmitted packets. By default, Tcpdumpcaptures just the first 68 bytes of the packet. Using the ‘-s 0’ option has tcpdumprecord the full packet contents.5. Type exit to close the SSH session.5 Analysis with Wireshark5.1Working with capture data1. Restore Wireshark. To save the current capture file, select ‘File’, ‘Save As’. Typec:\capture.txt in the name text box, and click the ‘Save’ button.Figure 11: Saving a file in Wireshark2. The default view in Wireshark splits the window into three panes: a Packet List,Packet Details, and Packet Bytes. This view can be customized from the Viewmenu bar.10CERT Training and Education
Packet Sniffing with Wireshark and Tcpdump v1.13. Statistics reports can be generated from theStatistics menu, including summaryinformation and conversation totals.Figure 12: Wireshark summary statisticsFigure 13: Wireshark conversation statistics4. In the top pane, the capture data can be sorted by selecting any one of the displaycolumns including source, destination, and protocol.5.2Filtering and reassembling traffic1. A single TCP communication session can automatically be filtered andreassembled, including its contents, using the ‘Follow TCP Stream’ option. Findone of the http requests for ‘10.0.1.4’. Right click on that row and select ‘FollowTCP Stream’.Figure 14: Follow TCP StreamCERT Training and Education11
Packet Sniffing with Wireshark and Tcpdump v1.1You will see that the entire http session is displayed, including the http commands,server responses, and even the images transmitted.Figure 15: HTTP TCP Stream2. Close the TCP Follow Stream window, and then clear the filter on the mainWireshark window by clicking the ‘Clear’ button.Note: It is necessary to click the clear button each time after you examine thecaptured data with filters. This ensures that each new filter is then applied to all thepackets.3. Find the SSH traffic and the HTTPS traffic going to 10.0.1.3 port 10000. Performthe same steps to follow the TCP stream. Notice how the encryption of eachsession protects the packet contents.Figure 16: HTTPS TCP Stream12CERT Training and Education
Packet Sniffing with Wireshark and Tcpdump v1.15.3Building filter expressionsWireshark implements a powerful and flexible filtering language that allows the user toisolate packets by a range of criteria. In the filter bar, the Expression button allows youbuild a filtering expression in the GUI interface.1. To filter out traffic to Franks, click the ‘Expression’ button. Find the ‘IP’ variables.Select ‘ip.dst’, the double equals sign in the relation window ( ), and then specifyFrank’s IP address 10.0.1.4. Click ‘OK’. [Figure 17]Figure 17: Building a filter expression in Wireshark2. The expression has now been created for you. To apply the filter, click ‘Apply’ nextto the ‘Filter:’ expression box. You can add other expressions manually to this box, ifdesired. Clear the filter when you are done so that you are viewing all the capturedtraffic.3. To build an expression that captures the Telnet traffic between Powell and VTELaunchpad, type the following into the Filter expression box: ip.addr 10.0.1.3 and telnet. Click ‘Apply’. This captures any traffic to or from Powell’sIP address with the corresponding destination or source port the standard telnetport, tcp port 23.4. By expanding the telnet protocol dissector in the middle pane, you can review thecontents of the telnet session. If you examine the first few packets, you can see thehandshaking process as the telnet session was set up.Figure 18: Telnet session set-upCERT Training and Education13
Packet Sniffing with Wireshark and Tcpdump v1.15. In the top pane, right-click on a packet in the telnet conversation and select ‘FollowTCP Stream’. You will see the full contents of the reassembled clear-text telnetsession, including the login credentials for the ‘telnet’ account, which underscoresthe value of encrypting the authentication process and other sensitive traffic.6. You can mix and match filter expressions and use different operators, such as ‘! ’(not equal to). For example, ‘ip.dst ! 10.0.254.254 and ip.src ! 10.0.254.254’would filter out all tcp and udp traffic to or from the VTE-Launchpad, leaving trafficbetween other hosts. (Mainly broadcast traffic in this lab.)7. Wireshark can filter on its large range of known protocols. For example, specifyingthe Filter expression ‘msnms or aim’ will isolate Microsoft Messenger and AOLInstant Messenger traffic, if any were captured.5.4Decoding traffic carried over non-standard portsWireshark also allows you to parse and analyze traffic carried on non-standard ports forthe protocol. For example, Powell’s Webmin server uses the SSL protocol to encrypt itstraffic, but the server listens on tcp port 10000, rather than the standard HTTPS port of443. To provide more information about the SSL session, we can ask Wireshark to treattraffic to port 10000 as SSL traffic.1. Enter tcp.port 10000 in the Filter expression box to isolate the Webmintraffic. Apply the filter, then right click on a packet in the top pane. In the contextmenu, select ‘Decode as ’ and in the ‘Transport’ tab specify destination port10000 and scroll down to the SSL protocol in the selection frame.2. Click ‘OK’ to configure Wireshark to viewthis traffic as SSL traffic. Back in the toppane, you now see additional protocolinformation about the traffic, highlightinghandshake sessions for example. (Ofcourse, the session data is stillencrypted.) Click on the ‘ ’ to expand the‘Secure Sockets Layer’ (SSL) protocoldissector in the middle pane for moredetails about the session.Figure 19: Wireshark Decodeselection3. The ‘Decode as ’function is useful foranalyzing traffic thathas been redirectedover non-traditionalports. This mightoccur, for example, ifan attacker uses theHTTP tcp port 80 tocarry a telnet or SSHcommand channel.Figure 20: Applying the SSL decode to Webmin traffic14CERT Training and Education
Packet Sniffing with Wireshark and Tcpdump v1.15.5Extracting captured files using TCP ReassemblyWireshark can reconstruct transferred files from an HTTP stream (and about 19 otherapplication layer protocols). This can be useful in forensic situations when the clientand server systems are not available.1. In Wireshark, select ‘Edit Preferences’. Expand ‘Protocols’ in the left pane andscroll down to select TCP. Ensure the ‘Allow subdissector to reassemble TCPstreams:’ is checked.Figure 21: Transmission Control Protocol Preferences2. Select HTTP in the left pane. Ensure the top two options are checked.Figure 22: Hypertext Transfer Protocol Preferences3. Now search for all JPEG files in the current capture session. Type‘http.content type contains “jpeg”’ into the Filter box and click ‘Apply’.Figure 23: Search for all JPEG HTTP file transfersCERT Training and Education15
Packet Sniffing with Wireshark and Tcpdump v1.14. Select the first packet. Right click on ‘JPEG File Interchange Format’ in the middlepane and select ‘Export Selected Packet Bytes ’Figure 24: Export JPEG packet bytes to a file5. Save the file on the Desktop as ‘image.jpg’ and open it. You should see one of theimages from the Franks web server.6 Introduction to WindumpWinDump is the Windows-platform version of tcpdump. WinDump is fully compatible withtcpdump and can be used to watch and diagnose network traffic according to a flexible setof rules. It can run under Windows 95/98/ME, and under Windows NT/2000/XP. WinDumpand the Windows packet capture library on which it depends, WinPcap, are freelydownloadable from http://www.winpcap.org.16CERT Training and Education
Packet Sniffing with Wireshark and Tcpdump v1.1 . 1.1 Start the Wireshark network analyzer . Wireshark can read capture traffic files from tcpdump, NAI's Sniffer, Sniffer Pro, NetXray , Microsoft's Network Monitor, and many others. It can grab live data over Ethernet, FDDI,