Transcription
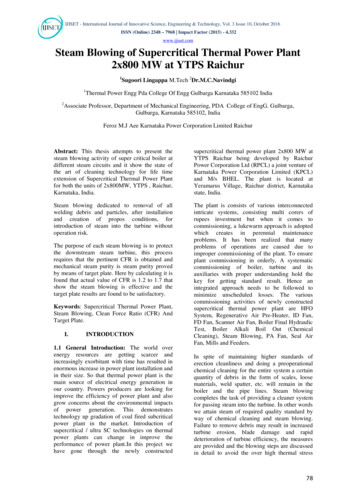
Processteknikens grunder (”PTG”)Introduction to Process Engineeringv.20144. Heat exchangers;Steam, steam processesRon ZevenhovenÅbo Akademi UniversityThermal and flow engineering / Värme- och strömningstekniktel. 3223 ; ron.zevenhoven@abo.fiÅbo Akademi University Thermal and Flow Engineering 20500 Turku Finland1/744.1 Heat exchangersÅbo Akademi University Thermal and Flow Engineering 20500 Turku Finland2/74
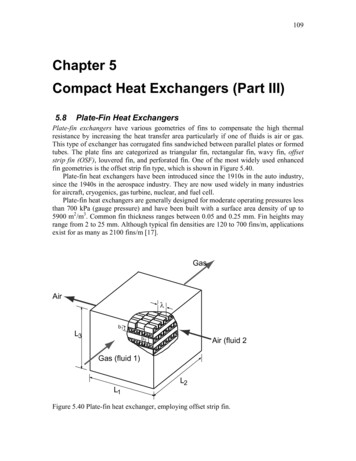
Heat exchangers: General /1 In a heat exchanger heat istransferred from one (hotter)material or material flow toanother (cooler) one. In most applications operatedunder steady-stateconditions, for heat exchangebetween fluid flows. External walls are wellinsulated to avoid heat lossesto the environment (except for3/74A shell-and-plate heat exchanger;widely used in power plants, oilrefineries and chemical process plants.most air cooling systems)picture: http://www.secshellandtube.com/model-info.htmlHeat exchangers: General /24/74 Also batch heat exchangers arewidely used. Phase transitions are possible,for example in evaporators orcondensors (and someapplications involving solids). Typical every-day-life examples:––––Cooking equipmentRefrigeratorsCar radiatorAir conditioning systemsA plate-and-frame heat exchanger;also widely used in food-processingindustry.picture: http://www.heatexchangers.org/
Heat exchangers: Geometries /15/74Schematics for(a) counterflow,(b) parallel flow,(c) crossflow,(d) 1 shell and 2tube passes, and(e) 2 shell and 4tube passes.pictures: KJ05Heat exchangers: Geometries /26/74Temperature distributionsof fluid in(a) counterflow,(b) parallel flow, and(c) 1 shell pass and 2 tubespasses.Schematic of mixed and unmixedflow heat exchangers:(a) One fluid mixed, one fluidunmixed, (b) both fluids unmixed.pictures: KJ05
7/74Heat exchangers: Geometries /3Temperaturedistribution in acounter-flow heatexchanger.Note: the exittemperature TC,oof the cold streamcan be higher thanthe exittemperature TH,oof the hot stream!picture: KJ05Heat exchangers: energy balanceHeat exchangerschematic withopen systemboundary aroundboth streams.Picture: SEHB06If energy losses to the environment are avoided, the energy balance forboth the cold and the hot stream are, (noting that no work is done,)using enthalpy h to include pV-effects (”flow work”), Q ΔH.Qcold Hcold - Hhot - Qhot. Hcold mcold· (hcold,out- hcold,in) mhot· (hhot,in- hhot,out) - HhotOften (modest temperature differences) it can be simplified to.mcold· cp,cold·(Tcold,out- Tcold,in) mhot· cp,hot· (Thot,in- Thot,out)Åbo Akademi University Thermal and Flow Engineering 20500 Turku Finland8/74
Overall heat transfer coefficient9/74 The heat transfer process* maybe described by a simpleexpression.Q U· A· T for temperaturediffence T ( C), heatexchange area A (m2) andoverall heat transfercoefficient U (W/(m2·K)(sv: värmegenomgångskoefficient) U is a combination of severalheat transfer resistances* see also Chapter 5Resistances contributing to theoverall heat transfer coefficient Upictures: KJ05Heat exchanger analysis /110/74The LMTD method Heat exchanger performancedepends on how much heatexchange area A (in m2) isneeded to. transfer a certainheat rate Q (J/s W) For a small section dx of thetube (with diameterD), the.heat transfer δQ equals.δQ U· (TH-TC)· dA, withdA πD· dx for this geometry andoverall heat transfer coefficient U (TH-TC) may vary!picture: KJ05
Heat exchanger analysis /211/74The LMTD method With average temperature difference T TH -TC for the heatexchanger length, the heat rate can be expressed as.Q U ·A· T If it can be assumed that U constant, a linearisation may be used, with T1 (TH,i-TC,o) at position ”1” and T2 (TH,o-TC,i) at position ”2”:x δQ TH TC T T( x ) T " " Q With U T T dAδQHC T T δQ U T T CH QA this integrates to U A T2 T1 U A TQlmwith ”lm” short for T2 ln ”logarithmic mean” T1 Heat exchanger analysis /3The LMTD method For a single-pass counter-flow heatexchanger the design.value U·A follows from U·A Q / Tlm However, in process engineering practice most heatexchangers are NOT of this type, having several ”shellpasses” and ”tube passes”. For these designs .a correction factor F is applied, usingthe heat balance Q U · A· F· Tlm in the analysisgiven abovefor a single-pass counter-flow heat exchanger:.U· A Q / (F· Tlm ) The F correction factor is found from designgraphs: see for example next slide For an economically feasible design F 0.75Åbo Akademi University Thermal and Flow Engineering 20500 Turku Finland12/74
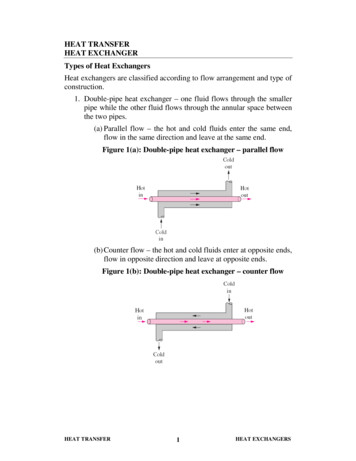
13/74pictures: T06Heat exchanger analysis /4The LMTD method:F correction factorF correction factors for several heat exchanger types:Left: Shell-and-tube with one shell pass and any multiple of two tube passes (two,four, etc. tubes passes)Right: Shell-and-tube with two shell passes and any multiple of four tube passes(four, eight, etc. tube passes).14/74Example: LMTD method A 1 shell pass, 2 tube pass heatexchanger is operated with hot fluidin/out temperatures T1 182 C,T2 99 C and cold fluid (inside thetubes) in/out temperatures t1 10 Cand t2 115 CCalculate Tlm and the F correctionfactor.T1t2t1T2
4.2 Evaporators and condensersÅbo Akademi University Thermal and Flow Engineering 20500 Turku FinlandCondensers Condensors are used to liquify vapors; the condensation heat(or ”latent heat”) is absorbed by a coolant (often water) Usually ”plate-and-shell” condensors are used (”plate-andframe” units may show vapor leakage), with four main types:1.2.3.4.Horizontal / condensation on the outside of the tubesVertical / condensation on the outside of the tubesHorizontal / condensation on the inside of the tubesVertical / condensation on the inside of the tubesMost used is 1.; for condensing a high pressure ortemperature or corrosive vapor type 4. is used.(Types 2. and 3. are more typically used in evaporators.) Also used are contact condensors where coolant and vaporare mixed and leave the condenser as a single stream.15/7416/74
17/74Evaporators Evaporators are used to concentrate a solution ofa non-volatile solute and a volatile solvent (inmost cases the solvent is water).One application is to produce a slurry of crystalsin a saturated mother liquid.Another very important application is as reboilerfor partial evaporation of distillation columnbottom liquid Most common are (low pressure) steam-heatedvertical-tube evaporators, with the boiling liquidinside the tubes under a moderate vacuum. Theboiling liquid may run upwards or downwards. To reduce equipment size, often a drum is addedfor vapor / liquid separation.pictures: TUD864.3 Heat exchanger efficiency;”effectiveness”; remarks on selectionÅbo Akademi University Thermal and Flow Engineering 20500 Turku Finland18/74
Heat exchanger efficiency vS91 A simple steady-stateheat transfer process;heat is transported frommedium 1 to medium 2by conduction through amaterial that separatesthem. Temperature T1 T2.Q1T T1.Q2T T2 Thermodynamic analysisEnergy balance Q Q Entropy balance QQ S gen T T Q .T T S gen Q T T T T This shows that Sgen islarge for large temperaturedifferences (T1-T2) and lowtemperatures T1 and T2Åbo Akademi University Thermal and Flow Engineering 20500 Turku Finland19/74 Heat exhanger efficiency (2nd Law) analysis shows that thetemperature difference between the flows (or with the flow, foronly on medium flow) should be as small as possible (but toosmall T requires much surface A!). This shows that counter-current heat exchangers performmuch better than co-current heat exchangers.Åbo Akademi University Thermal and Flow Engineering 20500 Turku Finland20/74Picture: -C/pg10.phpHeat exchanger effective performance /1
Picture: -C/pg10.phpHeat exchanger effective performance /2 Ideally, the flows aquire each others temperature: theexergy losses will then be zero. For this, the heat capacityrates ṁ·cp for the hot (H) and cold (C) streams should beequal: ṁC·cpC ṁH·cpH. This is anyhow a requirement for a high ”effectiveness” ofthe heat exchanger, which depends on the ratio (ṁC·cpC) /(ṁH·cpH).Åbo Akademi University Thermal and Flow Engineering 20500 Turku FinlandHeat exchanger effectiveness /121/7422/74 The effectiveness of a given heat exchanger can be defined as(for cold stream ”C” and hot stream ”H”) Q Qmaxwhere C T C TQCCHH C c pC and CH m H c pHwith heat capacity rates C C mcomparing the actual heat transfer with the maximumpossible for the given geometry and material flows. Defining the minimum and maximum heat capacity rates Cminand Cmax as C c pC , m H c pH }Cmin min{m C c pC , m H c pH }and Cmax max{mand since T is largest for small C ṁ·cp (see next slide)Q max Cmin (TH,in - TC,in )
Heat exchanger effectiveness /223/74 The maximum possible temperature change in any of thefluid flows would be (TH,in –TC,in):picture: T06Heat exchanger effectiveness /324/74 The ε-NTU method relates the effectiveness to thenumber of transfer units NTU of the heat transfer processand the ratio of the heat capacity rates C*, defined as:NTU U ACminandC* CminCmax A transfer unit distance L of the heat exchanger tubingswhere TC(x L) TH(x) along axis x.(Total heat exchange surface A π·D· L·NTU for round tubes.) For an existing heat exchanger the geometry, flows andspecific heats of the flows give the effectiveness. Relations that give ε f(NTU, Cmin, geometry etc.) can befound in tables, or diagrams can be used; see :
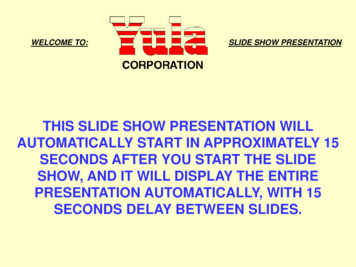
25/74Heatexchangereffectiveness /4 Top: parallel flowleft) and counterflow (right) singletube HEs Bottom: one (left)and many (right)(2,4,6,.) shellpasses and multipleof 2 tube passespictures: T06Heat exchanger effectiveness /5a26/74table: KJ05 Common equations for effectiveness and NTU
Heat exchanger effectiveness /5b27/74table: KJ05 Common equations for effectiveness and NTUHeat exchanger effectiveness /6 Comparison of effectiveness for counterflow, crossflow,multipass, and parallel flow heat exchangers (for C* 1.0). This comparisonshows that a counter- flowHE always hasthe highesteffectiveness while aparallel flow HEalways gives the lowestpicture: KJO528/74
Heat exchanger selection The heat effects of phase transitions (boiling/condensing)can be quite large and for a pure substance take place at aconstant temperature The choice for a certain design is based on 3 things:– The value U· A; for a given value for the overall heat transfercoefficient U, the heat exchange area A determines the diameter d,length L and number n of tubes needed– The pressure drop of the flows through the device (which meansan energy penalty)– The economics of material costs, footprint, heat losses, . Note that fouling has an effect not only on U but also onoperation and maintenance costsÅbo Akademi University Thermal and Flow Engineering 20500 Turku Finland29/744.4 Power production** Often by mistake referredto as ”energy production”Åbo Akademi University Thermal and Flow Engineering 20500 Turku Finland30/74
Power ( heat) production /1 Combustion of fuel (orwaste) in a furnace production of steam in aboiler production ofelectricity in a steam turbine generator Combustion of fuel in anengine production ofelectricity in a steam turbine generator OR motion of avehicle Combustion of fuel in a gasturbine production ofelectricity in generator Nuclear reaction in nuclearreactor steam production production of electricity in asteam turbine generator Combustion (oxidation) offuel in a fuel cell directconversion of chemical energyinto electricityÅbo Akademi University Thermal and Flow Engineering 20500 Turku Finland31/74Power ( heat) production /2 Using height differences in(large) rivers or betweenlakes in a hydropowerstation production ofelectricity in a turbine generator Solar radiation energy conversion into heat ( hotwater) and/or electricity usinga photovoltaic convertor Kinetic energy in wind production of electricity in awind power generator Kinetic energy in tides andstrong water currents production of electricity in awave or tide power generatorÅbo Akademi University Thermal and Flow Engineering 20500 Turku Finland32/74
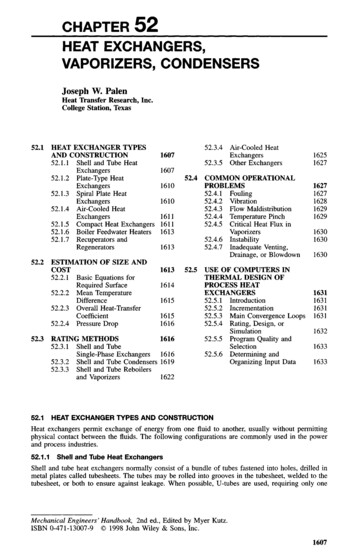
Heat exchangers in a condensingpower plantSteamFlue gassv: ångasv: rökgasFurnaceBoilerSuperheatersv: ugnsv: ångpannasv: överhettareEconomiserAir preheatersv: ekonomisersv: luftförvärmareFuelBoiler watersv: bränslesv: pannvattenAmbient airsv: uteluftPicture after ÖS96p. 30 (note correction!)Åbo Akademi University Thermal and Flow Engineering 20500 Turku Finland33/74A typical condensing power plantSimplified Rankine power cycleSchematic of a Rankine power cycleLiquid-vapor dome for water / steamto be discussed in next sectionÅbo Akademi University Thermal and Flow Engineering 20500 Turku Finlandpictures: KJ0534/74
Example: power plant cooling process A power plant is cooledusing river water.Calculate the required.mass flow rate m of thecooling water.specific heat river water c 4.19 kJ/kgKPicture: SEHB06Åbo Akademi University Thermal and Flow Engineering 20500 Turku Finland35/744.5 Steam properties; Steam processesÅbo Akademi University Thermal and Flow Engineering 20500 Turku Finland36/74
Properties of pure substances37/74/1Solid, liquid and vapour statesin a p,V,T surfacepictures: KJ05Properties of pure substances38/74/2p,V,T diagram, p,Tdiagram and p,V diagramof a substance thatexpands on freezing,such as waterWater:critical point 374.15 C, 22.12 MPaTriple point 0.01 C, 0.6112 kPapictures: KJ05
Properties of pure substances39/74/3Condensation of a gas at constant pressuresaturationtemperaturefor this pressurep constantpictures: after KJ05When cooled to low enough temperatures, gases condense into liquids.In the cooling process above, liquid droplets start to form at point Cwhere a saturated (sv: mättad) vapour exists. Further cooling alongCDE gives a two-phase mixture (droplets in gas) until at point E asaturated liquid is obtained.Properties of pure substances /440/74Condensation of a gas at constant pressuresaturationtemperaturefor this pressuresuperheatedvapoursubcooled(compressed) liquidAt higher pressures, saturation occursat higher temperatures (C’ versus C)and smaller specific volumes (i.e. higherdensity)pictures: after KJ05
Properties of pure substances /541/74Condensation of a gas at constant pressurepicture: KJ05Connecting, for different pressures, the saturation points for the gas (C,C’, C”,.) gives the saturated vapour line; similarly the saturationpoints for the liquid (E, E’, E”, .) gives the saturated liquid line.These lines come together at the critical point, on what is called theliquid-vapour dome (sv: kupol)Properties of pure substances /642/74Condensation of a gasThe liquid-vapoir dome in aT,Vorp,V diagramThe critical isobarpictures: KJ05
43/74Properties of pure substances /7Condensation of a gas : mixture qualityUnder the liquid-vapourdome, a two-phase(liquid-vapour)mixture exists;the quality, 0x, of thismixture is defined as themass fraction vapor in themixture:mx gasmgas mliquidmgmg m fx 0x 1picture:KJ05mV m V mL(with " f" from german " flüssig" )Note that x is a thermodynamic property, like p,T,v, u, h, s44/74Properties of pure substances /7Condensation of a gas : mixture qualityUnder the liquid-vapourdome, a two-phase(liquid-vapour)mixture exists;the quality x, 0 x 1,of this mixture is definedas the mass fraction vaporin the mixture:mgasx picture:KJ05x 0mgas mliquidmgmg m f x 1mVm V mL(with " f" from german " flüssig" )Note that x is a thermodynamic property, like p,T,v, u, h, s
Properties of pure substances /845/74Condensation of a gas : mixture qualityx mgasmgas mliquidmgmg m f mVm V mLhttp://www2.cemr.wvu.edu/ smirnov/mae320/figs/F3-8.jpgx (with " f" from german " flüssig" )With specific volume v V/m (m3/kg)( 1/density !) this gives for x:v VtotalVV; v L L ; v V V and Vtotal VL VVm totalmLmVv m total v L mL v V m Vv ( x ) v L x v V v vLorx mLmV vVm totalm totalv vLv vL v V vLv LVor with other notation v ( x ) v f x v gorx v vfv vf vg vfv fgProperties of pure substances46/74/9 For a system with total mass m with internal energy u U/m, enthalpy h H/m, entropy s S/m the value for themixture in the two phase region can be calculated thesame way:u (1-x)· uL x· uvoru (1-x)· uf x· ugh (1-x)· hL x· hvorh (1-x)· hf x· hgs (1-x)· sL x· svors (1-x)· sf x· sgx mgm f mg v vLu uLh hLs sL v V v L u V uL h V hL s V sLor alternativ ely : x v vfu ufh hfs sf v g v f ug u f hg h f s g s f
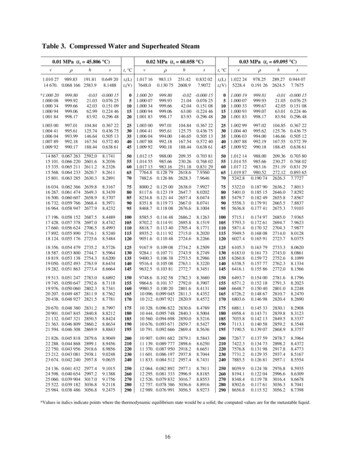
47/74Water/steam saturation pointsSaturation curves forwater/steam can beapproximated within 1 %error in pressure p (kPa)and temperature T( C) using(source: ÖS96): 11.78 (T( C) 99.64) p sat (kPa ) 100 exp (T( C) 230) 3883.16 230Tsat ( C) 16.3852 ln p (kPa )Table: ÇB98Steam tables: saturation pressure22 MPaSource: lve/basics/tables/tablesPC/pSatH2O.htmlsee also: Tableforsaturatedwater-pressure.pdfÅbo Akademi University Thermal and Flow Engineering 20500 Turku Finland48/74
Steam tables: saturation temperature374 CSource: lve/basics/tables/tablesPC/TSatH2O.htmlsee also: Tableforsaturatedwater-temperature.pdfÅbo Akademi University Thermal and Flow Engineering 20500 Turku Finland49/74Example: quality of a two-phase mixture A two-phase mixture of steamand water at 7 bar occupies avolume of 0.2 m3, with mass 20kg. Calculate the quality, andestimate temperature.Åbo Akademi University Thermal and Flow Engineering 20500 Turku Finlandpicture: KJ0550/74
Steam tables: data superheated60 MPaSource: lve/basics/tables/tablesPC/superH2O.htmlsee also: Tableforsuperheatedvaporofwater.pdfÅbo Akademi University Thermal and Flow Engineering 20500 Turku Finland51/74Example: heating water at constant pressure Two kg of saturatedliquid water at 50 kPaare heated at constantpressure, adding 5876kJ of heat. Calculatethe final temperature.kÅbo Akademi University Thermal and Flow Engineering 20500 Turku Finlandpictures: KJ0552/74
Example: Isothermal compression of steam Thirty-one (31) kg of (superheated)steam in a piston-cylinder assembly arecompressed slowly (i.e. reversibly) andisothermally at 500 C from 100 kPa to300 kPa. Making use of entropy data,calculate the heat transfer Q.Åbo Akademi University Thermal and Flow Engineering 20500 Turku Finlandpicture: KJ0553/744.6 Water/steam p,T; p,h diagrams;T,s and h,s diagramsÅbo Akademi University Thermal and Flow Engineering 20500 Turku Finland54/74
Water/steam p,T diagram /155/74p,T: notcommondiagramDensity of water and steamsource: ÖS96, Fig. 3.5Water/steam p,T diagram /2p,T: notcommondiagramSpecific enthalpy and entropy of water and steamenthalphy h 0 kJ/kg for liquid water at 0 C source: ÖS96, Fig. 3.656/74
Water/steam h,p diagramp, h:commondiagramcriticalpointSource: http://www.ent.ohiou.edu/ thermo/property tables/H2O/ph water.htmlÅbo Akademi University Thermal and Flow Engineering 20500 Turku Finland57/74Water/steam h,s diagramh, s(like T,s):commondiagramcriticalpointSource: http://www.ent.ohiou.edu/ thermo/property tables/H2O/hs water.htmlÅbo Akademi University Thermal and Flow Engineering 20500 Turku Finland58/74
Example: h,p diagramsIf 1 kg/s steam at330 C, 50 bar isled through athrottling valve(sv: strypventil) inwhich pressure isreduced to 5 bar,what will be thefinal temperature ?(ÖS96-3.5a)Åbo Akademi University Thermal and Flow Engineering 20500 Turku Finland59/74Example: p,T diagramsIf 1 kg/s steam at330 C, 50 bar isled through athrottling valve (sv:strypventil) in whichpressure isreduced to 5 bar,what will be thefinal temperature ?(ÖS96-3.5a)Åbo Akademi University Thermal and Flow Engineering 20500 Turku Finland60/74
Example: h,p diagrams How muchturbine power canbe obtained if 50kg/s steam at530 C and 90 barexpands against7.2 bar. Comparethis with the heatrelease from thissteam if it wouldcondense at 7.2bar.(ÖS96-3.10)Åbo Akademi University Thermal and Flow Engineering 20500 Turku Finland61/74Example: p,T diagrams How much turbinepower can beobtained if 50 kg/ssteam at 530 C and90 bar expandsagainst 7.2 bar.Compare this withthe heat releasefrom this steam if itwould condense at7.2 bar.(ÖS96-3.10)Åbo Akademi University Thermal and Flow Engineering 20500 Turku Finland62/74
Example: h,s diagrams How much turbinepower can beobtained if 50 kg/ssteam at 530 Cand 90 barexpands against 7.2bar. Compare thiswith the heatrelease from thissteam if it wouldcondense at 7.2bar.(ÖS96-3.10)Åbo Akademi University Thermal and Flow Engineering 20500 Turku Finland63/7464/74T,s diagramand h,s(Mollier)diagramsfor water/steamPictures: SEHB06
4.7 Combustion; FuelsSee also coursesFPK1, FPK2 @ OOKÅbo Akademi University Thermal and Flow Engineering 20500 Turku Finland65/74Combustion processes “Combustion or burning is acomplex sequence of chemicalreactions between a fuel and anoxidant accompanied by theproduction of heat or both heatand light in the form of either aglow or flames.” “Since not every oxidationprocess results in theproduction of heat (for example,corrosion), the termcombustion can only be appliedto exothermic processes thatoccur at a rate fast enough toproduce heat.” (Source: Two types of combustioncases can be distinguished:– Constant pressurecombustion, in furnaces andboilers– Constant volumecombustion, in internalcombustion engineswikipedia)Picture: T06Åbo Akademi University Thermal and Flow Engineering 20500 Turku Finland66/74
67/74Enthalpy of combustionMethane oxidation in air: CH4 2(O2 3.76 N2) CO2 2H2O 2·3.76 N2Note: the water product can be as steam (gas)or as liquid water; the enthalpy difference is 44J/mol hvaporisation, H2O. This has an effect on thecalculated heat of combustion, or heating value !!!Therefore lower heating value (LHV) is definedfor H2O(gas) product, or higher heating value(HHV) for H2O(liquid) product. For example, formethane, LHV 802 kg/mol, HHV 890 kg/mol.Fuels /1 Important properties offuels are:– calorific heating value– air demand (kg air / kg fuel)– moisture and ash-forming mattercontent– combustible volatiles and charcontent and the ratio of these(”fuel ratio”)– availability and costs, andstability of these– pollution-producing speciescontent– CO2 / kWh power or CO2 / kmfor vehiclesEnthalpy of reactionPictures: T0668/74
69/74Fuels /2 some typical solid fuel dataC*H*N*O*S*Cl*Char**Ash**LHV***35511127.4HHV Stoichiometric***air need****29.310.0Polish coal714.31.2111.30.073Illinois coal614.11.2133.60.04637411623.525.39.4Petroleum coke893.11.71.24.0021088 133.735.011.1Finnish peat545.91.1340.15097017421.123.78.2Wood birch486.00.13460.0305887 116.919.55.3Wood pine496.00.17440.060585100.517.920.45.6Solid recovered fuel(from waste)Sewage 191.20.06681071510.011.86.5Meat & bone meal425.87.5160.380.276162616.218.87.4Packaging waste496.50.94290.32 .8Mois- Volaturetiles*****%-wt dry; ** %-wt ”as received”; *** MJ/kg; **** kg dry air / kg dry fuel70/74Adiabatic flame temperature /1 Important information on fuel quality is found from the so-calledadiabatic flame temperature, which for a constant pressureprocess is the maximum temperature that can be reached No heat losses from the system all reaction enthalpy is used toraise the temperature of the product mixture Based on the enthalpy of reactantsHreactants at the initial temperature Tinit,the adiabatic reaction temperature Tadfor the products is defined asHproducts(Tad) Hreactants(Tinit)TTΣi (Hi c p,idT)products Σi (Hi c p,idT)reactants T T @ T Tr, adiabaticPicture T06
Adiabatic flame temperature /2 The adiabatic temperatureoccurs at stochiometricconditions; excess air willlower the temperature At high temperaturesdissociation becomesimportant, and relations forproduct equilibriumcomposition must be included;for example In constant volumecombustion the adiabaticreaction temperature Tad forthe products is defined byinternal energy UUproducts(Tad) Ureactants(Tinit)N2 2N, H2O H2 ½O2(ignoring these gives errors ofhundreds of degrees)Åbo Akademi University Thermal and Flow Engineering 20500 Turku Finland71/74SourcesA94: P.W. Atkins “The 2nd Law”, Scientific American Books (1994)BR98: G.L. Borman, K.W. Ragland ”Combustion Engineering” McGraw-Hill (1998)CB98: Y.A. Çengel, M.A. Boles “Thermodynamics. An Engineering Approach”, McGraw-Hill (1998)KJ05: D. Kaminski, M. Jensen ”Introduction to Thermal and Fluids Engineering”, Wiley(2005)L96: Lervik, P. “Värmetekniska tabeller”, 3rd ed, Åbo Akademi University eller.pdfSEHB06: P.S. Schmidt, O. Ezekoye, J. R. Howell D. Baker “Thermodynamics: An Integrated LearningSystem” (Text plus Web) Wiley (2006)T06: S.R. Turns ”Thermal – Fluid Sciences”, Cambridge Univ. Press (2006)TUD86: ”Apparaten voor de procesindustrie / Apparaten voor warmteoverdracht”, (ST42/i20) DelftUniversity of Technology (1986) (in Dutch)ÖS96: G. Öhman, H. Saxén ”Värmeteknikens grunder”, Åbo Akademi University (1996) (in Swedish)Steam tables: pressure tablefor example: Tableforsaturatedwater-pressure.pdfSteam tables: temperature tablefor example: Tableforsaturatedwater-temperature.pdfSteam tables: superheated vapour tablefor example: Tableforsuperheatedvaporofwater.pdfÅbo Akademi University Thermal and Flow Engineering 20500 Turku Finland72/74
Appendix: case slide 51 h,p diagram s -0.5kJ/kgKm·T· s 31·773·-0.5 12 MJÅbo Akademi University Thermal and Flow Engineering 20500 Turku Finland73/74Appendix: case slide 51 h,s diagram s -0.5kJ/kgKm·T· s 31·773·-0.5 12 MJÅbo Akademi University Thermal and Flow Engineering 20500 Turku Finland74/74
Heat exchanger analysis /3 The LMTD method For a single-pass counter-flow heat exchanger the design value U·A follows from U·A Q / Tlm However, in process engineering practice most heat exchangers are NOT of this type, having several ”shell passes” and ”tube passes”.