Transcription
BP 2010 results and investor updateLondon1 February 2011
Bob DudleyGroup Chief Executive2
Cautionary statementForward looking statements - cautionary statementThis presentation and the associated slides and discussion contain forward looking statements, particularly those regarding energy demand and sources of supply;possible short term impact on costs and volumes from various actions to grow value; production growth and future production; refining margins; thepetrochemicals environment; refinery turnaround activity and costs; cash costs and capital expenditure; disposals, including strategy and proceeds from disposals;completion of acquisitions; effective tax rate; maintenance of a cash liquidity buffer; reduction in the gearing ratio; payment of dividends; investments in safety andoperational risk; increase in turnaround activity and impact on production; embedding of the operating management system; focus on competency capability andsafety culture; actions of the Safety and Operational Risk organisation; the expected timing of the transition of control of the Gulf of Mexico response operationsfrom the GC-IMT to the BP Gulf Coast Restoration Organization; internal organisational changes and advancing learning from the Gulf of Mexico (GoM) incident;the magnitude and timing of costs relating to the GoM oil spill; the magnitude of BP's ultimate exposure relating to the oil spill and potential mitigation by otherparties; payments to the oil spill trust fund and return of any excess cash from the fund; availability of cash when payments to the fund cease; timing ofinvestigations and litigation proceedings relating to the oil spill; restarting GoM activity; GoM production; start-up of projects and their contribution to production;depreciation, depletion and amortization; underlying average quarterly charge from other businesses and corporate; future exploration activity and spend; futureupstream developments and ramp up of activities in Iraq; growth in TNK-BP, including investment and production; upstream strategy (including focus on safetyimprovements and operational risk reduction; relationships with large resource holders and National Oil Companies; exploration investment; shifting emphasisfrom volume to long-term value growth; investments in technology and capability); improvements in refining efficiency; move to new refining marker margin;refinery divestments; repositioning of US Fuels Value Chains (FVC) (including divesting Southern West Coast FVC and retaining Northern West Coast FVC) andhalving US refining capacity; improvements in Eastern Hemisphere FVCs, including growth in margin capture and access; investment in Toledo and Whitingrefineries; timing of Whiting refinery modernization project; growth in lubricants and petrochemicals; refining and marketing performance outlook, includingperformance improvement and growth in earnings and returns; investments in Alternative Energy; potential for biofuels as source of transport fuels; expansion ofbiofuels operations in Brazil; expected sanction of lignocellulosic ethanol production facility and advancing technology for biobutanol production. By their nature,forward-looking statements involve risk and uncertainty because they relate to events and depend on circumstances that will or may occur in the future. Actualresults may differ from those expressed in such statements, depending on a variety of factors including the timing of bringing new fields onstream; future levelsof industry product supply; demand and pricing; OPEC quota restrictions; PSA effects; operational problems; general economic conditions; political stability andeconomic growth in relevant areas of the world; changes in laws and governmental regulations; regulatory or legal actions including the types of enforcementaction pursued and the nature of remedies sought; the impact on our reputation following the Gulf of Mexico oil spill; exchange rate fluctuations; development anduse of new technology; the success or otherwise of partnering; the actions of competitors, trading partners, creditors, rating agencies and others; natural disastersand adverse weather conditions; changes in public expectations and other changes to business conditions; wars and acts of terrorism or sabotage; and otherfactors discussed in this presentation, under “Risk factors” in our Annual Report and Accounts 2009 and our 2009 Annual Report on Form 20-F, filed with the USSecurities and Exchange Commission (SEC) and under “Principal risks and uncertainties” in BP's Current Report on Form 6-K filed with the SEC on 28 July 2010.Reconciliations to GAAP - This presentation also contains financial information which is not presented in accordance with generally accepted accountingprinciples (GAAP). A quantitative reconciliation of this information to the most directly comparable financial measure calculated and presented in accordance withGAAP can be found on our website at www.bp.comCautionary note to US investors - We use certain terms in this presentation, such as “resources” and “non-proved resources”, that the SEC’s rules prohibit usfrom including in our filings with the SEC. U.S. investors are urged to consider closely the disclosures in our Form 20-F, SEC File No. 1-06262. This form isavailable on our website at www.bp.com. You can also obtain this form from the SEC by calling 1-800-SEC-0330 or by logging on to their website at www.sec.gov.Tables and projections in this presentation are BP projections unless otherwise stated.February 20113
AgendaIntroductionBob Dudley2010 resultsByron GroteSafety & Operational RiskBob DudleyGulf of Mexico oil spillExploration & ProductionRefining & MarketingIain ConnAlternative EnergyBob DudleyConclusionQ&A4
2010: Gulf of Mexico oil spill and responseDeepwater Horizon incident 11 lives lostResponse Unprecedented containment, well-cappingand clean-up Dividend suspended 20bn Trust Fund established 30bn divestment programme initiated New Safety and Operational Riskorganization Reorganization of BP’s upstream business Introduced new performance management Sharing and implementing learnings5
2010: underlying performanceStrong underlying financial performance(1) Underlying earnings of 20.5bn and operating cash flow of 29.6bnBusiness performance delivery 106% reserves and 470% resource replacement(2) Access and exploration success Brazil, Azerbaijan, Egypt, North Sea, Indonesia, China 15 projects progressed through Final Investment Decision Improved Production Target achieved in Iraq 0.9bn of underlying performance improvement in R&M(3)Successful divestment program Realized values exceeded expectations Portfolio refocused(1)(2)(3)Adjusted for the costs associated with the Gulf of Mexico oil spill, other Non-Operating Items and Fair Value Accounting EffectsReserves and resource replacement, as reported on a combined basis of subsidiaries and equity accounted entities, excludingacquisitions and divestmentsAdjusted for non-operating items, fair value timing effects and the environment effect of refining margins, petrochemical margins,forex and energy costs6
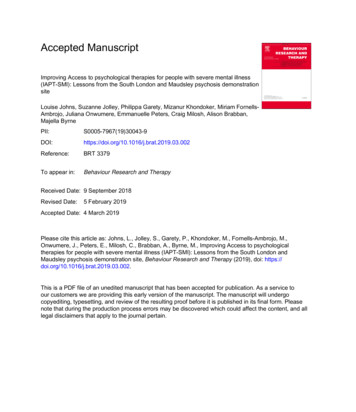
Energy demand to 20301815Billion toe12963018701910Renewables** Includes biofuelsSource: BP Energy Outlook 20301950NuclearHydro1990Gas2030OilCoal7
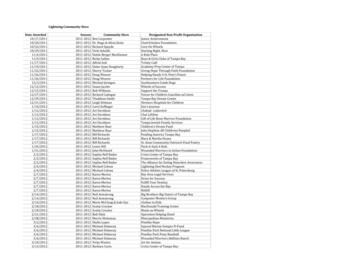
The challenge of meeting growing demandBillion wables*(1) Today’s borders* Includes biofuelsSource: BP Energy Outlook 20302030Hydro20102030NuclearCoalGas20102030Oil8
Moving BP forwardOur strategic agendaPutting Safety & Operational Risk management at the heart of the company A long term integrated approach How we manage risk How we operate How we partner with governments and contractors How we reward our peopleRe-building trust Meeting our commitments to the US Sharing and implementing lessons globallyValue growth Dividend resumed Active portfolio management: divesting/acquiring for value Investing for upstream value Growth project portfolio focussed base potential for stronger growth Increasing investment in exploration New forms of partnerships with resource holders Reshaping downstream More focussed portfolio: improved returns and growth9
The BP team2011 BP investor roadshow teamBob DudleyGroup Chief ExecutiveIain ConnChief ExecutiveRefining & MarketingByron GroteChief Financial OfficerAndy HopwoodExecutive Vice President,Strategy & IntegrationMark BlyExecutive Vice President,Safety & Operational RiskBrian GilvaryDeputy Group CFO &Head of FinanceRupert BondyGroup General CounselMike DalyExecutive Vice President,ExplorationLamar McKayPresident & ChairmanBP America & GCROSteve WestwellExecutive Vice President,Group Strategy &IntegrationPeter HenshawGroup Head ofCommunicationsBernard LooneyExecutive Vice President,DevelopmentsFergus MacLeodHead of InvestorRelationsDavid PeattieSenior Vice President,RussiaBob FryarExecutive Vice President,Production10
Byron GroteChief Financial Officer11
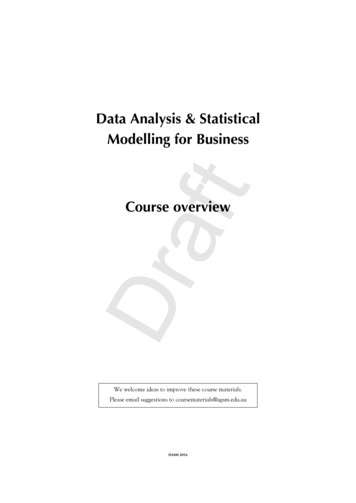
Trading environmentLiquids realizationGas realization901612 /bbl /mcf60308401Q /bbl82Q 3Q20094Q1Q2Q 3Q20104Q01Q2Q 3Q20094Q1Q2Q 3Q2010Refining indicator margin4QChange vs 2009Average realizations4QYear30%22%6Liquids /bbl4Natural gas /mcf16%8%Total hydrocarbons /boe10%25%211%11%20Refining indicator margin /bbl1Q2Q 3Q20094Q1Q2Q 3Q20104Q12
Financial resultsAll earnings figures are adjusted for the costs associated with the Gulf of Mexico oil spill,other non-operating items and fair value accounting effects.4Q094Q10Exploration & Production7.16.7Refining & Marketing0.00.7Other businesses & corporate(0.3)(0.5)Consolidation adjustment(0.5)0.1Replacement cost profit beforeinterest and tax6.37.0Interest & minority interest(0.4)(0.4)Tax(1.5)(2.2)Replacement cost profit4.44.4Earnings per share ( c)23.423.2Cash from operations ( bn)*7.35.2Dividend paid ( bn)2.6-Organic capital expenditure ( bn)5.95.2Dividend per share ( c)14.07.0 bn8Replacement cost profit before interest and tax4Q10 vs 4Q09 ( bn)765432104Q09* 4Q10 excludes post-tax cash outflows of (5.4)bn related to Gulf of Mexico oil spillE&PR&MOB&C Co.adj. 4Q1013
Gulf of Mexico oil spill costs and provisions(pre-tax, pre partner recovery) )(2.0)(5.0)(12.7) Income statement– Charge for the period Balance sheet *– Brought forward– Charge/ (credit) to income statement32.2– Payments into Trust Fund– Other related payments in the period(2.1)(7.1)(3.4)– Carried forward30.127.723.32.110.15.4 Cash payments17.7* Balance sheet amount includes all provisions, other payables and the reimbursement asset balances related to the Gulf of Mexico oil spill14
Exploration & ProductionReplacement cost profit before interest and tax Stronger environmentAdjusted for non-operating items and fair value accounting effects50840 rage hydrocarbon realizations ( /boe)TotalAverage hydrocarbon realizations ( /boe)6010 Lower depreciation Loss in gas marketing and trading Reported production 9% lower –adjusting for PSA entitlementeffects and A&D, production 6%lower Higher turnaround activity than4Q09 Continued impact of the Gulf ofMexico drilling moratorium Absence of 40mboed benefit in4Q09 from make-up of priorperiod underlift15
Refining & MarketingReplacement cost profit before interest and taxAdjusted for non-operating items and fair value accounting effects12.010.01.58.0 bn1.06.04.00.52.000(0.5)(1.0)Refining indicator margin ( /bbl)2.0 Stronger refining margins Strong operational performance infuels value chains Continued momentum ininternational businesses Further cost efficiencies Loss in supply and trading4Q09US1Q102Q103Q10Non-US4Q10TotalRefining indicator margin ( /bbl)16
Other businesses & corporateReplacement cost profit before interest and taxAdjusted for non-operating items and fair value accounting effects0.20 bn(0.2) Adverse foreign exchange effects(0.4)(0.6)(0.8)4Q091Q102Q103Q104Q1017
Sources & uses of cash452009201040Disposals35 bn30 Disposals25Other Gulfof Mexicooil spillpaymentsCapex2015Trust FundOperationsOperations0 Cash at 31 December is 18.6 billionDividendsSourcesUses Additional 6.2 billion of cashdeposits held at year end fordisposals expected to complete insubsequent periods, which isreported as short-term debt.Capex105 Disposal proceeds of 6.2 billionfor deals closed in 4QSourcesDividendsUses18
Net debt ratio403020 to 30%% 2010 to Net debt ratio net debt / (net debt equity)Net debt includes the fair value of associated derivative financial instruments used to hedge finance debtCash of 6.2bn received as deposits for disposals completing after year-end is reported as short-term debt at 31 December 201019
2011 guidance20102011 guidanceOrganic capital expenditure 18bn 20bnCash from disposals* 17bn 13bnPayments into Trust Fund 5bn 5bnDD&A 11bn 500m higherSlightly lowerSlightly higher 350m 400m31%32% - 34%Cash costs** (year-on-year change)OB&C: average underlying quarterly chargeFull year effective tax rate*********Cash from disposals including deposits of 6.2bn received at year end 2010 relating to disposal transactions expected to complete insubsequent periodsExcluding the effects of changes in exchange rates and fuel costs. A full definition of cash costs can be found on bp.comExcluding the impact of the Gulf of Mexico oil spill20
Financial framework Increased investment to grow the firm Resumption of the quarterly dividend supported by: Continued success in the disposal program Improving business environmentbalanced by: The need to retain significant level of financial flexibility Financial flexibility provided by: Maintenance of a significant cash liquidity buffer Reduction in gearing to range of 10% - 20% Quarterly dividend level (7 cents/share) reflects: Continuing obligation to the Trust Fund Uncertainties the company still faces Intention to grow over time in line with improving circumstances of firm21
Bob DudleyGroup Chief Executive22
Safety track record2.0Recordable Injury Frequency oup excluding response contributionGulf of Mexico oil spill contribution1614121086420Process Safety Related Major Incidents20062007200820092010API US benchmarkInt. Assoc. of Oil and Gas Producers benchmark200Loss of Primary Containment incidents1501005020072008Gulf of Mexico oil spill2009201001Q 2Q 3Q 4Q 1Q 2Q 3Q 4Q 1Q 2Q 3Q 4Q201020082009Note: LOPC definition aligned with API recommended practice23
Putting Safety and Operational Riskmanagement at the heart of BPResetting the focus on safe, reliable operating activity to achieve longterm value creationLeadership priorities Process safety and operating risk reduction Embedding BP’s Operating Management System (OMS) Consistent and systematic operating rigour Competency, capability and safety cultureRebasing performance management and reward Focus on priorities, foundation for long term performanceNew Safety and Operational Risk organization (S&OR) Head of S&OR is member of Executive Team Strengthen central standards setting and auditing Deployed into the operating line24
Implementing lessons globallyBuilding on our learnings and sharing them around the worldInternal changes to strengthen BP Centralized global wells organization Broadening areas of expertise Enhancing our standards and practicesAdvancing technology, standards and equipment in 5 key areas Prevention/drilling safety – the highest priority Containment – stopping the flow Relief wells – plan for rapid well kill Spill response – control near the source Crisis management – preparation and co-ordinationEngaging with industry to develop new global capability25
Living up to our commitments andearning back trustGulf Coast Restoration OrganizationEconomic & environmental impact 5bn of claims & government payments to date Natural Resource Damages Assessment Understanding the incident’s effects Restoring the environment & use of natural resourcesVoluntary fundingFunding includes: 500m Gulf of Mexico Research Initiative (GRI) Rig Worker Assistance Fund Behavioural health Tourism and seafood testing & marketing projects26
Gulf of Mexico oil spillExpected milestonesIndicated dates*Investigations Presidential Commission final reportMarch 2011 Marine Board investigation final reportSpring 2011 Chemical Safety Board report National Academy of Engineers final reportto be determinedend 2011Department of Justice inquiry continuesMulti District Litigation trials OPA 90** test trials Limitation & Liability trial* Dates as expected only** OPA 90 Oil Pollution Act of 1990to be determinedFebruary 201227
Gulf of Mexico oil spillFinancial impacts 20bn Trust Fund Claims by individuals and businesses Government claims Natural Resource Damages claims 41bn charge taken against income Partner recovery not included Final 1.25bn cash payment to Trust Fund in Q4 201328
Upstream:Exploration, Developments and Production29
Upstream agenda Focus on value growth– Risk reduction– New forms of relationships– Increased investment in exploration– Active portfolio management: divestments / acquisitions– Build technology and capability 2010 delivery 2011 guidance30
Divestment updateDivestment program success Total headline proceeds of more than 21bn Reserves and non-proved resources of 1.7bn boe and 3.2bn boe, with 0.4bn boe and1.8bn boe closed in 2010 Financial impact of 1.5bn pre-tax underlying replacement cost profitKey transactions21US Permian, Egypt Western Desert, Canada Gas to Apache1960% stake in Pan American Energy JVColombia to Ecopetrol and TalismanVietnam to TNK-BPVenezuela to TNK-BP46% interest in Lukarco JV to Lukoil9Devon Gulf of Mexico producing assets to MarubeniPakistan to United Energy Group Limited50% of Kirby Heavy Oil JV to DevonFinancial impact BP projections at 75/bblProceeds include 1.4bn of deferred payments in 2010 and 2011 for deals closed in 2009NetBookValueWoodHeadlineMackenzie ProceedsValue31
Net asset value distribution:Focused portfolio with potential for growthNorth Azerbaijan AENorthAfricaMiddleEastCanadaGasBrazilUSColombia Canada(Permian)OilSandsVietnam Venezuela PakistanDivested portfolioSource: Wood Mackenzie; Assumptions: Value as of 1/1/11; 10% nominal discount rate; 80/barrel / 6/mcfDisposed assets valued at headline proceeds; Brazil value shown as purchase priceTNK-BP and Gulf of Mexico not shown32
Resources to reserves to productionExploration and AccessProspectinventoryEnd 2009ExplorationdiscoveriesDiscovered Field extensions and improvedresource accessrecoveryEnd 2010Impact of2010 disposals45.3 bn boeNon-proved resources50.2 bn boe(1.8) bn boe18.3 bn boeProved reserves18.1 bn boe(0.4) bn boe1.5 bn boeTotal resources:production 43 yearsProductionResources and reserves on a combined basis of subsidiaries and equity-accounted entitiesEnd 2010 includes impact of acquisitions and divestments completed in 20101.4 bn boeTotal resources:production 48 years33
Resource and reserve distribution2010 resource base2010 reserves additions %Proved: 18.1 bn boeConventional oilDeepwater oil13 yearsNorth America OnshoreNorth Africa, Middle East,CaspianWater-flood viscousand heavy oilGulf of MexicoConventional gasLNG gasTNK-BP35 yearsNorth SeaSouth AmericaUnconventional gasTrinidadNon-proved: 50.2 bn boeReserves and resources at end-2010 on a combined basis of subsidiaries and equity-accounted entities34
Recent accessNorth SeaValhall deepeningUKCS 26th licensing roundRussian ArcticSouth Kara SeaStrategic alliance with RosneftCanadaTerre de Grace 750km2AzerbaijanPSA for 1100km2 Shafag-Asiman blockChinaSouth China SeaFarmed in to 2 blocksUS shale gasEagle Ford38,000 acresUS Gulf of MexicoOCS lease sale 21318 leases awarded218 leases acquiredfrom DevonBrazil10 blocks, 1 producing field,3 discoveries, 6 exploration areasJordanRisha concessionGovt endorsed entry into 7,000km2 blockAngolaKwanza/Benguela basins4 blocksAngola, Brazil and one block in South China Sea subject to government approvalIndonesiaPapua provinceAwarded 5,000km2 blockAustraliaCeduna basin4 blocks 25,000km235
Project Final Investment Decisions Final Investment Decisions madeon 15 projects 20bn of total BP net investment– 8 projects over 1bn BP net– Gulf of Mexico, Egypt andNorth Sea 4-5bn BP net each 2bn boe of BP net resourcesunder developmentFFD - Full field developmentTubular BellsMars BAtlantis Phase 2GalapagosNa Kika Phase 3Horn Mountain Phase 2West Nile Delta GasWoS Q204Clair RidgeDevenickKinnoullChirag OilSunriseIn Salah Southern FieldsVerkhnechonskoye FFD Ph1Uvat East ExpansionSuzunCLOVGulf of MexicoGulf of MexicoGulf of MexicoGulf of MexicoGulf of MexicoGulf of MexicoEgyptNorth SeaNorth SeaNorth SeaNorth SeaAzerbaijanCanadaNorth AfricaTNK-BPTNK-BPTNK-BPAngola99999under review99999992011 FID992012 FID9 new addition36
2011 increased turnaround activityNumber of turnarounds51 50% increase in turnaround activity Major investment programs to managesafety and operational risk343520092010 Short-term production impact withlong-term reliability benefit2011 BP projection201137
Deepwater: Gulf of Mexico Resource base remains unchangedProduction, mmboed Industry-wide production reduced in 20103.0 2011 focus on safely bringing back rigactivity2.5 Our restart criteria will cover: Regulatory requirements Activity and pace Capability Contractor management 2011-2012 production impact dependenton restart timing201120122.01.51.02013Range of uncertainty0.5Thunder Horse (1)Thunder Horse (2)Atlantis (1)Atlantis (2)Exploration / Appraisal0.020062007BP2008200920102011Gulf of Mexico regionResumption of rig activities including plugging andabandonment is subject to regulatory approvalSource: BP projection, BOEMRE, Wood Mackenzie38
Production 2006 2011 2011 year of consolidation4.5 Increased turnaround activity andplanned losses4.0 Key drivers of uncertainty:3.5– Gulf of Mexico restartProduction, mmboed3.0– Divestment timing– Oil price and PSA effects– OPEC quota restrictions2.52.01.51.0200620072008Reported2011 BP projection at 75/bbl200920102011Divestments39
Capital investment 2006-2011Increasing investment in line withpriorities: Safety and operational risk activity,including an increased number ofturnaroundsOrganic capital expenditure, bn2015 Increased exploration spend Resumption of activity in Gulf ofMexicoExplorationProduction10 Major Projects progression,particularly in Angola, North Sea andEgyptDevelopments:Global ProjectsOrganisation5Developments:Global WellsOrganisation Iraq ramp up of activity02006 2007 2008 2009 2010 2011Organic capital expenditure above excludes the following acquisition impacts:Pan American Energy2006 –Rosneft; 2007 – asset exchanges with Occidental;TNK-BP2008 –Accounting for our transactions with Husky and Chesapeake;2009 –BG asset swap and Eagle Ford;BP2010 –Completed acquisitions from Devon, accounting for our transaction with Value Creation Inc.,2011 –and for the purchase of additional interests in the Valhall and Hod fieldsBP projections40
Long term value growthPortfoliochoiceDeepwaterGasGiant fieldsRelationshipsBasin onEnduring presencein key basinsCapturing valueacross life cycle41
Value growth in the life cycle of a basin:Azerbaijan exampleValue creationShafag-AsimanShah Deniz FFDShah Deniz / SCPAzeri / BTCResourcesProvenChiragExplore19901995FFD - Full Field DevelopmentSCP – South Caucasus PipelineBTC – Baku-Tbilisi-CeyhanResources are indicativeSource: BP 42
Post-mergerdrill-outPortfolio rebuildThe futureNet accessed volumeNet discovered volumeIncreasing investment in exploration2001 2002 2003 2004 2005 2006 2007 2008 2009 2010 2011 2012 2013 2014 2015Direct resource accessSource: BP internalExploration access43
Future exploration focusRussian ArcticCanadian ArcticAzerbaijanGulf ofMexicoLibyaEgyptAngolaJordanSouthChina SeaIndonesiaBrazilAustraliaNew / untested positionsExisting positions44
Developments: project portfolioPo st FIDLocat ionProjectAlaskaLiberty*AngolaAngola LNGBlock 31 PSVM*Clochas-MavacolaCLOVPazflorAsia PacificNorth Rankin 2AzerbaijanChirag Oil*CanadaSunriseEgyptWest Nile Delta Gas*Gulf of MexicoAtlantis Phase 2*Pre FID 1bnBP NetTy pe WI %Inv est m entz 100999999999Galapagos*Mars B9Na Kika Phase 3*Tubular BellsNorth AfricaIn Amenas CompressionNorth SeaClair Ridge*9Devenick*Kinnoull*Skarv*WoS Quad 204*Russia (TNK-BP)99Uvat East ExpansionVerkhnechonskoye FFDTrinidad & Tobago Serrette*9zzzzzzzzzzzzzzzzzzzzzzzGrossCapacit yLocat ionProject40 mboedAngolaBlock 18 West*145 mtpa27150 mboed27100 mboed17160 mboed 1bnBP NetTy pe WI %Inv est m ent50z9Kiz Satellites Phase 2Block 31 SE*Asia PacificBrowseSanga-Sanga CBM17220 mboed171,800 mmscfdTangguh Expansion*37140 mboed5060 mboed60/80900 mmscfd5650 mboed47-6760 mboed29130 mboed5040 mboedAtlantis Phase 3*3050 mboedKaskida*46330 mmscfdMad Dog North*29120 mboedNa Kika Phase 4*89200 mmscfdTiber*7750 mboedMiddle East24165 mboedNorth AfricaIn Salah Southern Fields36130 mboedNorth SeaCulzean50145 mboed34145 mboed100480 mmscfdAzerbaijanShah Deniz FFD*BrazilItaipu*WahooCanadaPikeTerre de Grace*Gulf of MexicoFreedomMad Dog Phase 2*Oman FFD*Greater Clair*Russia (TNK-BP)RusskoyeSuzunUvat Central Expansionzzzzzz*Conventional oilTrinidad & Tobago zzzGrossCapacit y50-75 mboed2750-100 mboed27under study17/2012 mtpa38under study37under study261,500 mmscfd40under study25under study50under study75under study22-68100 mboed61125 mboed56under study100under study61under study50under study62under study801,000 mmscfd33420 mmscfd16under study29under study5050 mboed50120 mboed50110 mboed100500 mmscfdDeepwater oilWater-flood viscous and heavy oilConventional gasLNG gasUnconventional gasBP OperatedFFD - Full Field Development45
Developments: deepwater projectsAngolaGulf of MexicoBrazil Block 31 PSVM Atlantis Phase 2 Itaipu Clochas-Mavacola Galapagos Wahoo CLOV Mars B Pazflor Na Kika Phase 3 Block 18 West Tubular Bells Kizomba Satellites Phase 2 Freedom Block 31 SE Mad Dog Phase 2 Atlantis Phase 3 Kaskida Mad Dog North Na Kika Phase 4 Tiber46
Developments: gas projectsAzerbaijanShah Deniz Full Field DevelopmentOmanKhazzan-Makarem Full Field DevelopmentEgyptWest Nile DeltaAsia PacificTangguh expansion47
Developments: new start-upsAlaskaLiberty *North SeaSkarv *Devenick *Kinnoull *WoS Q204 *Clair Ridge *CanadaSunriseGulf of MexicoGalapagos *Na Kika Phase 3 *Tubular BellsMars BMad Dog Phase 2 *FreedomRussia (TNK-BP)Verkhnechonskoye FFDSuzunUvat Central ExpansionRusskoyeAzerbaijanChirag Oil *EgyptWND Gas *AlgeriaMiddle EastIn Salah Southern FieldsIn Amenas CompressionOman FFD *Trinidad & TobagoSerrette *Juniper * 1000mboedAngolaB31 PSVM *PazflorAngola LNGClochas-MavacolaKizomba Satellites Phase 2B18 West *CLOVAsia PacificNorth Rankin 22011 start-ups2012 start-ups20162013-2016 start-ups* BP operated2016 production from 2011-2016 new project start-ups at 75/bblFFD - Full Field Development 48
Production: Iraq20102011-2012 Set up the business Achieved ImprovedProduction Target (IPT)2013 Cost recovery starts Rehabilitation; inspection,maintenance, commence FEED Water, gas, power, exportsolutionsCompany positions in Iraq 1Q 2010 Brownfield project underway Deliver plateau target end2015Activity ramp up after Rumaila Operating Organizationestablished on 1 July 2010# of jobsBADRASurveillance and FacilitiesHALFAYAHWellworkIRANDrillingGHARAFWEST QURNA 2WEST QURNA 1MAJNOONIRAQBasraRUMAILAZUBAIR1 st Round2 nd RoundKUWAITJFMAMJJ2010ASOND 1Q 2Q 3Q 4Q2011BP projections49
BP has a unique growth-oriented positionin Russia9.02010 production, mmboed8.53.02.52.01.51.00.5Source: Wood Mackenzie / BP azprom0.0BPBP50
TNK-BPYamal Core production areasProject areas51
BP is forming a global strategic alliancewith RosneftA unique alliance unlocking future growth potential for both BP and Rosneft International upstream collaboration Significant share swapArctic exploration agreementfocused on South Kara SeaWider ArcticprotocolA leading Europeanrefining partnership via50:50 ROG JVExploration offshoreSakhalin52
Leveraging technology to reduce risk andunderpin long term reliability and valueInherently Reliable FacilitiesManaging and reducingintegrity riskUnconventional OilTechnologies for UOresource progressionFieldoftheFuture Digital tools for managingoperational integrity threatsUnconventional GasGlobalize unconventionalgas development throughtechnologySubsea Well InterventionAdvanced SeismicHigh quality and efficientreservoir imagingReal time life-of-well integritymonitoringDeepwater FacilitiesPushing Reservoir LimitsGrowing recoveryfactors across portfolioNew and reliable equipment fordeepwater subsea systemsGulf of Mexico PaleogeneEffective Reservoir AccessSafe wells informed by real-time dataDeveloping equipmentand techniques forreservoir conditionsBeyond Sand ControlReal-time downholesand monitoring,diagnostics and control53
Upstream value growth 2010 Gulf of Mexico incident Strategic and operational progress 2011 – year of consolidation: Increased turnaround activity Uncertainty on Gulf of Mexico timing Increasing investment for growth Long-term value growth Portfolio focus – deepwater, gas, giant fields Enduring positions in best basins – relationships, resource knowledge andtechnology Functional excellence acros
Bob Fryar Executive Vice President, Production Andy Hopwood Executive Vice President, Strategy & Integration Mark Bly Executive Vice President, Safety & Operational Risk Bob Dudley Group Chief Executive David Peattie Senior Vice President, Russia Lamar McKay President & Chairman BP America & GCRO Rupert Bondy Group General Counsel 2011 BP .