Transcription
2010 18th Annual IEEE/ACM International Symposium on Modeling, Analysis and Simulation of Computer and Telecommunication SystemsBarra: a Parallel Functional Simulator for GPGPUSylvain Collange, Marc Daumas, David Defour and David ParelloELIAUS-PROMES (UPVD) — Perpignan — FRANCEEmail: firstname.lastname@univ-perp.frBarra monitors the activity of computational units, communication links, registers and memories. As it is integrated inan open structural simulation framework, we may later buildtimed simulators of GPU modules for the exploration of somespecific design spaces.An overview of simulation and the CUDA framework isgiven in Section II. A general view of the proposed frameworkand features of our simulator and driver are presented inSection III. Section IV presents our approach to the parallelization of Barra. Validation and performance comparisonare respectively given in Sections V and VI.Abstract—We present Barra, a simulator of Graphics Processing Units (GPU) tuned for general purpose processing (GPGPU).It is based on the UNISIM framework and it simulates the nativeinstruction set of the Tesla architecture at the functional level.The inputs are CUDA executables produced by NVIDIA tools.No alterations are needed to perform simulations. As it usesparallelism, Barra generates detailed statistics on executions inabout the time needed by CUDA to operate in emulation mode.We use it to understand and explore the micro-architecture designspaces of GPUs.I. I NTRODUCTIONWe are witnessing a tremendous growth in the use ofGraphics Processing Units (GPU) for the acceleration of nongraphics tasks (GPGPU). This is due to the huge computing power delivered by GPUs and the recent availability ofCUDA, a high-level and flexible development environment.Meanwhile, commodity graphics hardware is rapidly evolving, adding new features with each successive generationto accelerate execution of graphics routines as well as highperformance computing software.Functional and cycle-level simulations have long been usedby CPU architects to study the effects of changes in architectural and micro-architectural designs. New hardware featuresare proposed and validated by explorations of design spacesbased on simulation. This methodology helps executives estimate costs and performances of proposals. In hierarchicaldesign, functional simulators are used for uppermost blocksand timed simulators, such as cycle-level or transaction-levelsimulators, are used for inner blocks, when necessary.Complex architectures of modern GPUs carry many significant challenges for researchers interested in exploringarchitectural innovations and modeling precisely the effects ofchanges, similarly to what is done for CPUs. Yet, architecturesof modern GPUs are largely secret as vendors are reluctant torelease architectural details and few GPU simulators are freelyavailable because of the tremendous manpower required indevelopment and validation.We present a modular and parallel simulator based onthe UNISIM framework to perform functional simulations ofGPUs targeting GPGPU applications. It is named Barra. Wechose the NVIDIA architecture due to the wide acceptanceof CUDA environment in GPGPU. Our framework integratestwo broad functions: A simulator of the hardware structures and functionalunits of the GPU; A simulator of the driver which loads the input programs,performs management tasks and emulates the graphicsGPGPU driver.1526-7539/10 26.00 2010 IEEEDOI 10.1109/MASCOTS.2010.43II. C ONTEXTA. SimulationThe availability of CPU simulators for superscalar architectures in the 1990s was the starting point of various academicand industrial researches in computer architecture. Simulationcan be performed at various levels, depending on the accuracyrequired. Cycle-level simulators use cycle accurate modelscharacterized by a high accuracy on performance evaluationwith respect to real hardware. Transaction-level simulators aremostly based on functional models and focus on timing communications. The fastest simulations operate at functional-leveland mimic the processor behavior in a simulated environment.The SimpleScalar cycle-level simulator [4] was at the originof various works accompanying the success of superscalarprocessors in the late 1990s. However this simulator wasknown to be unorganized and difficult to modify. Alternativesto SimpleScalar were proposed for multicore simulation [16]or full-system simulation [6], [15], [25]. Concerning GPUs,simulation frameworks targeting the graphics pipeline wereintroduced such as the Attila cycle-level simulator [17] orthe Qsilver transaction-level simulator [28]. However, thearchitectural issues were different than those of many-coreparallel coprocessors such as modern GPUs.GPU simulators putting an emphasis on parallel computinghave been proposed following the release of CUDA. TheOcelot framework is a compiler infrastructure built around theNVIDIA PTX intermediate language. It includes an emulatorto run CUDA programs [11]. As a virtual machine, it is notbound to a specific architecture and its design goal is to deliverthe most simple software implementation. GPGPUSim [5] isa cycle-level many-core simulator based on SimpleScalar. Itsimulates an original GPU-like architecture which uses theabstract PTX language as its ISA.351
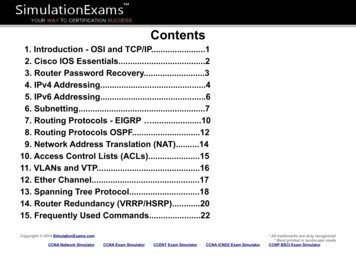
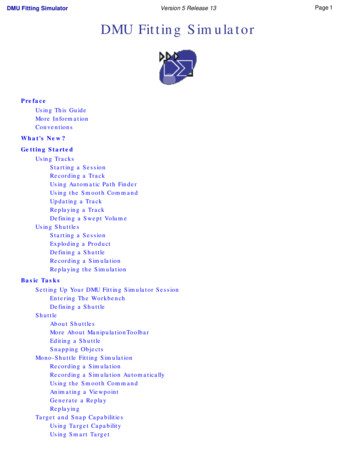
Hardware: TeslaSoftware: CUDAMultiprocessor nMultiprocessor 2Block 1Multiprocessor 1GPUmemory(globalmemory)Instruction UnitSP SP SP SP SFUSharedMemoryBlockSchedulerVector register fileVR 0 VR 1.VR iR0 R16Vector register fileR1 R17SP SP SP SP SFUR15 R31. .Fig. 1.GridBlock 2.Inst.Block nInst.KernelInst.Warp 1 Warp 2 . Warp k0 1 . 32ThreadsProcessing flow of a CUDA program.C. CUDA environmentB. Using UNISIM modular simulation frameworkThe Compute Unified Device Architecture (CUDA2 ) is avector-oriented computing environment developed by NVIDIA[19]. It relies on a stack composed of an architecture, alanguage, a compiler, a driver and various tools and libraries.A CUDA program runs on an architecture composed of ahost processor CPU, a host memory and a graphics card withan NVIDIA GPU that supports CUDA. CUDA-enabled GPUsare made of an array of multiprocessors. GPUs execute thousands of threads in parallel thanks to the combined use of chipmultiprocessing (CMP), simultaneous multithreading (SMT)and SIMD processing [14]. Figure 1 describes the hardwareorganization of these processors. Each multiprocessor containsthe logic required to fetch, decode and execute instructions.The hardware organization is tightly coupled with the parallel programming model of CUDA. The programming languageused in CUDA is based on the C language with extensions toindicate that a function is executed on the CPU or the GPU.Functions executed on the GPU are called kernels and followthe single-program multiple-data (SPMD) model. CUDA letsprogrammers define which variables reside in the GPU addressspace and specify the kernel execution domain (number ofthreads) partitionned into blocks.Several memory spaces are used on the GPU to matchthis organization. Each thread has its own local memoryspace, each block has a distinct shared memory space, andall threads in a grid can access a single global memory spaceand a read-only constant memory space. A synchronizationbarrier instruction can synchronize all threads inside a block toprevent some race conditions. It does not synchronize differentblocks. Therefore, direct communications are possible insideblocks but not across blocks, as the scheduling order of blocksis not specified.This logical organization is mapped to the physical architecture. Threads are grouped together in so-called warps.Each warp contains 32 threads in the Tesla architecture. Itfollows a specific instruction flow, with all its threads runningin lockstep, in an SIMD fashion. Blocks are scheduled onModular simulation frameworks [2], [3], [24] have beendeveloped during the last decade to assist with software development of new simulators. The common appealing featureof such environments is the ability to build simulators fromsoftware components mapped to hardware blocks. Modularframeworks can be compared based on criteria of modularity,tools and performances.All environments suggest that modules share some architecture interfaces to provide modularity by allowing modulesharing and reuse. Some of them strongly enforce modularityby adding some communication protocols to distribute hardware control logic into modules as proposed by LSE [3],MicroLib [24] and UNISIM [2].The UNISIM environment includes GenISSLib, a codegenerator that builds an instruction decoder from any highlevel description of the instruction set. The generated decoderis based on a cache containing pre-decoded instructions. Ontheir first encounter, binary instructions are decoded and addedto the cache. Subsequent executions of the same instructionperform look-ups of the decoded instruction in the cache. Thedescription language allows users to add some functionalities.Simulation speed is becoming a main issue of modularframeworks as architecture and software complexity increases.Two solutions have been proposed to tackle this issue. Bothpropose trade-offs between accuracy and simulation speed.The first solution uses sampling techniques [30] and is suitablefor single-thread simulation. The second solution is bettersuited for multicore and system simulation. It suggests tomodel the architecture at a higher level of abstraction with lessdetails than cycle-level modeling: transaction-level modeling(TLM) [27]. To our knowledge, today, UNISIM is the onlymodular environment offering both cycle-level and transactionlevel modeling based on the SystemC standard1 .Recent techniques [23] have been proposed to improvecycle-level simulation of multicore architectures.2 http://www.nvidia.com/cuda.1 TheOpen SystemC Initiative, http://www.systemc.org/.352
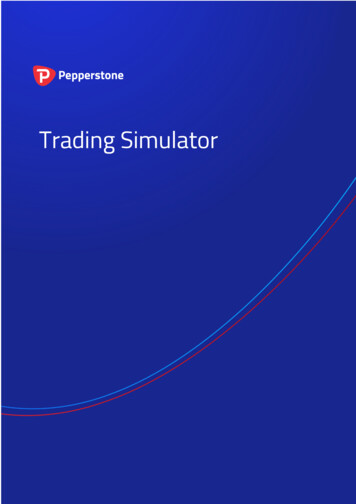
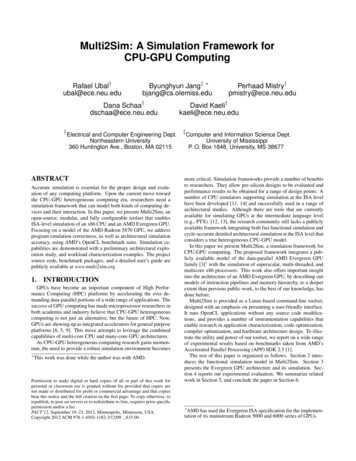
B. Barra and Tesla ISA decodingmultiprocessors, taking advantage of CMP-type parallelism.Each multiprocessor handles one or more blocks at a giventime depending on the availability of hardware resources(register file and shared memory). Warp instructions are interleaved in the execution pipeline by hardware multithreading.For instance, the GT200 implementation processes up to 32warps simultaneously. This technique helps hide the latencyof streaming transfers, and allows the memory subsystem tobe optimized for throughput rather than latency.Likewise, the logical memory spaces are mapped to physicalmemories. Both local and global memories are mapped touncached off-chip DRAM, while shared memory is stored ona scratchpad zone inside each multiprocessor, and constantmemory is accessed through a cache present inside eachmultiprocessor.Several tools are provided to assist development of applications in the CUDA environment. First, a built-in emulationmode runs user-level threads on the CPU on behalf of GPUthreads, thanks to a specific compiler back-end. However, thismode differs in many ways with the execution on a GPU: thebehavior of floating-point and integer operations, the scheduling policies and memory organization are different. NVIDIAalso provides a debugger starting with CUDA 2.0 [20]. Finally,CUDA Visual Profiler provides some performance evaluationof kernels using hardware counters on the GPU.The Tesla instruction set was introduced with the Teslaarchitecture in 2005. Since that time NVIDIA has developed,debugged and optimized a toolset containing a compiler, adebugger, an emulator and many libraries. Though the ISA ofthe Fermi architecture [21] is not binary-compatible with theTesla one, independent analysis3 has shown that it keeps mostof the traits of the Tesla ISA.Table I in Section V shows the number of static PTXinstructions and the number of static Tesla instructions forsome benchmarks and kernels. It is difficult to correlate thesenumbers as PTX to Tesla ISA compilation is a complexprocess. Most compiler optimizations occur during this step,including optimizations that can affect the semantics of programs such as fusions of additions and multiplications intoeither truncated of fused multiply-and-adds. Simulation at thePTX instruction set level may lead to low accuracy. Therefore,we simulate directly the Tesla ISA to remain as close aspossible from what really occurs in GPUs. We recovered thespecifications of Tesla 1.0 ISA as NVIDIA, unlike AMD [1],does not document its ISA. This was done by completing theharnessing work started in the decuda project [29].This instruction set is designed to run compute-intensivefloating-point programs. It is a four-operand instruction setcentered on single-precision floating-point operations. It includes a truncated multiply-and-add instruction and transcendental instructions for the reciprocal, square root reciprocal,base-2 exponential and logarithm, sine and cosine accurate to23 bits. Transparent execution of thread-based control flowin SIMD is possible thanks to specific branch instructionscontaining reconvergence information.Most instructions are 64-bit wide, but some instructionshave an alternate 32-bit encoding. Another encoding allowsembedding of a 32-bit immediate constant inside a 64-bitinstruction word.An example of the instruction format of floating-pointmultiplication-additions in single precision (MAD) is givenin Figure 2. These instructions can address up to 3 sourceoperands (indicated by Src1, Src2 and Src3) in GeneralPurpose Registers (GPR), shared memory (sh mem), constantmemory (const mem) or as immediate constants (imm). Thedestination operand is indicated by Dest. Extra fields such aspredication control and instruction format are defined. Eachpiece of information is mostly orthogonal to the other piecesand can be decoded independently.Taking advantage of this orthogonality, we use theGenISSLib library to generate six separate decoders working on the whole instruction word (opcode, destination andpredicate control, Src1, Src2, Src3, various flags), each beingresponsible for a part of the instruction, while ignoring theother fields.III. BARRA FUNCTIONAL SIMULATORBarra contains two sets of tools. The first one replaces theCUDA software stack, while the second one simulates theactual GPU.A. CUDA driver emulatorThe Barra framework is designed so that the simulator canreplace the GPU with minimal modifications in the development or execution process of a CUDA program. The Barradriver is placed inside a shared library that has the samename and exports the same symbols as NVIDIA’s proprietaryone libcuda.so. Consequently calls posted for the GPU arecaptured dynamically and rerouted to the simulator. By settingan environment variable, the user switches between executingan unmodified CUDA program on the GPU and simulating iton Barra.The proposed Barra driver includes all major functionsof the Driver API so that CUDA programs can be loaded,decoded and executed on the simulator. It performs in a CPUsimulator the tasks done by the operating system and loader.All types of memories are mapped at different addressesin a single physical address space in Barra though the CUDAmodel describes logically separated memories (constant, local,global, shared) and the Tesla hardware contains physicallyseparated memories (DRAM and shared memories). The virtual address space is currently mapped directly to the physicalspace. We will provide virtual address translation in the future,allowing stricter address checking, multiple CUDA contextsand performance modeling of TLBs.3 http://0x04.net/cgit/index.cgi/nv50dis.353
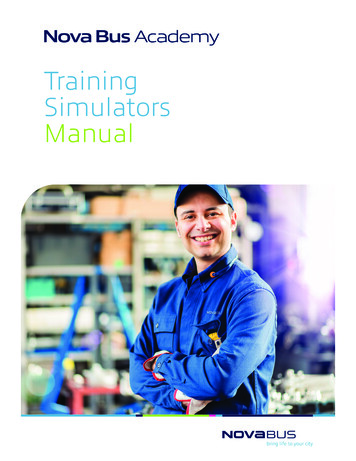
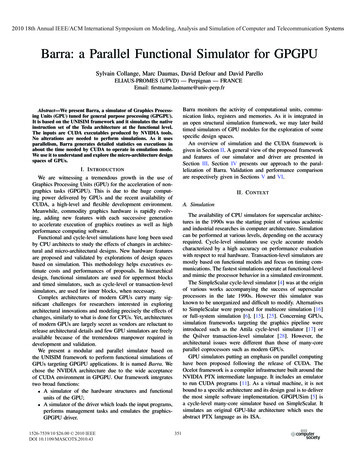
Fig. 2.Opcode fields of a MAD instruction.C. Instruction executionD. Simulation of fine-grained parallelismTesla differs in several aspects from conventional multi-coreprocessors as it is a throughput-oriented architecture.1) Register management: GPRs are dynamically split between threads during kernel launch, allowing to trade somereduced parallelism against a larger number of registers perthread. Barra maintains a separate state for each active warpin the multiprocessor. The state includes a program counter,address and predicate registers, a hardware stack for controlflow execution, a window to the assigned register set, and awindow to the shared memory.Multiprocessors of Tesla-based GPUs have a multi-bankregister file partitioned between warps using sophisticatedschemes [13]. This allows a space-efficient packing that minimizes bank conflicts. However, the specific register allocationpolicy bears no impact on functional behavior, apart fromdeciding how many warps can have their registers fit in theregister file. Therefore, we opted for a plain sequential blockallocation inside a single unified register file.2) Warp scheduling: Each warp has a state flag indicatingwhether it is ready for execution. At the beginning, eachrunning warp has its flag set to Active while other warps havetheir flag set to Inactive. At each step of the simulation, anActive warp is selected to have one instruction executed usinga round-robin policy.The current warp is marked as Waiting when a synchronization barrier instruction is encountered. If all warps are eitherWaiting or Inactive, the barrier has been reached by all warps,so Waiting warps are put back in the Active state.A specific marker embedded in the instruction word signalsInstructions are executed in Barra according to the modeldescribed in Figure 3: A scheduler selects the next warp for execution with thecorresponding program counter (PC).The instruction is loaded and decoded as described inSection III-B.Operands are read from the register file or from on-chipmemories (shared) or caches (constant). As the memoryspace is unified, a generic gather mechanism is used.The instruction is executed and the result is written backto the register file.Integer and floating-point instructions can optionally update a flag register containing zero, negative, carry andoverflow flags.Evaluation of transcendental functions in the Tesla architecture is a two step process: a range reduction based ona conversion to fixed point arithmetic is followed by a callto a dedicated approximation unit. This unit is described in[22]. It contains some dedicated operators using tabulatedvalues. An exact simulation of this unit will require someexhaustive tests on every possible value in single precision.Barra’s current implementation of transcendental functions isbased on a similar range reduction followed with a call to thestandard math library of the host.Single-precision floating-point arithmetic operations flushto zero all input and output denormals as specified by thearchitecture.354
Warp 3 :@p1.leu mad.f32.rn p1 r2, s[a2 48], r0, @p1.leu32OPPC@p1Destp1 r2Src1s[a2 48]Src2r0Src3c14[32]r04x32Predicate p1registersAddressregistersFig. 3.32x32.leumad.f32.rnWarp 3Warp IDAddressVectorMaskc14[32]s[a2 48]W24Write64a2ALU/FPU4x32r232x3232x32Register File32x32MemoryFunctional overview of a multiprocessor execution pipeline during the execution of a MAD instruction.the end of the kernel. When encountered, the current warpis flagged as Inactive so that it is ignored by the schedulerin subsequent scheduling rounds. A new set of blocks isscheduled to the multiprocessor as soon as all warps of runningblocks have reached the Inactive state.3) Branch handling: Tesla architecture allows divergentbranches across individual threads in a warp to be executedtransparently thanks to some dedicated hardware [10]. Thisis performed using a hardware-managed stack of tokens containing an address, an ID and a 32-bit mask. The ID allowsforward branches, backward branches and function calls toshare a single stack (see Figure 4).order of blocks is not specified, global synchronization is notallowed, communications between blocks are restricted andrelaxed requirements on memory consistency enable efficientand scalable hardware implementations. We use these featuresto simulate each multiprocessor in a different thread of thehost.Our tests suggest that the block scheduler of CUDAdispatches blocks across multiprocessors in a round-robinfashion, and performs a global synchronization barrier between each scheduling round. We followed a slightly differentapproach to block scheduling in Barra by distributing thescheduling decisions across worker threads. Our approachcomplies with the static scheduling of CUDA and it removesthe need to perform a global synchronization after eachscheduling round. At warp level, the fine-grained multithreading is simulated as described in Section III-D.Simulators of general-purpose processors need to handledynamic memory allocation and self-modifying code in simulated programs. This requires using cache-like data structuresthat can grow as needed to store data and instructions. Sharing such structures in a multithreaded environment requireslocking techniques. This can be challenging to implementand validate and can impact performance. Fortunately, CUDAIV. S IMULATOR PARALLELIZATIONData-parallel programs such as kernels developed in CUDAexpose significant amounts of explicit parallelism. GPU simulation may run efficiently and accurately on current multi-coreprocessors thanks both to multithreading and SIMD. This factscan be exploited to accelerate functional simulation.A. Simulating many-core with multi-coreCUDA programming model is designed to reduce as muchas possible coupling across multiprocessors. The scheduling355
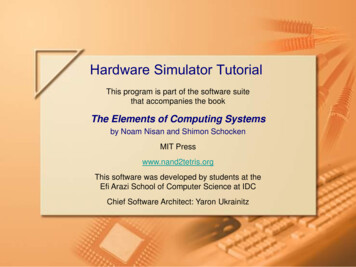
C codeif(p){.}else{.}PCTesla asm codeStack?1:sync endif2:@!p br elseActive maskDIVSYNC1 push(6,SYNC,mask)6?3:.4:br endifelse:SYNCDIVSYNC2 push(3,DIV,p̄ mask);PC else3DIV56SYNC?5:.endif:6:nop.joinDIVSYNC6 read(PC);read(mask);pop()6SYNC3?DIV?SYNC46 read(mask);pop()?Fig. 4.DIVSYNCExample of SIMD forward branch.were not initially meant to be used as benchmarks. They reflectthe best practices in CUDA programming as code examples.Most of these examples use a data-set reduced for size whenrun in emulation mode. We made sure they always run thecomplete data-set. We inserted synchronization barriers whereit was missing to get correct timings.Execution on Barra of the examples listed in Table I returnsthe same results than what is provided from GPUs, except forthe examples that use transcendentals instructions, as expectedgiven the differences in the implementations. CUDA emulationmode is less accurate. For instance, results returned by thedwtHaar1D example from the CUDA SDK differ by 0.5 unitsin the last place (ulps) on average and by 1681 ulps in theworst case between CUDA emulation and execution on a GPU.During functional simulation, we collected statistics aboutinstruction types, operands, branch divergences, memory access types on a per-static-instruction basis. We did not observe any variation in the statistics generated between singlethreaded and parallel functional simulation.We compared these statistics with the hardware countersduring a run on a GPU by using the CUDA Profiler, which provides statistics on a per-kernel-execution basis. GPU hardwarecounters are currently usable on one texture processing cluster(TPC4 ) only. Therefore an extrapolation is needed to estimatethe performance of the whole kernel. The precise meaning,unit and scale used for each counter is not documented. Asthe profiler documentation reports, “users should not expectthe counter values to match the numbers one would get byinspecting kernel code.” However, we were able to match thevalue of most of these counters with statistics obtained fromsimulation. We report the relative differences observed forprogramming model prevents this kind of irregular behavior inthe simulated code. It follows Harvard architecture model andit requires the user to explicitly allocate all the memory thatwill be accessed inside a GPU kernel before the execution begins. Accordingly, we can pre-allocate all data and instructionmemories of the simulator in lock-free data structures.The strong isolation rules enforced between blocks ofCUDA programming model benefits hardware implementations as well as simulation on multi-core CPUs.B. Simulating SIMD with SIMDThe Tesla architecture uses 32-way SIMD instructions toexecute regular code efficiently. It helps amortize the cost ofinstruction fetching, decoding and scheduling. It also helpssimulation as the part of time dedicated to the actual executionof instructions increases with the complexity of the architecture.To further benefit from the regularity introduced bythe SIMD model, we implement the basic single-precisionfloating-point instructions (add, mul, mad, reciprocal, reciprocal square root) with SSE SIMD instructions using C intrinsicswhen they are available. The Denormals-Are-Zero and FlushTo-Zero SSE flags are enabled to reflect the behavior ofthe GPU operators and to prevent denormals from slowingdown the simulation. The implementation of floating-pointinstructions, including min and max functions, complies withthe behavior of GPUs concerning NaN propagation as long asall input NaNs are encoded as canonical QNaNs.V. VALIDATIONWe used examples from the NVIDIA CUDA SDK tocompare the execution on our simulator with real executionson Tesla GPUs. These examples are currently the most standardized test suite of CUDA applications even though they4 A texture processing cluster is a hardware structure containing two to threemultiprocessors sharing memory access units.356
lerMonteCarloOneBlock. . .reduce5 sm10reduce6 sm10prescan false,false prescan true,false prescan true,true uniformAddtranspose naivetransposeSt. 2St. 2Dyn. 257,65142,696,6391,835,0082,752,512TABLE IB ENCHMARKS AND KERNELS WE CONSIDER ALONG WITH THEIR STATIC PTX INSTRUCTION COUNT (S T. PTX), AND STATIC AND DYNAMIC ASSEMBLYINSTRUCTION COUNTS (S T. ASM AND DYN . ASM RESPECTIVELY ).instruction, branch, branch divergence and memory transactioncounts in Figure 5 and int Table II.The instruction counts are consistent, except in the scanLargeArray benchmark. A closer analysis of the performancecounters reveals that the kernel prescan true,false islaunched many times on one single block. The profiler seemsto select a different TPC to instrument at each kernel call inthe round-robin to mitigate the effect of such load imbalance.However, the load imbalance effect remains and affects thecounters as the number of calls (202) is not a multiple of thenumber of TPCs (8).We were not able to find out the exact meaning of thebranch instruction counter. We found it to be consistentlyequal or higher than the number of all control flow instructionsencountered in Barra.The transpose application and the matrixMul one, to alesser extent, show discrepancies in the number of memoryinstructions reported. The transpose benchmark is known tobe affected by a phenomenon dubbed as partition camping,which occurs when most memory accesses over a period oftime are directed to a narrow subset of all DRAM banks, causing conflicts [26]. We simulated and profiled the transposeNew example, which implements the same algorithm whileavoiding partition camping and obtained consistent results,which confirms that the observed discrepancy is caused bythis phenomenon. We are currently investigating whether thedifference in memory transaction count is due to samplingartifacts or actually reflects some hardware mechanism.As it was discussed in Section III-B, the Tesla ISA isundocumented and some instructions that we have not yetencountered will not be correctly handled by Barra. We useboth synthetic test cases such as those provided with decudaand real-world programs such as the CUDA SDK examplesto check and extend the instruction coverage.VI. S IMULATION SPEED RESULTSWe compared and reported in Figure 6 the execution timeof the benchmarks in CUDA emulation mode, in a singlethreaded functional simulation with Barra, inside the CUDAgdb debugger with a native execution on a GPU. Reported timeis normalized to the native execution time for each program.The test platform is a 3.0 GHz Intel Core 2 Duo E8400with a NVIDIA GeForce 9800 GX2 graphics board on anIntel X48 chipset, running Ubuntu Linux 8.10 x64 with gcc4.3 and CUDA 2.2. The -O3 option was passed to gcc. Thedebugger from CUDA 2.3 Beta was used as it is the firstversion compatible with our architecture. When run withinthe CUDA debugger, the MonteCarlo and binomialOptionsbenchmarks did not complete within 24 hours, so we could notreport their performance. We did not include these benchmarkswhen computing the average of CUDA-gdb timings.We observe that even when run on one core, Barra iscompetitive with the CUDA emulation mode in terms of speedthough it is more accurate. This is likely because simulatingfine-grained intra-block multithreading using user-managedthreads as the emulation mode does causes thread creationand synchronization overhead to dominate the execution time.The CUDA debugger usually suffers from an even greateroverhead, likely caused by synchronizations across the wholesystem and data transfers to and from the CPU after theexecution of each instruction.To quantify the benefits of simulator parallelization, wesimulated the same benchmarks on a quad core Intel XeonE5410-based workstation running Red Hat 5 and gcc 4.1with a number of threads ranging from 1 to 4 to obtainFigure /reffig/scaling. The average speedup is 1.90 when goingfrom 1 to 2 cores and 3.53 when going from 1 to 4 coresshowing that Barra is strongly scalable. This is thanks to the357
100Relative error (%)Instruction countBranch
are proposed and validated by explorations of design spaces based on simulation. This methodology helps executives es-timate costs and performances of proposals. In hierarchical design, functional simulators are used for uppermost blocks and timed simulators, such as cycle-level or transact