Transcription
EQUITY RESEARCH May 2, 2018 3:57AM BSTThe following is a redacted version of the original report. See inside for details.NEXTGEN POWERSolar costs have plummeted by 80% since 2010, which is game-changing for power markets as itremoves the main obstacle preventing renewables from dominating the energy mix: the cost ofenergy from large-scale PV plants is now lower than that of conventional fossil fuel plants. Theeconomics for solar are particularly compelling in Spain, which we consider the precursor of astructural trend that’s likely to spread across major markets globally. Improved economics, inconjunction with the rise in corporate offtakes (PPAs) and potentially higher EU 2030 renewabletargets, could accelerate the process beyond consensus expectations. We forecast that this structuralshift will disrupt legacy generation, and see a sizeable c.15%-40% earnings risk by 2030E for the mostexposed names across Europe.Alberto Gandolfi 44 20 7552-2539alberto.gandolfi@gs.comGoldman SachsInternationalManuel Losa 44 20 7774-8817manuel.losa@gs.comGoldman SachsInternationalAjay Patel 44 20 7552-1168ajay.patel@gs.comGoldman SachsInternationalBaptiste Cota 44 20 7774-0042baptiste.x.cota@gs.comGoldman SachsInternationalMatteo Rodolfo 44 20 7051-8860matteo.rodolfo@gs.comGoldman SachsInternationalGoldman Sachs does and seeks to do business with companies covered in its research reports. As aresult, investors should be aware that the firm may have a conflict of interest that could affect theobjectivity of this report. Investors should consider this report as only a single factor in making theirinvestment decision. For Reg AC certification and other important disclosures, see the DisclosureAppendix, or go to www.gs.com/research/hedge.html. Analysts employed by non-US affiliates are notregistered/qualified as research analysts with FINRA in the U.S.The Goldman Sachs Group, Inc.a10b7385ebb74b7f8ba9015d3c3487b7Solar to transform Europe's energy mix
Goldman SachsNextGen PowerTable of ContentsExecutive Summary4The solar industry: Booming for nearly two decades11Solar economics: 80% cheaper than 201014Solar LCOE could fall by 30%-50% by 203017Corporate PPAs likely to accelerate the process20EU 2030 targets have upside risk22Earnings risk of 15%-40% for the most exposed names24Spain the early “solar mover”27Other European countries to follow, with a lag34Corporate strategies will have to respond to the new scenario37The roadmap to maxing out power from renewables38Introduction to solar PV and its impact on power economics41Disclosure Appendix44Note: The following is a redacted version of “NextGen Power: Solar to transform Europe'senergy mix" originally published May 2, 2018 [50pgs]. All company references in this noteare for illustrative purposes only and should not be interpreted as investmentrecommendations.14 June 20192
NEXTGEN POWER: SOLAR IN NUMBERS80%Reduction in solar costssince 2010.30%-50%Reduction in solar LCOEwe forecast by 2030.24 GW45%Discount of 2018E solarLCOE vs. forward curvein Spain.c.15%-40%EPS risk for the mostexposed names, by 2030.c.1.5%Current solar outputshare in globalenergy mix.Requests for grid connections inSpain for large solar PV projects,equivalent to c.25% of the totalinstalled base (plus 20GW ofwind requests).20%-40%Downside risk to power pricesacross Europe by 2030.60%Implicit share of renewableoutput in the power mixsuggested by the EuropeanParliament’s proposal, vsless than 30% today.
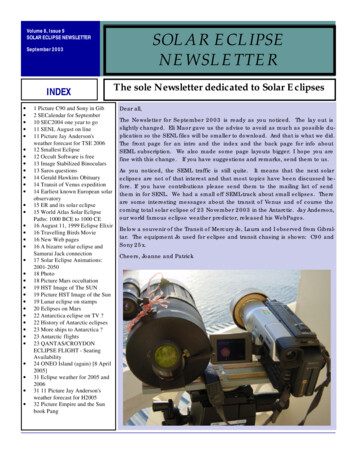
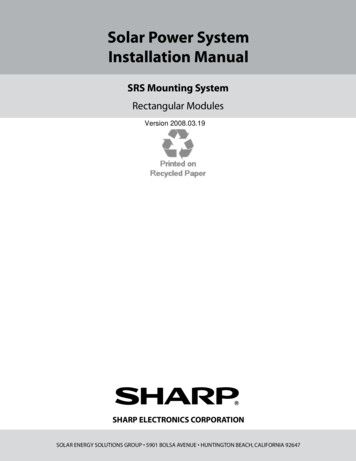
Goldman SachsNextGen PowerExecutive SummarySolar costs have plummeted by 80% since 2010; that’s game-changing for powermarkets as it removes the main obstacle preventing renewables dominating in theenergy mix: the cost of energy from large-scale PV plants is now lower than that ofconventional fossil fuel plants. The economics for solar are particularly compelling inSpain, which we consider the precursor of a structural trend which is likely to spreadacross major markets globally. What makes Spain well-suited for solar is thecombination of three “highs”: high irradiation, high power prices and high amounts ofspare generation capacity. Improved economics, in conjunction with the rise incorporate offtakes (PPAs) and potentially higher EU 2030 renewable targets, couldaccelerate the process beyond consensus expectations. We forecast that this structuralshift will disrupt legacy generation, and we see c.15%-40% earnings risk by 2030E forthe most exposed names across Europe.Solar economics continue to surprise: LCOE 45% below forward curvesSince 2010, levelised costs of energy (LCOE) for large-scale solar PV have fallen byc.80%, and we estimate the trend is set to continue owing to cheaper equipment costs,lower opex and better module efficiency (ie, higher load factors). In Spain, we estimatesolar LCOE at 28/MWh this year, c.45% below the forward curve, and expect it to dropto 19/MWh by 2030. Although the absolute LCOE levels will vary by country, weforecast the same reduction trend across Europe; the economics are particularlycompelling – for now – in Spain and Italy.Exhibit 1: Spain’s solar LCOE is c.45% below forwards and will keep decliningSpain: Solar PV LCOE evolution vs 2019 power forward, /MWh140 131120100 988060 77 632019 FW: 51/MWhMerchant PPA opportunity40 41 3520 31 30 28 28 28 27 26 25 24 23 22 21 20 20 1902010 2011 2012 2013 2014 2015 2016 2017 2018E 2019E 2020E 2021E 2022E 2023E 2024E 2025E 2026E 2027E 2028E 2029E 2030ESource: Goldman Sachs Global Investment Research, Bloomberg, IRENA14 June 20194
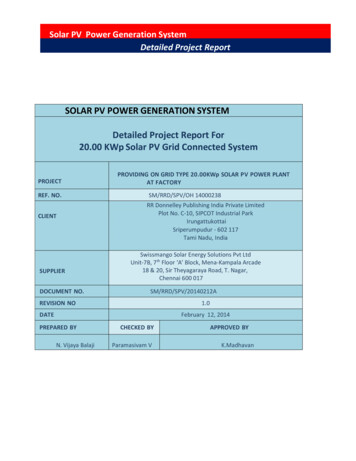
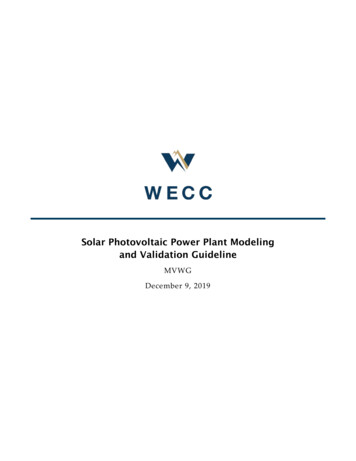
Goldman SachsNextGen PowerCorporate PPAs likely to accelerate the shift to renewablesSimilar to what has been happening in the US (where in 2017, corporate PPA volumesamounted to nearly 20% of the RES additions), European corporates have started tosign long-term power offtakes from renewable sources. Year-to-date, about 10% ofrenewables (RES) additions have come under corporate PPAs. We believe this new tool(C-PPA) will keep gaining momentum and could accelerate the development of solar PV(and wind): it is one of the reasons behind the 24 GW of PV projects currently underdevelopment in Spain (plus 20 GW of wind).Exhibit 2: We believe 2018 could be a turning point for corporate PPAs in EuropeMajor corporate PPA contracts signed in Europe since 2017 (MW)3,500 24GW solar 20GW wind3,0002,50020GW24GW14% of FY 2018annualised RES adds.2,0003004% of FY 2017RES additions1,5001706001,0001,97538180500650370NL WindOct 2017Sweden WindNov 2017NL WindNov 2017NL SolarFeb 2018Spain SolarMar 2018Spain SolarApr 2018Spain WindApr 2018EuropeSpainSpainCumulative planned solar planned windSource: Company data, Goldman Sachs Global Investment ResearchEU 2030 renewables targets have upside riskThe European Parliament has suggested raising the 2030 renewable energy target from27% to 35%, motivated by improved economics. Considering some pushbacks by theCouncil, we assume that the final outcome might settle at 30%-32%, based on similarEU decisions. Since the current target implies a 45% share for renewable electricitygeneration by 2030, we estimate that under a revised 35% target, the share ofrenewable electricity would need to increase to 60% - or nearly double vs the currentEU-28 average of c.30%.14 June 20195
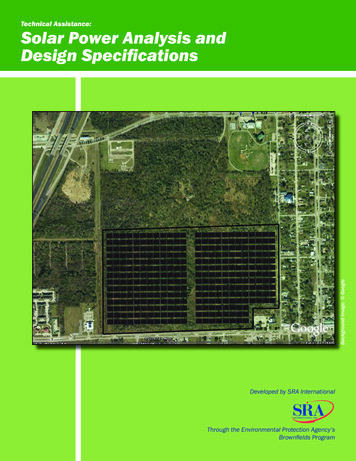
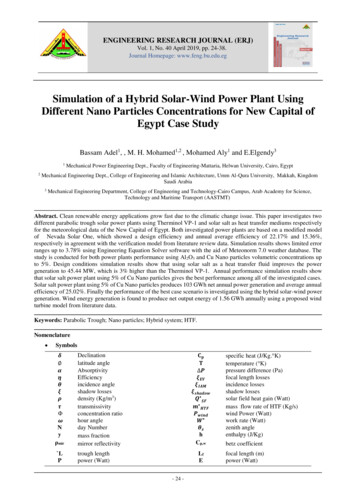
Goldman SachsNextGen PowerExhibit 3: EU 2030 upgraded targets could imply significant upside to Europe’s demand for renewablesRenewables penetration as % of total electricity generation (2017) vs EU target and EP 20%10%0%FranceUKItalySpainGermanyNordicEU 2030 TargetEU 2030GSeSource: Eurostat, Goldman Sachs Global Investment ResearchLegacy generation: 15%-40% of earnings at risk for most exposed namesCurrently, legacy generation assets account for about 15% of sector EBITDA (vs 40%at their 2010 peak). We estimate that, by 2030, legacy generation EBITDA could face30% downside risk. Although equivalent to “just” c.5% of sector EBITDA, the impactwould be concentrated in a handful of companies.Spain the early mover; Italy to follow, the rest much laterWhen estimating how soon a country may be impacted, we observe: i) irradiation levels,ii) regional power prices, iii) presence of spare/backup capacity, iv) grid bottlenecks, v)energy policy. Based on this framework, Spain would appear the early mover (visibleimpact by 2023-25); Italy could be second (2025-27), while France and the UK would seethreats during 2027-30 (Germany post-2030, owing to large-scale closures in legacycapacity and a lower starting point for power prices). We see no threat in the Nordicregion, as currently c.90% of the supply is already from fixed-cost, must-run powergeneration facilities, irradiation levels are lower and as power prices are already thelowest in Europe.14 June 20196
Goldman SachsNextGen PowerExhibit 4: Spain and Italy appear to have the best potential for a prolonged boom in Solar PVGS framework to assess take-up of Solar PVIrradiation LevelsWholesale Power Price(Load Factors, 2023E)(2019 /MWh)Grid StatusTransmissionDistributionShutdowns by ertainFrance15%4313Less supportiveGermany13%3842SupportiveUK12%5711Less supportiveNordic9%315NMSource: Goldman Sachs Global Investment Research14 June 20197
Goldman SachsNextGen PowerExhibit 5 shows the vast discount of solar PV LCOE vis a vis the prevailing forwardcurves across Europe. The gap is particularly wide for Spain and Italy.Exhibit 5: The spread between LCOEs and forwards suggests that Spain and Italy will be at the forefront of the rise in solarSolar PV LCOEs vs 2019 forward prices in orange ( /MWh) 70 65 64 57 60 52 51 50 41 40 30 25 25 38 34 28 47 38 34 30 47 46 43 34 31 29 25 22 19 20 10 2018E 2023E 2030E2018E 2023E 2030E2018E 2023E 2030E2018E 2023E 2030E2018E 2023E 2030E2018E 2023E 2030ESpainItalyFranceGermanyUKNordic.Source: Goldman Sachs Global Investment Research, BloombergPower prices could decline significantly by 2025-30The rising share of renewables as implied by the European Parliament’s proposal (tonearly 60% of the mix by 2030, a doubling vs 2017) would lead to declining power pricesin almost all of Europe. We believe the impact could be particularly severe in Italy andSpain, as explained earlier.Exhibit 6: Downside risk to power prices in most of Europe owing to the rise in solar (and wind)2019E forward curves vs our 2030E power price forecast ( 0100SpainItalyFrance2019E FwdGermany2030EUKNordicSource: Goldman Sachs Global Investment Research, Bloomberg14 June 20198
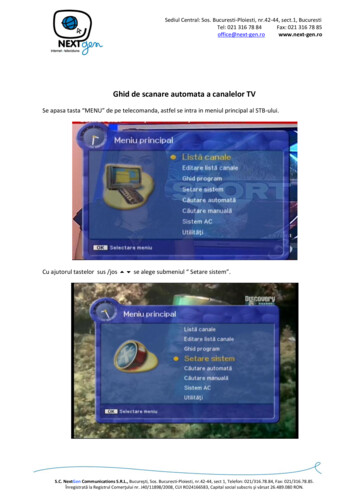
Goldman SachsNextGen PowerThe Spanish hourly example. The impact on supply/demand and power prices is likelyto be game-changing in Spain. Exhibit 7 shows that must-run technologies (hydro, wind,solar, nuclear, other renewables) would exceed demand about 57% of the time, by2030. This is likely to imply significant price squeezes in those hours, unless grid-scalebatteries are introduced by then, or the EV penetration has significantly picked up.Exhibit 7: Moving to 60% capacity from renewables would make the market “long” c.57% of the timeDaily generation from “must run” technologies and demand, 2030E ydroJun-30WindJul-30Solar Source: REE, Goldman Sachs Global Investment ResearchDisruption would likely trigger major industry responseSuch a scenario would likely trigger a major response by the industry, in our view,including: (i) consolidation, to gain more exposure to RES, (ii) portfolio reorganisations,to lower exposure to legacy assets, and (iii) step up in RES capex, to offset the earningscliff.The roadmap to maxing out renewables penetrationThis report is the first of a franchise series that will explore the milestones to monitorthe rise in solar (and wind) in the power mix, and the move towards 80% electricityfrom renewables, in line with the 2050 German target. Although renewables couldlower power bills thanks to the deflationary pressure on wholesale prices, increasing theshare of intermittent supply would also lead to negative externalities and to indirectcosts. We mostly believe these will relate to: (i) the digitalisation/expansion of the powergrid, (ii) the introduction of storage, and (iii) the need to introduce demand sidemanagement.14 June 20199
Goldman SachsNextGen PowerExhibit 10: The roadmap to maxing out renewables penetrationa10b7385ebb74b7f8ba9015d3c3487b7Source: Goldman Sachs Global Investment Research2 May 201810
Goldman SachsNextGen PowerThe solar industry: Booming for nearly two decadesFor nearly 20 years, the solar industry has been growing at c.50% CAGR. Yet, currentlysolar PV accounts for a mere c.1.5% of the global power output. Estimates by GS andthe IEA show that annual capacity additions globally could continue at a 14% pace until2025-30. Even still, by then, solar PV would still account for a mere 6% of the totalenergy mix (based on capacity, it would be less than half on output).Solar capacity additions: c.50% pa since 2000Global solar capacity has been growing at a c.50% rate pa on average since 2000.Growth has slowed in recent years given the higher base but remains at a healthyc.30% per year. Since 2000, the global invested capital in solar has reached aboveUS 800 bn in 2016.Exhibit 9: Global PV capacity began growing exponentially in themid-2000s.Exhibit 10: . transforming solar into a near US 1 tn industryGlobal invested capital in solar PV installations (US bn)Cumulative solar capacity installed globally, 0152026334661739112916802000 2001 2002 2003 2004 2005 2006 2007 2008 2009 2010 2011 2012 2013 2014 2015 2016So
Goldman Sachs does and seeks to do business with companies covered in its research reports. As a result, investors should be aware that the firm may have a conflict of interest that could affect the objectivity of this report. Investors should consider this report as only a single factor in making their investment decision. For Reg AC certification and other important disclosures, see the .