Transcription
International Journal of Scientific & Engineering Research, Volume 6, Issue 10, October-2015ISSN 2229-551878Predictive Analysis With Cricket TweetsUsing Big DataS Anjali #1, V Aswini #2, M Abirami #3Department of Computer Science and Engineering,Sri Manakula Vinayagar Engineering College.Puducherry – 605 107, India.1sanjaianjali@gmail.comAbstract - We are now living in a world of Big Data, massiverepositories of structured, semi-structured or unstructureddata. Each organization holds “electronic data or huge data”in large volume. Some organization see it as a burden andsome organization are exploring different ways to analyze,exploit and monetize the information contained within it butalso have to tackle with the cost and risk of storing that data.This changing trend of companies led to the concept ofBig data. One of the major applications of future generationparallel and distributed systems is in big-data analytics. Onesuch field of data analysis is “sports”. People all around theworld tweet about cricket matches going on every day. Thisaccounts to huge amount of data around the socialnetworking sites. Those data can be fetched, analyzed andmanipulated to predict the chances of team to win. By usingbig data concept such as map and reducing algorithm thefetched data is analyzed.named flume which is used to extract the data from thesocial networking sites.Social networking sites such as twitter accounts for hugeamount of data in the form of tweets in the field ofcricket . Those data can be fetched, analyzed andmanipulated to predict the chances of team to win. Byusing big data concept such as map and reducingalgorithm the fetched data is analyzed.IJSERKeywords- big data; data analytics; cricket; winning team;flumeI.INTRODUCTIONMany of the industries today are adopting more analyticalapproaches to making decision. However, no otherindustry has the analytical initiatives under the domain ofprofessional sports. There are multiple analytical domainsto predict the player performance, player selection,business management, prevention of injury, predictingwinning team and so forth.Despite this evidence of impressive activity and growth,the use of analytic makes the viewers to get an excitement,players to get confidence and plan the team stratergies inadvance in the field of cricket. Relatively few owners,managers, coaches, and players pursued careers inprofessional sports because of their interest in analytics.Even when considerable data and analytics are availableto support key decisions. However, it is clear that the useof analytics can contribute to success on the field. It’simpossible to equate winning records with more analyticalcapability, but the recent success of highly analyticalteams, hence for this case big data has introduced the toolII.RELATED WORKIn this section, we briefly present some of researchliterature related to data analysis .one such analysis isonline auctions and the final price or the winning priceprediction. Considerable work that applied traditionaltechniques to the online auction analysis has been made inthe economics domain in the paper published in 2006 byauthors Li Xuefeng, Sakaki. They also have developed analerting system based on Tweets (posts in the Twittermicro blogging service), being able to detect earthquakesalmost in real time . They elaborate their detection systemfurther to detect rainbows in the sky, and traffic jams incities. The practical point of their work is that the alertingsystem could perform so promptly that the alert messagecould arrive faster than the earthquake waves to certainregions.Bollen et al. have analyzed moods of Tweets and based ontheir investigations they could predict daily up and downchanges in Dow Jones Industrial Average values with anaccuracy of 87.6%. Another example is using Twitter topredict electoral outcomes about the product and responseof the particular product in the market. . Analysis is madeto report on an attempt to build a minimalistic predictivemodel for the financial success of movies based oncollective activity data of online users. We show that thepopularity of a movie can be predicted much before itsrelease by measuring and analyzing the activity level ofeditors and viewers of the corresponding entry to themovie in twitter, the well-known social media. Henceeven though there are many analytics done in field offeelings, emotional moods, opinions and views of people,IJSER 2015http://www.ijser.org
International Journal of Scientific & Engineering Research, Volume 6, Issue 10, October-2015ISSN 2229-5518no such analysis is done in field of sports. People allaround the world tweet about their leaders during electiontime, this involves the emotions, views, opinion of the ongoing election. Data analytics is used here to predict thepre-elective results based on peoples view.III. DATA ANALYTICSBig data analytics refers to the process of collecting,organizing and analyzing large sets of data to discoverpatterns and other useful information. Big data analyticswill help organizations to better understand theinformation contained within the data and will also helpidentify the data that is most important to the business andfuture business decisions. Big data analysts basically wantthe knowledge that comes from analyzing the data. Bigdata analytics enables organizations to analyze a mix ofstructured, unstructured and semi-structured data in searchof variable business information. Big data analytics is theprocess of examining big data to uncover hidden patterns,unknown correlations and other useful information thatcan be used to make better decisions. With big dataanalytics, data scientists and others can analyze hugevolumes of data that conventional analytics and businessintelligence solutions can't touch. Consider that yourorganization could accumulate (if it hasn't already)billions of rows of data with hundreds of millions of datacombinations in multiple data stores and abundantformats. High-performance analytics is necessary toprocess that much data in order to figure out what'simportant and what isn't.using big data analytics you can extract only the relevantinformation from terabytes, petabytes and exabytes, andanalyze it to transform your business decisions for thefuture. Becoming proactive with big data analytics isn't aone-time endeavor; it is more of a culture change – a newway of gaining ground by freeing your analysts anddecision makers to meet the future with sound knowledgeand insight.IV.COMPARISON WTH OTHER SYSTEMSThe first consideration that needs to be made whenselecting a database is the characteristics of the data youare looking to leverage. If the data has a simple tabularstructure, like an accounting spreadsheet, then therelational model could be adequate. In similar cases today,one should consider NoSQL databases as anoption. Multi-level nesting and hierarchies are very easilyrepresented in the JavaScript Object Notation (JSON)format used by some NoSQL products. The developerrequires high coding velocity and great agility in theapplication building process. NoSQL databases haveproven to be a better choice in that regard. Since manyNoSQL offerings include an open system, the communityprovides many productivity tools, another big advantageoversingle-vendor proprietary products.Someorganizations, such as MongoDB, even offer free coursesonline that train employees and interested users in how touse the technology.IJSERThere are four approaches to analytics, and each fallswithin the reactive or proactive category: Reactive –business intelligence. In the reactive category, businessintelligence (BI) provides standard business reports, adhoc reports, OLAP and even alerts and notifications basedon analytics. This ad hoc analysis looks at the static past,which has its purpose in a limited number of situations.Reactive – big data BI When reporting pulls from hugedata sets, we can say this is performing big data BI. Butdecisions based on these two methods are still reactionary.Proactive – big analytics Making forward-looking,proactive decisions requires proactive big analytics likeoptimization, predictive modeling, text mining,forecasting and statistical analysis. They allow you toidentify trends, spot weaknesses or determine conditionsfor making decisions about the future. But although it'sproactive, big analytics cannot be performed on big databecause traditional storage environments and processingtimes cannot keep up. Proactive – big data analytics. ByA.Operational issues: (scale, performance, and highavailability)As database grows in size or the number of usersmultiplies many RDBMS-based sites suffer seriousperformance issues. Next, consultants are brought in tolook at the problem and provide solutions. Vertical scalingis usually recommended at high cost. As processors areadded, linear scaling occurs, up to a point where otherbottlenecks can appear. Many commercial RDBMSproducts offer horizontal scaling (clustering) as well, butthese are bolted-on solutions and can be very expensiveand complex.If an organization is facing such issues, then it shouldconsider NoSQL technologies, as many of them weredesigned specifically to address these scales (horizontalscaling or scale-out using commodity servers) andperformance issues. Just like Google’s HDFS horizontalscaling architecture for distributed systems in batchprocessing, these newer NoSQL technologies were builtto host distributed databases for online systems.Redundancy (in triplicate) is implemented here for highavailability.IJSER 2015http://www.ijser.org79
International Journal of Scientific & Engineering Research, Volume 6, Issue 10, October-2015ISSN 2229-5518A common complaint about NoSQL databases is that theyforfeit consistency in favor of high availability. However,this can't be said for all NoSQL databases. In general, oneshould consider an RDBMS if one has multi-rowtransactions and complex joins. In a NoSQL database likeMongoDB, for example, a document (aka complex object)can be the equivalent of rows joined across multipletables, and consistency is guaranteed within that object.NoSQL databases, in general, avoid RDBMS functionslike multi-table joins that can be the cause of high latency.In the new world of big data, NoSQL offers choices ofstrict to relaxed consistency that need to be looked at on acase-by-case basis.V.BLENDINFG DATA FROM MULTIPLESOURCESThe nature of Big Data is large data, usually from multiplesources. Some data will come from internal sources, butincreasing data is coming from outside sources. Theseoutside sources include Social media data feeds such asTwitter and Facebook Point of Sale and customer loyaltytracking programs Government agency sources such ascensus data Spatial data from mobile devices and satellitemapping feeds from the Consumer demographic databrokers, such as Experian Any number of public, private,or community cloudsHadoop: You simply can't talk about big data withoutmentioning Hadoop. The Apache distributed dataprocessing software is so pervasive that often the terms"Hadoop" and "big data" are used synonymously. TheApache Foundation also sponsors a number of relatedprojects that extend the capabilities of Hadoop. Inaddition, numerous vendors offer supported versions ofHadoop and related technologies. Operating System:Windows, Linux, OS X.MapReduce: Originally developed by Google, theMapReduce website describe it as "a programming modeland software framework for writing applications thatrapidly process vast amounts of data in parallel on largeclusters of compute nodes." It's used by Hadoop, as wellas many other data processing applications.GridGain: GridGrain offers an alternative to Hadoop'sMapReduce that is compatible with the HadoopDistributed File System. It offers in-memory processingfor fast analysis of real-time data. You can download theopen source version from GitHub or purchase acommercially supported version from the link above.IJSERHPCC: Developed by LexisNexis Risk Solutions, HPCCis short for "high performance computing cluster." Itclaims to offer superior performance to Hadoop. Both freecommunity versions and paid enterprise versions areavailable.Storm: Now owned by Twitter, Storm offers distributedreal-time computation capabilities and is often describedas the "Hadoop of realtime." It's highly scalable, robust,fault-tolerant and works with nearly all programminglanguages.B. Programming LanguagesData blending is the process of combining multipleheterogeneous data sources and blending them into asingle, usable analytic dataset. The purpose of datablending is to create analytic datasets to answer businessquestions using data that is not bound by the control andlengthy timelines of traditional IT processes. An exampleof data blending is when the data analyst integratespackaged, external data from the cloud with internal datasources to create a very business-specific analytic dataset.A. Big Data Analysis Platforms and ToolsPig/Pig Latin: Another Apache Big Data project, Pig is adata analysis platform that uses a textual language calledPig Latin and produces sequences of Map-Reduceprograms. It helps makes it easier to write, understand andmaintain programs which conduct data analysis tasks inparallel.R: Developed by Bell Laboratories, R is a programminglanguage and an environment for statistical computing andgraphics that is similar to S. The environment includes aset of tools that make it easier to manipulate data, performcalculations and generate charts and graphs.ECL: ECL ("Enterprise Control Language") is thelanguage for working with HPCC. A complete set oftools, including an IDE and a debugger are included inHPCC, and documentation is available on the HPCC site.Operating System: LinuxData Aggregation and TransferIJSER 2015http://www.ijser.org80
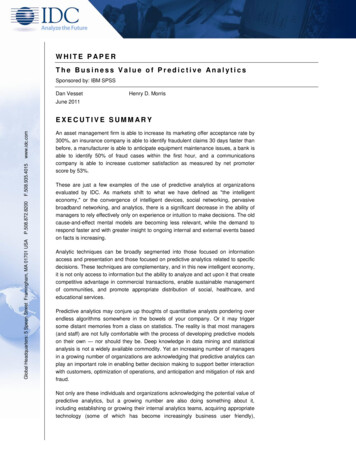
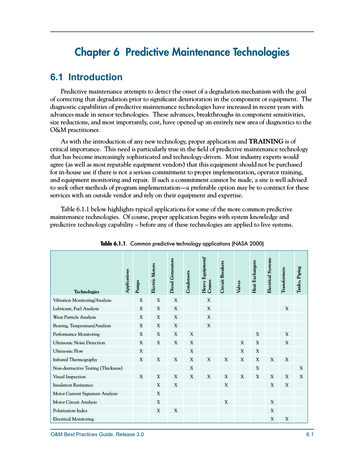
International Journal of Scientific & Engineering Research, Volume 6, Issue 10, October-2015ISSN 2229-5518Sqoop: Sqoop transfers data between Hadoop andRDBMSes and data warehouses. Sqoop tool is used toaccess the structured data.Flume: Another Apache project, Flume collectsaggregates and transfers log data from applications toHDFS. Flume tool is used to access the unstructured dataas well as the semi structured data.Chukwa: Built on top of HDFS and Map Reduce, Chukwacollects data from large distributed systems. It alsoincludes tools for displaying and analyzing the data itcollects.81The HDFS file system includes a so-called secondaryname node a misleading name that some might incorrectlyinterpret as a backup name node for when the primaryname node goes offline .In fact, the secondary name noderegularly connects with the primary name node and buildssnapshots of the primary name node's directoryinformation, which the system then saves to local orremote directories. All the modules in Hadoop aredesigned with a fundamental assumption that hardwarefailures are commonplace and thus should beautomatically handled in software by the framework.VI.Hadoop:Apache Hadoop is an open source software project thatenables the distributed processing of large data sets acrossclusters of commodity servers. It is designed to scale upfrom a single server to thousands of machines, with a veryhigh degree of fault tolerance. Rather than relying onhigh-end hardware, the resiliency of these clusters comesfrom the software’s ability to detect and handle failures atthe application layer.WORKING MODELThe source of data for this project is twitter people tweetabout cricket in this site the input data may be in manydifferent format the data may contain negative as well aspositive comments there may be some unwanted dataregarding cricket .These data are retrieved with the help ofbig data tools like flume. Flume is nothing but aframework for populating hadoop with data agent arepopulated throughout ones it infrastructure- inside webservers, application servers and mobile devices forexample-to collect data and integrate it into hadoop.Flume collects aggregates and transfers data fromapplications to hdfs. It's java-based, robust and faulttolerant.( Operating system: windows, linux, os x).IJSERApache Hadoop has two pillars: YARN: Yet anotherresource negoThe data once extracted is stored in hdfs server in theform of data nodes .Map and reduce process takes place ineach data node.HDFS: HDFS stores large files (typically in the range ofgigabytes to terabytes across multiple machines). AnAdvantage of using HDFS is data awareness between thejob tracker and task tracker. The job tracker schedulesmap r reduce job to task trackers with an awareness of thedata re that performs filtering and sorting anda Reduce() procedure that performs a summary operation.It s a software framework that serves as the computerlayer of hadoop MapReduce jobs are divided into twoparts. Jobs are divides into two parts they are: TheIJSER 2015http://www.ijser.org
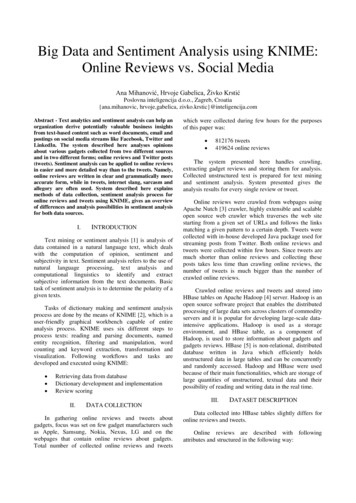
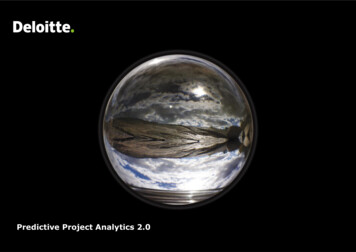
International Journal of Scientific & Engineering Research, Volume 6, Issue 10, October-2015ISSN 2229-5518“Reduce “function aggregates the result of the “Map”function to determine the “answer” to the query. The“Map” function divides a query into multiple parts andprocesses data at the node level.stored in a simple (key-len, key, value-len, value) format.Applications can control if, and how, the intermediateoutputs are to be compressed and the CompressionCodec to be used via the Job Conf.The Map and Reduce functions of Map Reduce are bothdefined with respect to data structured in (key, value)pairs. Map takes one pair of data with a type in one datadomine, and returns a list of pairs in a different domain:Reducer reduces a set of intermediate values which sharea key to a smaller set of values. The number of reduces forthe job is set by the user via Jon Conf. set Num ReduceTasks (int). Overall Reducer implementations are passedthe Job conf for the job via the Job Configurable,configure (Job Conf) method and can override it toinitialize them.Map(k1,v1) list(k2,v2)The Map function is appliezd in parallel to every pair inthe input dataset. This produces a list of pairs for eachcall. After that, the MapReduce framework collects allpairs with the same key from all lists and groups themtogether; creating one group for each key.The Reducefunction is then applied in parallel to each group, which inturn produces a collection of values in the same domain:The frame word then calls reduce (writable Comparable,Iterator, Output Collector, Reporter) method for each key, (list of values) pair in the grouped inputs.Applications can then override the Closablele.close() method to perform any required cleanup.ShuffleReduce(k2, list (v2)) list(v3)Each Reduce call typically produces either one value v3 oran empty return, though one call is allowed to return morethan one value. The returns of all calls are collected as thedesired result list. Thus the Map Reduce frameworktransforms a list of (key, value) pairs into a list of values.Input to the Reducer is the sorted output of the mappers.In this phase the framework fetches the relevant partitionof the output of all the mappers, via HTTP.IJSERMapper maps input key/value pairs to a set ofintermediate key/value pairs .Maps are the individualtasks that transform input records into intermediaterecords. The transformed intermediate records do not needto be of the same type as the input records.A given input pair may map to zero or many output pairs.Mapper implementations are passed the Job Conf for thejob via the method and override it to initialize themselvesthe framework then calls for each key/value pair inthe Input Split for that task. Applications can thenoverride theCloseable. Close() method to perform anyrequired cleanup.Applications can use the Reporter to report progress, setapplication-level status messages and update Counters, orjust indicate that they are alive. All intermediate valuesassociated with a given output key are subsequentlygrouped by the framework, and passed to the Reducer(s)to determine the final output. Mapper outputs are sortedand then partitioned per Reducer. The total number ofpartitions is the same as the number of reduce tasks for thejob. Users can control which keys (and hence records) goto which Reducer by implementing a custom Practitioner.User can optionally specify a combiner, via Job Conf. SetCombiner Class (Class) to perform local aggregation ofthe intermediate outputs which helps to cut down theamount of data transferred from the Mapper tothe Reducer. The intermediate, sorted outputs are alwaysSortThe framework groups Reducer inputs by keys (sincedifferent mappers may have output the same key) in thisstage. The shuffle and sort phases occur simultaneously;while map-outputs are being fetched they are merged.Secondary SortIf equivalence rules for grouping the intermediate keys arerequired to be different from those for grouping keysbefore reduction, then one may specify a comparator viathe command Jobconf. Set Output Value GroupingComparator (class).Visualizing Output-R ToolThe output generated from the above process is in thenumeric form to view the output in the form of graph RTool is used. The output generated in HDFS is given asinput to the R Tool using R programming language. Thistool generates graphical representation of above generatedresult .The below diagram shows the sample of thegenerated output.IJSER 2015http://www.ijser.org82
International Journal of Scientific & Engineering Research, Volume 6, Issue 10, October-2015ISSN 2229-5518VII. CONCLUSIONThe live data consideration for analysis enables us to comeout with more accurate results. The future scope may extentto inclusive of all the sports such as football, baseball, etc.An hybrid programing can be incorporated.REFERENCES[1] Mosteller F & Tukey J W (1977). Data analysis and regression.Menlo Park, CA: Addison -Wesley.[2] Oren, Etzioni, Rattapoom, Tuchinda, Craig, A. Knoblock,& Alexander, Yates (2003). To buy or not to buy: Mining airfare data tominimize ticket purchase price KDD 2003 (pp. 119–128).[3] Resnick, P., & Varian, H. R. (1997). Recommender systems.Communications of ACM, 40(3), C56–C58.[4] Schafer J B, Konstan, J. A., & Riedl, J. (1999) Recommender systemsin E-Commerce. Proceedings of the first ACM conference onelectronic commerce, Denver, CO (pp. 158–166).[5] Shah, H. S., Joshi, N. R., Sureka, A.&Wurman, P. R. (2003). Miningfor bidding strategies on ebay. In Lecture notes in artificial intelligenceSpringer.[6] Wellman, M. P., Reeves, D. M., Lochner, K. M., & Vorobeychik, Y.(2002). Price prediction in a trading agent competition.IJSERIJSER 2015http://www.ijser.org83
proactive, big analytics cannot be performed on big data because traditional storage environments and processing times cannot keep up. Proactive – big data analytics. By . using big data