Transcription
Data Analytics - OverviewPresented by Shriranga Kulkarni .com/in/shrirangakulkarni1
What is Data Analytics?Analytics is the use of:data,information technology,statistical analysis,quantitative methods, andmathematical or computer-based modelsto help managers gain improved insight about their business operations andmake better, fact-based decisions.Business Analytics (BI) is a subset of Data Analytics1-2
What is Business Analytics?Business Analytics Applications Management of customer relationships Financial and marketing activities Supply chain management Human resource planning Pricing decisions Sport team game strategies1-3
What is Business Analytics?Importance of Business Analytics There is a strong relationship of BA with:- profitability of businesses- revenue of businesses- shareholder return BA enhances understanding of data BA is vital for businesses to remain competitive BA enables creation of informative reports1-4
Scope of Business Analytics Descriptive analytics- uses data to understand past and present Predictive analytics- analyzes past performance Prescriptive analytics- uses optimization techniques1-5
Scope of Business AnalyticsRetail Markdown Decisions Most department stores clear seasonal inventory by reducing prices.The question is:When to reduce the price and by how much? Descriptive analytics: examine historical data for similar products (prices,units sold, advertising, ) Predictive analytics: predict sales based on price Prescriptive analytics: find the best sets of pricing and advertising tomaximize sales revenue1-6
Data for Business Analytics DATA- collected facts and figures DATABASE- collection of computer files containing data INFORMATION- comes from analyzing data1-7
Data for Business Analytics Metrics are used to quantify performance. Measures are numerical values of metrics. Discrete metrics involve counting- on time or not on time- number or proportion of on time deliveries Continuous metrics are measured on a continuum- delivery time- package weight- purchase price1-8
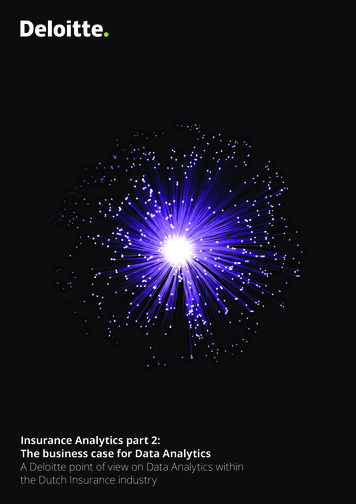
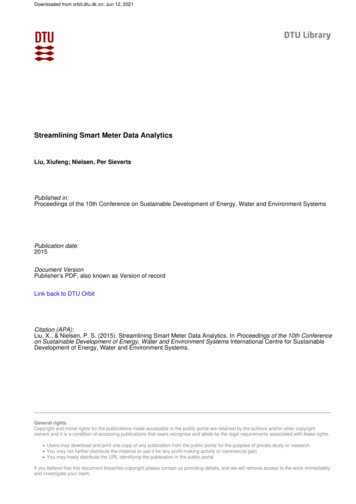
Data for Business AnalyticsA Sales Transaction Database FileRecordsFigure 1.1EntitiesFields or Attributes1-9
What is Big Data? Information from multiple internal and external sources: Transactions Social media Enterprise content Sensors Mobile devices Companies leverage data to adapt products and services to: Meet customer needs Optimize operations Optimize infrastructure Find new sources of revenue Can reveal more patterns and anomalies
Types of Data
When collecting or gathering data we collect data fromindividuals cases on particular variables. A variable is a unit of data collection whose value can vary. Variables can be defined into types according to the level ofmathematical scaling that can be carried out on the data. There are four types of data or levels of measurement:1. Categorical(Nominal)2. Ordinal3. Interval4. Ratio
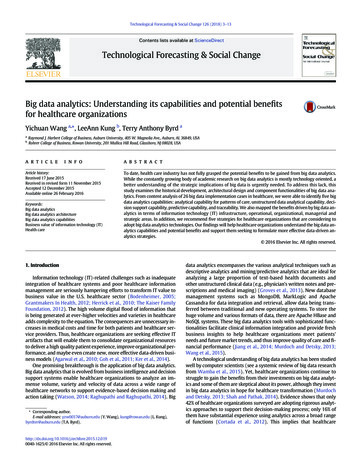
Data for Business AnalyticsClassifying Data Elements in a Purchasing DatabaseFigure 1.21-13
Data for Business Analytics(continued)Classifying Data Elements in a Purchasing DatabaseFigure 1.21-14
Categorical (Nominal) data Nominal or categorical data is data that comprises of categories that cannot berank ordered – each category is just different. The categories available cannot be placed in any order and no judgement can bemade about the relative size or distance from one category to another. Categories bear no quantitative relationship to one another Examples:- customer’s location (America, Europe, Asia)- employee classification (manager, supervisor,associate) What does this mean? No mathematical operations can be performed on the datarelative to each other. Therefore, nominal data reflect qualitative differences rather than quantitativeones.
Nominal dataExamples:What is yourgender? (please tick)Did you enjoy thefilm? (please tick)MaleYesFemaleNo
Nominal data Systems for measuring nominal data must ensure that eachcategory is mutually exclusive and the system ofmeasurement needs to be exhaustive. Variables that have only two responses i.e. Yes or No,are known as dichotomies.
Ordinal data Ordinal data is data that comprises of categories that can be rank ordered. Similarly with nominal data the distance between each category cannot becalculated but the categories can be ranked above or below each other. No fixed units of measurement Examples:- college football rankings- survey responses(poor, average, good, very good, excellent) What does this mean? Can make statistical judgements and perform limitedmaths.
Ordinal dataExample:How satisfied are you with thelevel of service you have received?(please tick)Very satisfiedSomewhat satisfiedNeutralSomewhat dissatisfiedVery dissatisfied
Interval and ratio data Both interval and ratio data are examples of scale data. Scale data: data is in numeric format ( 50, 100, 150) data that can be measured on a continuous scale the distance between each can be observed and as a result measured the data can be placed in rank order.
Interval data Ordinal data but with constant differencesbetween observations Ratios are not meaningful Examples: Time – moves along a continuous measure orseconds, minutes and so on and is without a zeropoint of time. Temperature – moves along a continuous measureof degrees and is without a true zero. SAT scores
Ratio data Ratio data measured on a continuous scale and doeshave a natural zero point. Ratios are meaningful Examples: monthly sales delivery times Weight Height Age
Types of Analytics
Decision ModelsModel: An abstraction or representation of a real system, idea, or object Captures the most important features Can be a written or verbal description, a visual display, a mathematicalformula, or a spreadsheet representation
Decision ModelsFigure 1.3
Decision Models A decision model is a model used to understand, analyze, or facilitatedecision making. Types of model input- data- uncontrollable variables- decision variables (controllable)
Decision ModelsDescriptive Decision Models Simply tell “what is” and describe relationships Do not tell managers what to doAn Influence Diagram for Total Cost
Descriptive Analytics Descriptive analytics, such as reporting/OLAP, dashboards, anddata visualization, have been widely used for some time. They are the core of traditional BI.What has occurred?Descriptive analytics, such as data visualization, isimportant in helping users interpret the output frompredictive and predictive analytics.
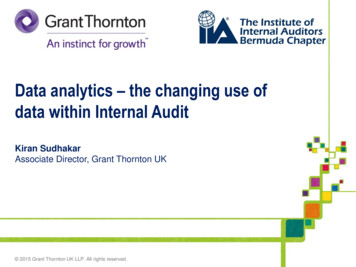
Decision ModelsA Break-even Decision ModelTC(manufacturing) 50,000 125*QTC(outsourcing) 175*QBreakeven Point:Set TC(manufacturing) TC(outsourcing)Solve for Q 1000 unitsFigure 1.7
Decision Models Predictive Decision Models often incorporate uncertainty to help managersanalyze risk. Aim to predict what will happen in the future. Uncertainty is imperfect knowledge of what will happen in the future. Risk is associated with the consequences of what actually happens.1-30
Predictive Analytics Algorithms for predictive analytics, such as regression analysis, machinelearning, and neural networks, have also been around for some time. Prescriptive analytics are often referred to as advanced analytics.What will occur? Marketing is the target for many predictive analytics applications. Descriptive analytics, such as data visualization, is important in helpingusers interpret the output from predictive and prescriptive analytics.
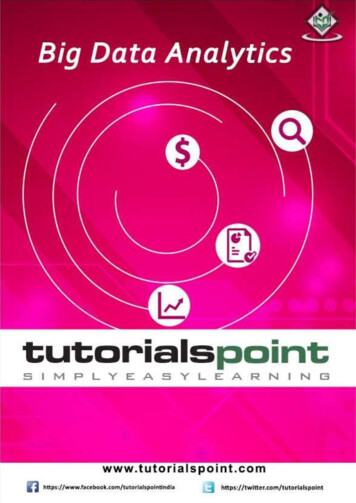
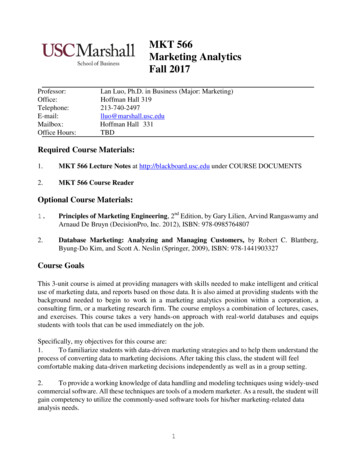
Decision ModelsA Linear Demand Prediction ModelAs price increases, demand falls.Figure 1.81-32
Decision ModelsA Nonlinear Demand Prediction ModelAssumes price elasticity (constant ratio of % changein demand to % change in price)Figure 1.91-33
Decision ModelsPrescriptive Decision Models help decision makers identify the best solution. Optimization - finding values of decision variables that minimize (ormaximize) something such as cost (or profit). Objective function - the equation that minimizes (or maximizes) the quantityof interest. Constraints - limitations or restrictions. Optimal solution - values of the decision variables at the minimum (ormaximum) point.1-34
Prescriptive Analytics Prescriptive analytics are often referred to as advanced analytics. Regression analysis, machine learning, and neural networks Often for the allocation of scarce resourcesWhat should occur? For example, the use of mathematical programming for revenue management is common fororganizations that have “perishable” goods (e.g., rental cars, hotel rooms, airline seats). Harrah’s has been using revenue management for hotel room pricing for some time.
Organizational Transformation Brought about by opportunity ornecessity The firm adopts a new business modelenabled by analytics Analytics are a competitiverequirement
2013 Academic Research A 2011 TDWI report on Big Data Analytics found that85% of respondents indicated that their firms wouldbe using advanced analytics within three years A 2011 IBM/MIT Sloan Management Reviewresearch study found that top performingcompanies in their industry are much more likelyto use analytics rather than intuition across thewidest range of possible decisions.
Conditions that Lead to Analytics-basedOrganizations The nature of the industry Seizing an opportunity Responding to a problem
Complex Systems Tackle complex problems and provide individualized solutions Products and services are organized around the needs of individual customers Dollar value of interactions with each customer is high There is considerable interaction with each customer Examples: IBM, World Bank, Halliburton
Volume Operations Serves high-volume markets through standardized products and services Each customer interaction has a low dollar value Customer interactions are generally conducted through technology rather than person-to-person Are likely to be analytics-based Examples: Amazon.com, eBay, Hertz
The Nature of the Industry: Online RetailersBI Applications Analysis of clickstream data Customer profitability analysisCustomer segmentation analysisProduct recommendationsCampaign managementPricingForecasting Dashboards
The Nature of theIndustry Online retailers like Amazon.com and Overstock.com are highvolume operations who rely on analytics to compete. When you enter their sites a cookie is placed on your PC and allclicks are recorded. Based on your clicks and any search terms, recommendationengines decide what products to display. After you purchase an item, they have additional informationthat is used in marketing campaigns. Customer segmentation analysis is used in deciding whatpromotions to send you. How profitable you are influences how the customer care centertreats you. A pricing team helps set prices and decides what prices areneeded to clear out merchandise. Forecasting models are used to decide how many items toorder for inventory. Dashboards monitor all aspects of organizational performance
Predictive Analytics What will occur? Marketing is the target for many predictive analytics applications. Descriptive analytics, such as data visualization, is important in helping users interpret the output from predictive and prescriptive analytics. Algorithms for predictive