Transcription
Chapter 6 Predictive Maintenance Technologies6.1 IntroductionPredictive maintenance attempts to detect the onset of a degradation mechanism with the goalof correcting that degradation prior to significant deterioration in the component or equipment. Thediagnostic capabilities of predictive maintenance technologies have increased in recent years withadvances made in sensor technologies. These advances, breakthroughs in component sensitivities,size reductions, and most importantly, cost, have opened up an entirely new area of diagnostics to theO&M practitioner.As with the introduction of any new technology, proper application and TRAINING is ofcritical importance. This need is particularly true in the field of predictive maintenance technologythat has become increasingly sophisticated and technology-driven. Most industry experts wouldagree (as well as most reputable equipment vendors) that this equipment should not be purchasedfor in-house use if there is not a serious commitment to proper implementation, operator training,and equipment monitoring and repair. If such a commitment cannot be made, a site is well advisedto seek other methods of program implementation—a preferable option may be to contract for theseservices with an outside vendor and rely on their equipment and expertise.Table 6.1.1 below highlights typical applications for some of the more common predictivemaintenance technologies. Of course, proper application begins with system knowledge andpredictive technology capability – before any of these technologies are applied to live systems.Vibration Monitoring/AnalysisXXXXLubricant, Fuel AnalysisXXXXWear Particle AnalysisXXXXBearing, Temperature/AnalysisXXXXPerformance MonitoringXXXXXXUltrasonic Noise DetectionXXXXXXXUltrasonic FlowXXXXInfrared ThermographyXXXNon-destructive Testing (Thickness)Visual InspectionXXXXXXXXXInsulation ResistanceXXMotor Current Signature AnalysisXMotor Circuit AnalysisXPolarization IndexXElectrical MonitoringO&M Best Practices Guide, Release 3.0XXXXXXXTanks, PipingTransformersElectrical SystemsHeat ExchangersValvesCircuit BreakersHeavy Equipment/CranesCondensersDiesel GeneratorsElectric MotorsPumpsTechnologiesApplicationsTable 6.1.1. Common predictive technology applications (NASA 2000)XXXXXXXXXXXXXXX6.1
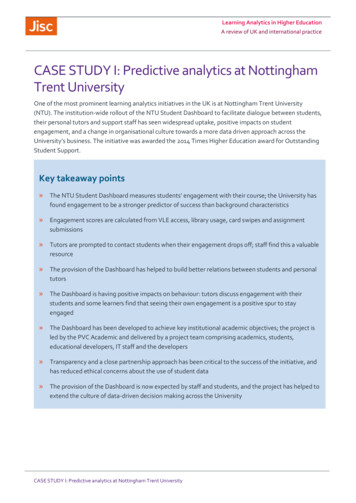
Predictive Maintenance Technologies6.2 Thermography6.2.1 IntroductionInfrared (IR) thermography can be defined as the process of generating visual images that represent variations in IR radiance of surfaces of objects. Similar to the way objects of different materialsand colors absorb and reflect electromagnetic radiation in the visible light spectrum (0.4 to 0.7 microns),any object at temperatures greater than absolute zero emits IR energy (radiation) proportional toits existing temperature. The IR radiation spectrum is generally agreed to exist between 2.0 and15 microns. By using an instrument that contains detectors sensitive to IR electromagnetic radiation,a two-dimensional visual image reflective of the IR radiance from the surface of an object can begenerated. Even though the detectors and electronics are different, the process itself is similar to thata video camera uses to detect a scene reflecting electromagnetic energy in the visible light spectrum,interpreting that information, and displaying what it detects on a liquid crystal display (LCD) screenthat can then be viewed by the device operator.Because IR radiation falls outside that of visible light (the radiation spectrum to which our eyesare sensitive), it is invisible to the naked eye. An IR camera or similar device allows us to escape thevisible light spectrum and view an object based on its temperature and its proportional emittanceof IR radiation. How and why is this ability to detect and visualize an object’s temperature profileimportant in maintaining systems or components? Like all predictive maintenance technologies,IR tries to detect the presence of conditions or stressors that act to decrease a component’s useful ordesign life. Many of these conditions result in changes to a component’s temperature. For example,a loose or corroded electrical connection results in abnormally elevated connection temperaturesdue to increased electrical resistance. Before the connection is hot enough to result in equipmentfailure or possible fire, the patterns are easily seen through an IR imaging camera, the conditionidentified and corrected. Rotating equipment problems will normally result in some form of frictionalchange that will be seen as an increase in the component’s temperature. Faulty or complete loss ofrefractory material will be readily seen as a change in the components thermal profile. Loss of a roof’smembrane integrity will result in moisture that can be readily detected as differences in the roofthermal profile. These are just a few general examples of the hundreds of possible applications of thistechnology and how it might be used to detect problems that would otherwise go unnoticed until acomponent failed and resulted in excessive repair or downtime cost.6.2.2 Types of EquipmentMany types of IR detection devices exist, varying incapability, design, and cost. In addition, simple temperaturemeasurement devices that detect IR emissions but do notproduce a visual image or IR profile are also manufactured.The following text and pictures provide an overview of eachgeneral instrument type.Spot Radiometer (Infrared Thermometer) – Althoughnot generally thought of in the world of thermography,IR thermometers use the same basic principles as higherend equipment to define an object’s temperature based onFigure 6.2.1. Typical IR spot thermometerIR emissions. These devices do not provide any imagerepresentative of an object’s thermal profile, but rather a valuerepresentative of the temperature of the object or area of interest.6.2O&M Best Practices Guide, Release 3.0
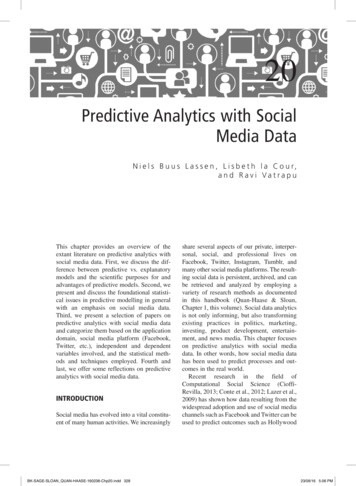
Predictive Maintenance TechnologiesInfrared Imager – As indicated earlier, equipment capabilities,design, cost, and functionality vary greatly. Differences exist in IRdetector material, operation, and design. At the fundamental level,IR detection devices can be broken down into two main groups –imagers and cameras with radiometric capability. A simple IRimager has the ability to detect an object’s IR emissions andtranslate this information into a visual image. It does not have thecapability to analyze and quantify specific temperature values. Thistype of IR detection device can be of use when temperature valuesFigure 6.2.2. Internal house wall.are unimportant and the object’s temperature profile (representedNote dark area indicating coolerby the image) is all that is needed to define a problem. An example temperatures because of heat loss.of such an application would be in detecting missing or inadequateinsulation in a structure’s envelope. Such an application merely requires an image representative ofthe differences in the thermal profile due to absence of adequate insulation. Exact temperature valuesare unimportant.IR cameras with full radiometric capability detect the IR emissions from an object and translatethis information into a visible format as in the case of an imager. In addition, these devices have thecapability to analyze the image and provide a temperature value corresponding to the area of interest.This capability is useful in applications where a temperature value is important in defining a problemor condition. For example, if an image indicated a difference between a pulley belt temperatureand an ambient temperature, the belt may have worn, be the wrong size, or indicate a misalignmentcondition. Knowing the approximate temperature differences would be important in determining ifa problem existed.Figure 6.2.3. Temperature is used in defining belt problems. Figure shows a belt temperature of149 F, and ambient temperature of 67 F for a difference of 82 F. The difference should be trendedover time to determine slippage that would be indicated by a higher temperature difference.O&M Best Practices Guide, Release 3.06.3
Predictive Maintenance Technologies6.2.3 System Applications6.2.3.1 Electrical System ApplicationsThe primary value of thermographic inspections of electrical systems is locating problems sothat they can be diagnosed and repaired. “How hot is it?” is usually of far less importance. Once theproblem is located, thermography and other test methods, as well as experience and common sense,are used to diagnose the nature of the problem. The following list contains just a few of the possibleelectrical system-related survey applications: Transmission lines- Splices- Shoes/end bells Inductive heating problems- Insulators Cracked or damaged/tracking Distribution lines/systems- Splices- Line clamps- Disconnects- Oil switches/breakers- Capacitors- Pole-mounted transformers- Lightning arrestors- Imbalances Substations- Disconnects, cutouts, air switches- Oil-filled switches/breakers (external andinternal faults)- Capacitors- Transformers Internal problems Bushings Oil levels Cooling tubes Lightning arrestors- Bus connections Generator Facilities- Generator Bearings Brushes Windings Coolant/oil lines: blockage- Motors Connections Bearings Winding/cooling patterns Motor Control Center Imbalances6.4 In-Plant Electrical Systems- Switchgear- Motor Control Center- Bus- Cable trays- Batteries and charging circuits- Power/Lighting distribution panelsSoftware analysis tools can quantify and graphicallydisplay temperature data. As shown above, the middleconductor/connection is a much higher temperatureindicating a loose connection.O&M Best Practices Guide, Release 3.0
Predictive Maintenance TechnologiesFigure 6.2.4. Air breaker problem. Highlighted by temperature differencebetween two different breakers. Likely caused by poor connection.Figure 6.2.5. Overloaded contacts show different temperature profiles indicatingone contact seeing much greater load, a potentially unsafe situation.6.2.3.2 Mechanical System ApplicationsRotating equipment applications are only a small subset of the possible areas where thermographycan be used in a mechanical predictive maintenance program. In addition to the ability to detectproblems associated with bearing failure, alignment, balance, and looseness, thermography can beused to define many temperature profiles indicative of equipment operational faults or failure. Thefollowing list provides a few application examples and is not all inclusive: Steam Systems- Boilers Refractory Tubes- Traps- Valves- Lines Heaters and furnaces- Refractory inspections- Tube restrictions Fluids- Vessel levels- Pipeline blockagesO&M Best Practices Guide, Release 3.0 Environmental- Water discharge patterns- Air discharge patterns Motors and rotating equipment- Bearings Mechanical failure Improper lubrication- Coupling and alignment problems- Electrical connections on motors- Air cooling of motors6.5
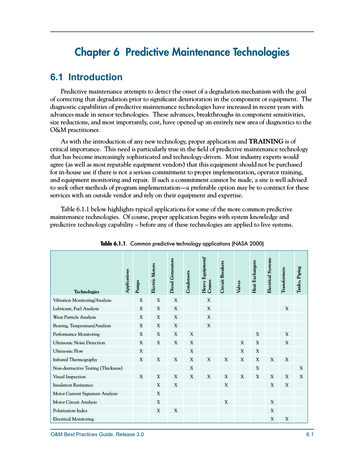
Predictive Maintenance TechnologiesFigure 6.2.6. IR scans of multiple electric motors can highlight those with hotbearings indicting an imbalance or wear problem.Figure 6.2.7. Possible gearbox problem indicated by white area defined byarrow. Design drawings of gearbox should be examined to define possible causeof elevated temperatures.Figure 6.2.8. Seized conveyer belt roller as indicated by elevated temperatures inbelt/roller contact area.Figure 6.2.9. Inoperable steam heaters seen by cooler blue areas when comparedto the operating heaters warmer red or orange colors.6.6O&M Best Practices Guide, Release 3.0
Predictive Maintenance TechnologiesFigure 6.2.10. IR scans of boiler can highlight those areas where the refractoryhas broken down leading to costly heat loss.Figure 6.2.11. When trended, IR scans of single bearings provide a useful indicator ofwear and eventual need for replacement.Figure 6.2.12. Steam or hot water distribution systemleaks and/or underground line location can bedefined with IR.O&M Best Practices Guide, Release 3.06.7
Predictive Maintenance TechnologiesThese images show elevatedtemperatures of roof insulationdue to difference in thermalcapacitance of moisture-ladeninsulation.IR thermography is a powerful tool forlocating roof leaks. As shown in the images,lighter colored regions indicate areas ofpotential leakage.6.2.3.3 Roof ThermographyThe old adage “out of sight, out of mind” is particularly true when it applies to flat roofmaintenance. We generally forget about the roof until it leaks on our computers, switchgear, tables,etc. Roof replacement can be very expensive and at a standard industrial complex easily run into thehundreds of thousands of dollars. Depending on construction, length of time the roof has leaked, etc.,actual building structural components can be damaged from inleakage and years of neglect that driveup repair cost further. Utilization of thermography to detect loss of a flat roof’s membrane integrityis an application that can provide substantial return by minimizing area of repair/replacement. Roofreconditioning cost can be expected to run less than half of new roof cost per square foot. Add to thisthe savings to be gained from reconditioning a small percentage of the total roof surface, instead ofreplacement of the total roof, and the savings can easily pay for roof surveys and occasional repair forthe life of the building with change left over.6.2.4 Equipment Cost/PaybackAs indicated earlier, the cost of thermography equipment varies widely depending on the capabilities of the equipment. A simple spot radiometer can cost from 500 to 2,500. An IR imager without radiometric capability can range from 7,000 to 20,000. A camera with full functionality cancost from 18,000 to 65,000. Besides the camera hardware, other program costs are involved.6.8O&M Best Practices Guide, Release 3.0
Predictive Maintenance TechnologiesComputer hardware, personnel training, manpower, etc., needs to be accounted for in the budget.Below is a listing of equipment and program nee
Predictive maintenance attempts to detect the onset of a degradation mechanism with the goal of correcting that degradation prior to signiicant deterioration in the component or equipment. The diagnostic capabilities of predictive maintenance technologies have increased in recent years with advances made in sensor technologies. These advances, breakthroughs in component sensitivities,