Transcription
View metadata, citation and similar papers at core.ac.ukbrought to you byCOREprovided by Elsevier - Publisher ConnectorInternational Journal of Sustainable Built Environment (2015) 4, 117–124H O S T E D BYGulf Organisation for Research and DevelopmentInternational Journal of Sustainable Built nal Article/ResearchMonitoring urban growth and land use change detection with GISand remote sensing techniques in Daqahlia governorate EgyptIbrahim Rizk Hegazy a, , Mosbeh Rashed Kaloop bbaDepartment of Architecture, Faculty of Engineering, Mansoura University, Mansoura, EgyptDepartment of Public Works Engineering, Faculty of Engineering, Mansoura University, Mansoura, EgyptReceived 28 September 2014; accepted 13 February 2015AbstractUrban growth is a worldwide phenomenon but the rate of urbanization is very fast in developing country like Egypt. It is mainlydriven by unorganized expansion, increased immigration, rapidly increasing population. In this context, land use and land cover changeare considered one of the central components in current strategies for managing natural resources and monitoring environmentalchanges. In Egypt, urban growth has brought serious losses of agricultural land and water bodies. Urban growth is responsible for avariety of urban environmental issues like decreased air quality, increased runoff and subsequent flooding, increased local temperature,deterioration of water quality, etc. Egypt possessed a number of fast growing cities. Mansoura and Talkha cities in Daqahlia governorateare expanding rapidly with varying growth rates and patterns. In this context, geospatial technologies and remote sensing methodologyprovide essential tools which can be applied in the analysis of land use change detection. This paper is an attempt to assess the land usechange detection by using GIS in Mansoura and Talkha from 1985 to 2010. Change detection analysis shows that built-up area has beenincreased from 28 to 255 km2 by more than 30% and agricultural land reduced by 33%. Future prediction is done by using the Markovchain analysis. Information on urban growth, land use and land cover change study is very useful to local government and urban planners for the betterment of future plans of sustainable development of the city.Ó 2015 The Gulf Organisation for Research and Development. Production and hosting by Elsevier B.V. All rights reserved.Keywords: Land use/cover; Urban growth; Remote sensing; GIS; Egypt1. IntroductionLand use and land cover change, as one of the maindriving forces of global environmental change, is centralto the sustainable development debate. Land use/land cover change has been reviewed from different perspectives in Corresponding author. Tel.: 20 1016060100.E-mail address: i.hegazy@ymail.com (I.R. Hegazy).Peer-review under responsibility of The Gulf Organisation for Researchand Development.order to identify the drivers of land use/land cover change,their process and consequences. Urban growth, particularly the movement of residential and commercial land torural areas at the periphery of metropolitan areas, has longbeen considered a sign of regional economic vitality.The rapid changes of land use and cover than everbefore, particularly in developing nations, are often characterized by rampant urban sprawling, land degradation, orthe transformation of agricultural land to shrimp farmingensuing enormous cost to the environment (Sankhala andSingh, 2014). This kind of changes profoundly affects 2212-6090/Ó 2015 The Gulf Organisation for Research and Development. Production and hosting by Elsevier B.V. All rights reserved.
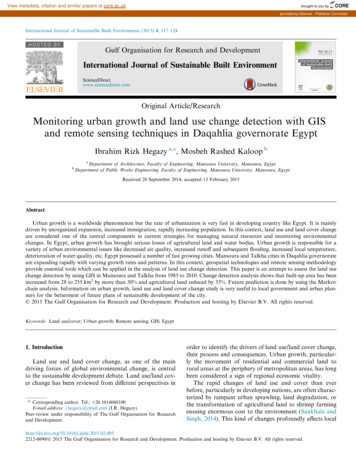
118I.R. Hegazy, M.R. Kaloop / International Journal of Sustainable Built Environment 4 (2015) 117–124Figure 1. Location of study area of Mansoura and Talkha cities.and/or regional environment, which would eventuallyaffect the global environment. Human induced changes inland cover for instance, influence the global carbon cycle,and contribute to the increase in atmospheric CO (Alvesand Skole, 1996). It is therefore indispensable to examinethe changes in land use/cover, so that its effect on terrestrialecosystem can be discerned, and sustainable land use planning can be formulated (Muttitanon and Tripathi, 2005).In Egypt, unprecedented population growth coupledwith unplanned developmental activities has led to urbanization, which lacks infrastructure facilities. This also hasposed serious implications on the resource base of theregion. The urbanization takes place either in radial direction around a well-established city or linearly along thehighways. This dispersed development along highways, orsurrounding the city and in rural countryside is oftenreferred as sprawl. Some of the causes of the sprawl include– population growth, economy and proximity to resourcesand basic amenities.National ministry of agriculture estimated that due tourban growth on agricultural lands, the agricultural land lossduring the period 1980–2000, of not exceeding 25,000 feddan(26.25 thousand acres) yearly (Belal and Moghanm, 2011).Daqahlia governorate in the middle of the Nile Delta is oneof the major agricultural governorates. Its agricultural landsare estimated by 650 thousand acres that puts it in the thirdplace after Ash-Sharqiyah and Beheira governorates in termsof acreage where its agricultural lands represent 8% of theagricultural lands in the country (ESIS, 2014). Due to urbangrowth, its loss of agricultural land is estimated to be morethan 25% during the period 1980–2010.Urban growth monitoring is the process of studding thedifferences in the state of an object or phenomenon byremotely observing it at different times. Monitoring resultsfrom anthropogenic forces are the result of human modification of the environment (Pilon et al., 1988). In Egypt, remotesensing and its applications have emerged as early as thistechnology was invented (El-Baz et al., 1979); the growthmonitoring has become a major application of remote sensing data and Geographic Information System (GIS).Growth monitoring is the process of determining and/ordescribing changes in land-cover and land-use propertiesbased on co-registered multi-temporal remote sensing data.The basic premise in using remote sensing data for changedetection is that the process can identify change betweentwo or more dates that is uncharacteristic of normal variation. Numerous researchers have addressed the problem ofaccurately monitoring land-cover and land-use change in awide variety of environments (Shalaby and Tateishi, 2007).Usually land uses and urban growth in remote sensinginvolves the analysis of two registered, aerial or satellite multi-spectral bands from the same geographical area obtainedat two different times. Such an analysis aims at identifyingchanges that have occurred in the same geographical areabetween the two times considered (Radke et al., 2005).Satellite remote sensing is a potentially powerful means ofmonitoring land-use change at high temporal resolution andlower costs than those associated with the use of traditionalmethods (El-Raey et al., 1995). Remote sensing data is veryuseful because of its synoptic view, repetitive coverage andreal time data acquisition. The digital data in the form of satellite imageries, therefore, enable to accurately compute various
I.R. Hegazy, M.R. Kaloop / International Journal of Sustainable Built Environment 4 (2015) 117–124119Figure 2. Mansoura and Talkha land use maps in 1985.land cover/land use categories and help in maintaining thespatial data infrastructure which is very essential for monitoring urban expansion and land use studies (Mukherjee, 1987).A GIS is a decision support system that can facilitateurban planning. The use of GIS modeling has become quiteprevalent within the field of urban sprawl research. Someresearch on urban sprawl uses GIS as a tool in understanding the effects of urban sprawl on the natural environment.GIS reveals spatial patterns of urban sprawl by measuringdistances of new urban growth areas from town centersand roads for example (Gar-On Yeh and Xia, 2001).Because urban development is irreversible, GIS simulatesfuture land development (Lee et al., 1998).The aims of the this study are to produce a land use/landcover map for two of the important cities in Daqahlia governorate that experienced a fast increase of urban population in the recent decades (Mansoura and Talkha cities) atdifferent years in order to detect changes that have takenplace particularly in the built-up land and subsequentlyto analyze the urban sprawl of the different time periodsand to predict the urban area growth in the same over agiven period (2010–2035).2. Description of study areaDaqahlia governorate is located at the North East ofNile Delta in Egypt. Geographically, it is located betweenlongitudes 30 and 32 E and latitudes 30 500 and31 500 N. The Governorate is bordered by the governorateof Dumyat to north and Ash-Sharqiyah to south, while isaligned by Manzala lack in the east and the governoratesof Kafr El-Shaikh, Gharbia and Menufia in the west (seeFig. 1). Mansoura (the capital of Daqahlia governorate)and Talkha are the most important cities in Daqahlia governorate; the area of investigation covers 670 km2 (159,541feddan). Regionally, the studied area is located in the central Daqahlia governorate and has been chosen because ofthe fast rate of urbanization and little studies were made onit. Urban growth is one of the main problems that reducesthe limited highly fertile land in these cities. In this context,Mansoura and Talkha are experiencing various urban environmental problems. For sustainability of urban systems abalanced land use/land cover is to be planned.3. Data and methodologyThe present study involves the collection of topographicsheets from Survey of Egypt and city map from relevantauthorities. The required satellite imagery for the studyarea is to be downloaded from the USGS EarthExplorer. Processing the imagery and image interpretationfor the development of land use/land cover maps is in donein ERDAS Imagine software. The obtained maps are
120I.R. Hegazy, M.R. Kaloop / International Journal of Sustainable Built Environment 4 (2015) 117–124Figure 3. Mansoura and Talkha land use maps in 2000.studied and analyzed to detect the change in urban sprawl.Future prediction is done based on past data.3.1. Image preprocessingDigital image processing was manipulated by the software used. The scenes were selected to be geometricallycorrected, calibrated, and removed from their dropouts.These data were stratified into ‘zones’, where land covertypes within a zone have similar spectral properties.Other image enhancement techniques like histogram equalization are also performed on each image for improving thequality of the image. With the help of Survey of Egypttopographic-sheets of 1:50,000 and city plan map obtainedfrom Daqahlia governorate headquarter, the study areahas been delineated. The data of ground truth were adapted for each single classifier produced by its spectral signatures for producing series of classification maps.3.2. Classification of imagesThe pre-processed images are then classified by both unsupervised, supervised classification methods. In un-supervised classification method the ISODATA clustering algorithm which is built in the ERDAS Imagine will classifyaccording to the number of classes required and the digitalnumber of the pixels available. In the supervised classification technique the maximum likely hood algorithm willclassify the image based on the training sets (signatures)provided by the user based on his field knowledge. Thetraining data given by the user guides the software as towhat types of pixels are to be selected for certain land covertype. The un-supervised classified image has been used forreference and for understanding about the distribution ofpixels with different digital numbers. The classificationfinally gives the land use/land cover image of the area.Four land cover classes namely agricultural land, built uparea, barren land and water bodies are identified in thestudy area.3.3. Land use and land coverThere is no doubt that human activities have profoundlychanged land cover in the two cities during the past threedecades. Land is one of the most important naturalresources. All agricultural, animal productions depend onthe productivity of the land. The entire eco-system of theland, which comprises of soil, water and plant, meets thecommunity demand for food, energy and other needs oflivelihood. Viewing the Earth from space is now crucial to
I.R. Hegazy, M.R. Kaloop / International Journal of Sustainable Built Environment 4 (2015) 117–124121Figure 4. Mansoura and Talkha land use maps in 2010.Table 1Change detection in Mansoura and Talkha cities.Map unitArea 19852AgricultureBuilt upBarren landWaterTotal areaArea 20002Area .9100the understanding of the influence of man’s activities on hisnatural resource base over time. In situations of rapid andoften undocumented and unrecorded land use change,observations of the Earth from space provide objectiveinformation of human activities and utilization of the landscape. The classified images provide all the information tounderstand the land use and land cover of the study area.changes that are taking place in the span of data. This analysis is very much helpful to identify various changes occurring in different classes of land use like increase in urbanbuilt-up area or decrease in agricultural land and so on.4. Results and discussion4.1. Land use/land cover images3.4. Change detection analysisChange detection analyses describe and quantify differences between images of the same scene at different times.The classified images of the three dates can be used to calculate the area of different land covers and observe theThe classified images obtained after pre-processing andsupervised classification which are showing the land useand land cover of the study area are given in Figs. 2–4.These images provide the information about the land usepattern of the study area. The red color represents the
122I.R. Hegazy, M.R. Kaloop / International Journal of Sustainable Built Environment 4 (2015) 117–124Figure 5. Land cover for Mansoura and Talkha in 1985, 2000 and 2010.Change area1985/2000Change area2000/2010Change rate %urban built-up area, dark green color shows the agricultural area, blue color shows the water bodies and light browncolor shows the barren land.km2Feddankm2Feddan1985/20002000/20104.2. Classification accuracy assessment 22 19 30 5239 4525 7140 206 196 13 3 49,053 46,671 3096 714 3.28 2.83 0.450 30.74 29.25 1.94 0.45Table 2Urban growth rate in Mansoura and Talkha cities.Map unitAgricultureBuilt upBarren landWaterTable 3Post classification matrix of study area from 1985 to rTotal140,0154265974Builtup066670AgricultureBuilt upBarrenlandWaterTotal 906159,541Table 4Post classification matrix of study area from 2000 to uilt upBarrenlandWaterTotal 9066191159,541Each of the land use and land cover map was comparedto the reference data to assess the accuracy of the classification. The reference data were prepared by considering random sample points, the field knowledge and Google earth.During the field visits a hand held GPS (Global PositioningSystem) is used to identify the exact position of the placeunder consideration with latitude and longitude and itstype by visual observation. The ground truth data soobtained was used to verify the classification accuracy.Over all classification accuracy of Mansoura city for theyears 1985, 2000 and 2010 are 86.67%, 84% and 85.2%respectively. For Talkha city for the years 1985, 2000 and2010 are 77%, 81% and 85% respectively.4.3. Change detection analysisThe dominant causative factors of the different types ofland degradation were identified in the field and also collected from the available technical reports. The main typeof human induced land degradation in the investigatedareas is urbanization. These degradation variables wereassessed showing the changes that occurred during the period of 1985 and 2010 for human induced land degradationusing multi-dates satellite images (Table 1 and Fig. 5).It can be seen that the total investigated area was determined by 670 km2 (159,541 feddan). In the year 1985, builtup area covered 28 km2 (6667 feddan) and barren land covered 3 km2 (417 feddan), while the cultivated one covered
I.R. Hegazy, M.R. Kaloop / International Journal of Sustainable Built Environment 4 (2015) 117–124123Table 5Transitional probability matrix derived from the land use/land cover mapof 2000–2010.ClassAgricultureBuilt upBarren landWaterAgricultureBuilt upBarren landWater00000.929110.766100.070800.233910000Table 6Land use statistic of the study area, 2010–2035.2035Figure 6. Predicted land cover for Mansoura and Talkha in 2035.Year2010Change rate2010–2035Land use typeFeddan%Feddan%Feddan%AgricultureBuilt upBarren 92783,51714,599249836.9352.349.151.58 32,036 25,654 10,075 3693 20.1 16.1 6.31 2.31Total159,541100159,54110000610 km2 (145,254 feddan). In the year 2000, extra built uparea covered 47 km2 (11,192 feddan) as 7.02% of the totalarea and barren land was doubled, while the cultivated areadecreased by 22 km2 (5239 feddan) as 3.28% of the totalarea. In the year 2010, built up area is dramaticallyincreased, more than 5 times, to cover 243 km2 (57,863 feddan) as 36.3% of the total area, this is the case of barrenland which increased more than 3 times to cover 19 km2(4524 feddan), while the cultivated area decreased intenselyby 206 km2 (49,053 feddan) as 30.7% of the total area.Water bodies decreased by 3 km2 (714 feddan) as 0.45%of the total area (see Table 2).4.4. Markov results4.4.1. Post classification matrixCross tabulation is a means to determine quantities ofconversions from a particular land cover to another landcover category at a later date. The change matrices basedon post classification comparison were obtained and areshown in Tables 3 and 4.The nature of the changes of different land cover classescan be examined in Tables 3 and 4. For example, built uparea covered 6667 feddan in 1985 and 11,192 feddan in2000, while the barren land covered an area of 714 feddanin 1985 and 1428 feddan in 2000. 140,015 feddan of the agricultural area which was vegetation in 1985 was still vegetation cover in 2000, but 4265 feddan had been converted tobuilt up area use and 974 feddan had been converted to barren land by 2000. During the same period, 260 feddan of thebarren lands had been converted to built-up area use by2000. 2.83% was changed to built up area.Similarly change of different land classes into anotherland class for the periods from 2000 to 2010 can beobserved. By 2010, 45,577 feddan of agricultural landsand 1094 feddan of 1428 feddan that were barren in 2000had been converted to built up area use. Moreover,between 2000 and 2010, 3475 feddan that were cultivatablehave been converted to infertile land. During the same period, 715 feddan of water bodies had been converted to barren land to become a total infertile land is 4524 feddan.29.25% was changed to built up area.4.4.2. Transitional probability matrix and future land usestatisticMarkov chain model is essentially a projection modelthat describes the probabilistic movements of an individualin a system comprised of discrete states. When applied toland use, Markov chains often specify both time and a finiteset of states as discrete values. Transitions between thestates of the system are recorded in the form of a transitionmatrix that records the probability of moving from onestate to another (Clark, 1965). Applications of Markovchains to urban land use dynamics began to appear in the1970s as an alternative to the use of large-scale urbansimulations models for land use forecasting (Bell andHinojosa, 1977).Markov model result is a transition matrix which showsthe probability of changes from each class of land cover orland use to each other class in the future. Table 5 is theprobability transition matrix of different land cover typesof the study area. In this research, 1985, 2000 and 2010 landcover maps to predict the 2035 land cover areas. FutureLand Use statistic can be observed in Table 6 and Fig. 6.5. ConclusionIn this work it is mainly highlighted the urban sprawlanalysis of Mansoura and Talkha cities, Daqahlia, Egyptand their environs, using remote sensing and GIS techniques. The entropy method can be easily implementedusing GIS to facilitate the measurement of urban sprawl.The main cause of urbanization is the rapid populationgrowth. This problem needs to be seriously studied, throughmulti-dimensional fields in order to preserve the preciousand limited agricultural lands. Based on this study, the analysis of the results leads to the following findings:- In the year 1985, urbanized area covered 28 km2 (6667feddan), while in the year 2000, extra urbanized areacovered 47 km2 (11,192 feddan) as 6.98% of the total
124I.R. Hegazy, M.R. Kaloop / International Journal of Sustainable Built Environment 4 (2015) 117–124area, while the cultivated area decreased by 3.28% of thetotal area. In addition, the year 2010, urbanized area isdramatically increased, more than 5 times, to cover243 km2 (57,863 feddan) as 36026% of the total area,while the cultivated area decreased intensely by 30.75%of the total area.- Actually, these two cities have no extended area to meetcitizen demands therefore, no other choices to desertificate such very fertile land. The saturation is very criticalsince population growth is expected to double in lessthan 50 year.At the last, it is observed that the urbanization inMansoura and Talkha has increased about 32.08% from1985 to 2010. Future prediction has been done by usingthe Markova chain analysis. It was observed that thefuture urban area may increase of about 16.09% inMansoura and Talkha. The increased urbanization mayhave several impacts on infrastructure, energy use andeconomy of the country.AcknowledgementsWe would like to express my gratitude to Ms. ersity) for her valuable assistance and constructivecomments.ReferencesAlves, D., Skole, D., 1996. Characterizing land cover dynamics usingmulti-temporal imagery. Int. J. Remote Sen. 17 (4), 835–839.Belal, A., Moghanm, F., 2011. Detecting urban growth using remotesensing and GIS techniques in Al Gharbiya governorate, Egypt. Egypt.J. Remote Sen. Space Sci. 14, 73–79.Bell, E., Hinojosa, R., 1977. Markov analysis of land use change:continuous time and stationary processes. Socio-Econ. Plann. Sci. 11,13–17.Clark, W., 1965. Markov chain analysis in geography: an application tothe movement of rental housing areas. Ann. Assoc. Am. Geogr. 55 (2),351–359.Egypt State Information Service [ESIS]. 2014. Local managementDaqahlia governorate. Available on: icles.aspx?ArtID 176#.U7fzEbG gqT ,(last access: 1.07.14).El-Baz, F., Breed, C., Grolier, J., McUauley, J., 1979. Eolian features inthe western desert of Egypt and some applications to Mars. J.Geophys. Res. 84, 8205–8221.El-Raey, M., Nasr, S., El-Hattab, M., Frihy, O., 1995. Change detectionof Rosetta Promontory over the last forty years. Int. J. Remote Sen.16, 825–834.Gar-On Yeh, A., Xia, L., 2001. Measurement and monitoring of urbansprawl in a rapidly growing region using entropy. Photogramm. Eng.Remote Sen. 67 (1), 83–90.Lee, J., Tian, L., Erickson, L., Kulikowski, D., 1998. Analyzing growthmanagement policies with geographical information systems. Environ.Plann. B: Plann. Des. 25 (6), 865–879.Mukherjee, S., 1987. Land use maps for conservation of ecosystems.Geog. Rev. India 3, 23–28.Muttitanon, W., Tripathi, N., 2005. Land use/cover changes in the coastalzone of Bay Don Bay, Tailand using Landset 5 TM data. Int. J.Remote Sen. 26 (11), 2311–2323.Pilon, G., Howarth, J., Bullock, A., 1988. An enhanced classificationapproach to change detection in semi-arid environments.Photogramm. Eng. Remote Sen. 54, 1709–1716.Radke, J., Andra, S., Al-Kofani, O., Roysan, B., 2005. Image changedetection algorithms: a systematic survey. IEEE Trans. Image Process.14 (3), 291–307.Sankhala, S., Singh, B., 2014. Evaluation of urban sprawl and land useland cover change using remote sensing and GIS techniques: a casestudy of Jaipur City, India. Int. J. Emerging Technol. Adv. Eng. 4 (1),66–72.Shalaby, A., Tateishi, R., 2007. Remote sensing and GIS for mapping andmonitoring land-cover and land-use changes in the Northwesterncoastal zone of Egypt. Appl. Geogr. 27, 28–41.
monitoring has become a major application of remote sens-ing data and Geographic Information System (GIS). Growth monitoring is the process of determining and/or describing changes in land-cover and land-use properties based on co-registered multi-temporal remote sensing data. The basic premise