Transcription
Social Education 70(7), pp 398–404, 432 2006 National Council for the Social StudiesResearch and Practice“Research & Practice,” established early in 2001, features educational research that is directly relevantto the work of classroom teachers. Here, I invited geographer Sarah Bednarz and her colleagues tosummarize the research on teaching and learning with maps in the social studies curriculum.—Walter C. Parker, “Research and Practice” Editor, University of Washington, SeattleMaps and Map Learning inSocial StudiesSarah Witham Bednarz, Gillian Acheson, and Robert S. BednarzMaps are not the whole of geography, but there can be no geography withoutthem. In fact, well-known geographers have often defined their subject around mapsand map use. In 1939, Richard Hartshorne stated, “So important is the use of maps ingeographic work that . it seems fair to suggest to the geographer if the problem cannotbe studied fundamentally by maps . then it is questionable whether or not it is withinthe field of geography.”1 Fifty years later Peter Haggett expressed the same sentimenteven more directly and succinctly: “Geography is the art of the mappable.”2Since 1990, the importance of mapsand other graphic representations hasbecome even more important to geography and geographers. This is due, toa large extent, to the development andwidespread diffusion of geographic(spatial) technologies. As computers andsilicon chips have become more capableand less expensive, geographic information systems (GIS), global positioningsatellite (GPS) receivers, and remotelysensed images of Earth from airplanesand satellites have become accessible togeography students and faculty at all levels. These technologies are key researchand communication tools for geographersand have significantly increased interest in geography as evidenced by risingenrollments in university undergraduateand graduate programs.3 Another indication of the growing importance of mapsis a rising interest among geographers,psychologists, and cognitive scientists inspatial thinking, the kind of thinking thatunderpins map reading and interpretation. Spatial thinking is the knowledge,skills, and habits of mind to use spatialconcepts, maps and graphs, and processes of reasoning in order to organizeand solve problems. 4Of course geospatial technologies andtheir products are available to studentsand faculty in all disciplines, and theyhave become ever more common in thedaily lives of more and more people. Infact, one can argue that the ability to usemaps, images, and spatial technologiesintelligently and critically is becominga requirement to participate effectivelyas a citizen in modern society. Considerthese four developments:1. Travelers, hikers, hunters, and fishersfrequently use GPS systems to find theirlocations and to assist them in gettingto their destination. These systems areS o c i a l E d u c at i o n398also becoming more common in automobiles.2. Google, the most popular internetsearch utility, now offers users maps atvirtually any scale desired and, recently,through Google Earth, remotely sensedimages that users can view from anydirection or angle.3. Governments and non-governmentalorganizations (NGOs) typically makeinformation available via printed and,increasingly, online maps. For example,the federal government lets online usersmap census data; cities and towns posttheir planning and land-use maps onthe internet; and property tax districtspost maps of tax rates and assessed values on their websites. NGOs are using“participatory GIS” or web-based GISmapping tools to allow stakeholdersto interactively explore spatial aspectsof a wide range of issues, from urbanneighborhood revitalization efforts tocleanup decisions at a plutonium production facility.54. Static and animated maps are muchmore common in today’s newspapers,magazines, and electronic media than
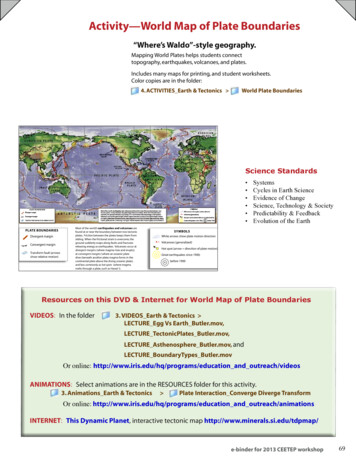
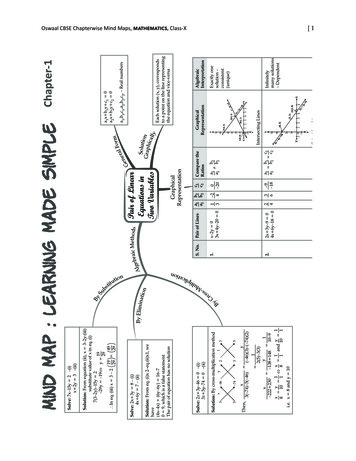
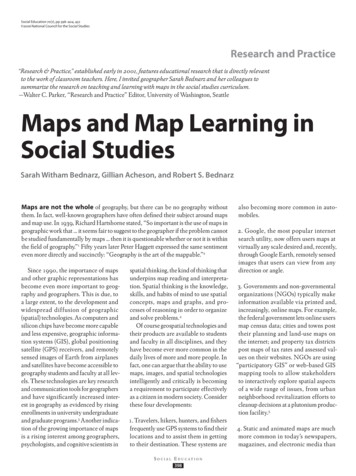
they were 20 years ago. As the cost of producing and reproducing maps and imageshas declined, the media have increasedboth the amount and the sophisticationof the materials they publish. These mapsplay an important role in both representing and reproducing space. 6 The wellknown 2004 election map showing thered (Republican) and blue (Democrat)states (Figure 1) illustrates this. The maphas taken on iconic status and reinforcesthe erroneous view that President Bush’svictory was a landslide. The populationbased cartogram constructed by MichaelGastner and colleagues at the Universityof Michigan (Figure 2) offers a moreaccurate representation of the vote.7 Inthis way, maps and graphics may play arole in legitimating or disputing specificideologies, beliefs, and practices.These developments, and more, bothallow and require modern citizens tounderstand spatial information presented on electronic and printed mapsand images. For this reason, helpingstudents become competent users andcreators of these technologies should bean important element of all of the socialstudies—maps are not just for geographyanymore. This places a new—but welcomed—burden on geography educatorsto ensure that map learning and spatialthinking are taught and taught well in thesocial studies.8 But are they?Assessing Students’ KnowledgeAssessments indicate that students arenot competent map users. An analysisof the 2001 National Assessment ofEducational Progress (NAEP) geographyexam revealed that at every level (grades4, 8, and 12) test items that required students to use and interpret maps were themost challenging (see Table 1). At grade4, nine of the ten most difficult itemsrequired map interpretation, construction, or use. For grades 8 and 12, five andseven of the ten most frequently missedquestions involved maps.9Teachers’ GoalsOne explanation for these low scores isthat few social studies teachers are awareof the growing importance of maps, or areFigure 1. ElectionResults by State.Figure 2. Election Results by State in aPopulation Cartogram.Source: M. Gastner, C. Shalizi, and M. Newman.Maps and Cartograms of the 2004 U.S.Presidential Election Results, www-personal.umich.edu/ mejn/election/.prepared and motivated to teach aboutand with maps. Teaching about mapsmeans providing students with the skillsand understandings required to read,interpret, and produce maps. Teachingwith maps means using maps to helpstudents learn key social studies conceptsand relationships. Teaching with mapsenables students to learn through maps—that is, to think spatially—in variousreasoning and problem-solving contextsin the classroom and real world.10A recent survey completed by members of the Texas Alliance for GeographicEducation provides information aboutteachers’ attitudes towards maps, howthey use maps, and how they teach mapskills.11 These teachers taught elementary (K-5), middle (6-8), and high (9-12)school, and they ranged in classroomexperience from one to 38 years withan average of almost 14 years. All wereexpected to teach map skills as a component of the state-mandated social studiescurriculum, which includes geography asa strand from kindergarten to grade 12.The survey revealed that these teachers’ methods were highly individualized.They used a variety of approaches andmaterials, including the textbook, workbooks, and self-made worksheets. Threebroad approaches to teaching map lessons were identified: employing handsNovember / December 2006399on activities, repeating lessons periodically, and making the content relevant tostudents. Teachers described hands-onactivities, especially “making” (labelingblank outline maps) maps, as a way forstudents both to learn about maps andto learn with maps.When teachers were asked the mostimportant thing students learned fromtheir map lessons, about one-third identified reading, interpreting, and analyzingmaps. They expected their students toevaluate the information provided bythe maps, to make inferences and decisions based on that information, to gainwhat one teacher called an “appreciationof spatial perspectives and understanding of spatial dimensions through scale,”and, in the words of another teacher, “tounderstand the geographic impacts illustrated by the map.” Thus, about one-thirdof teachers claimed to focus their maplessons on higher-order thinking involving the analysis and interpretation of theinformation presented on maps.However, when they were asked todescribe the content of their lessons, theirresponses indicated that they were mainlyteaching students to read maps. That is,they taught about latitude and longitude(or teaching students about grids), the fivecomponents of maps (title, date, direction, legend, and scale), the different
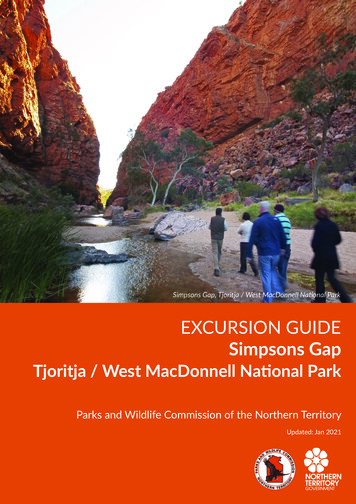
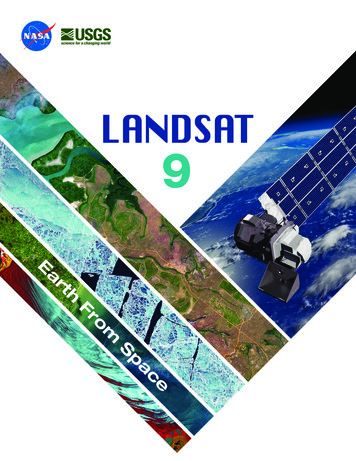
2004, Akademische Verlagsanstalt.www.odt.orgPeters Pacific-Centered World Map.types of maps (e.g., political, economic,physical, or topographic), and locatingplaces. Teachers went on to report themost important skills for their studentsto learn included way-finding; locatingcities, countries, and physical features;and understanding latitude and longitude, scale, direction, and map symbols.Generally speaking, then, their statedhigher-order goals were not supportedby their lower-order practices.Map LearningResearchers from a variety of fields haveexplored map learning. Geographers,social studies educators, and psychologists have studied how people use mapsto organize information and find theirway. They have also studied how peoplecreate and use mental images, termed“mental maps,” to understand theirenvironments and to organize theirknowledge of places. The results ofthis research should be integrated intocurricula and textbooks and understoodby teachers in order to improve students’ map learning and spatial thinking.Three findings are especially importantconcerning students’ ability to use maps,their ability to understand maps, and thecognitive complexity of map use.First, even the youngest students possess significant spatial skills, and theycan be taught to read and interpret mapsand images. Although many parents andteachers are skeptical about the abilityof young children to understand anduse maps, even elementary school students can use maps effectively. Researchshows that young children are surprisingly adept at using maps (and remotelysensed images) to find locations andtrace their paths to and from familiardestinations.12Second, children can use maps formore than way-finding. They are ableto understand and use symbols andpatterns represented by color or shading.13 A few studies suggest that simplemaps can be understood by childreneven without formal instruction. Somehave interpreted these results to meanthat certain spatial abilities are innateand that we need not wait until childrenS o c i a l E d u c at i o n400progress to later developmental stages tointroduce them to maps and other spatialrepresentations.14Third, this ‘intuitive’ map learningseems to level off; that is, without formal instruction, students’ map learningplateaus. After all, map interpretationis a complex, multi-stepped cognitiveprocess. One problem is that childrenand adults cling to a variety of misconceptions about maps and map use.15 Forexample, people often misinterpret symbols on maps. Understanding symbolsrequires abstract thinking and the ability to make generalizations. Point symbols, such as a dot to indicate the location of a city, are frequently assumed bynovice map users to indicate size. Theyunderstand that a point is a distinct,small, and finite area when, in fact, theboundaries of the city might be muchlarger than the point on the map. Othermap readers interpret point symbols ascircles surrounding the location of a cityor an area where something is takingplace. Graduated symbols that portraythe magnitude of a phenomena (i.e., a
town’s population) by using symbolsof different sizes further confuse mapreaders. Even adults often interpretthe symbol’s size as a representationof the town’s area, not its population.Thus, the symbol denoting New YorkCity’s population, which is very dense,is misunderstood to indicate that thecity covers a large area.Pictorial symbols, such as the use of asingle cow to indicate a region of cattleraising or a derrick to represent an areaof oil production, are often used to simplify map interpretation in elementarysocial studies texts and atlases, yet theyfrequently confuse young students. Forexample, the single cow symbol has beeninterpreted by young learners to represent the presence of one giant cow in anarea rather than a cattle-raising region.A car symbol positioned in an area ofautomobile production was interpretedvariously by young British students asshowing the location of a parking lot, thesite of a traffic jam, a place where peopleliked red cars, and as the location of abroken car.16 The triangle symbol oftenused to represent mountains can mislead students to think that all mountainshave distinct, pointed peaks similar tothe symbol.Color, an important component ofmaps, is regularly interpreted naïvelyas well. The green shading typically usedto indicate a region with low elevationis often misunderstood by map readersto represent grassland or forest. Colorson political maps indicating the area ofa country can lead to confusion as well;some students associate the color of thecountry with other assumed attributes ofthat place when, in fact, the mapmakerselected the color only for cartographicor artistic purposes. Researchers reportthat individuals react subjectively tocolor. “Red, for instance is associatedwith fire, warning, heat, blood, anger,courage, power, love, material force,and Communism.”17 When Tom Sawyerand Huck Finn are traveling down theMississippi, Huck thinks he knows wherethey are by the color of the landscape.Tom asks, “You know by the color?”Huck answers, “It’s got everything todo with it. Illinois is green, Indiana ispink.” Incredulously, Tom replies, “Didyou reckon the states was the same colorout-of-doors as they are on the map?”18In addition to the misconceptionsabout symbols and color, many map read-Ten Most Difficult Test Items, NAEP 2002. (Items in italics involve map skills.)Grade 4 Top Ten Most Difficult TestQuestionsGrade 8 Top Ten Most Difficult TestQuestionsGrade 12 Top Ten Most Difficult TestQuestions Interpret resource map to determinelikely location for large city to develop Describe and explain differences inpopulation pyramids Use data and maps to explainMongolia’s economic development Draw map based on writtendescription of its features Use a time zone map Explain reasons for internationaltrade in oil Identify the mountain range inwhich Switzerland is located Use multiple maps to locate stateswhere crops grow year round Use map to determine whichcountries might have a conflict overresources Use multiple maps to compareconditions for farming in twocountries Interpret information given on transitmap Find and draw specified route on atransit system map Identify a megalopolis on apopulation map Use map to explain internationaltrade in oil Explain two reasons for high rate oftropical deforestation Explain differences betweentwo countries using populationpyramids Use multiple maps to explain land usein Canada region Use atlas to explain regionalvariations in land use Recognize the natural forces thatcause erosion Use map to explain historical shift incenter of U.S. population Use map to explain historical shift incenter of U.S. population Use map to explain economic impactof Mid-East War Identify purpose of OPEC Use multiple maps to describe regionswhere most Australians live Understand and compare differentviews on land ownership Interpret resource map to determinelikely location for large city to develop Determine elevation of a region on aphysical map Explain high rate of tropicaldeforestation Use map and charts to compareurbanization in two Europeancountries Use a time zone mapNovember / December 2006401
ers find it difficult to identify relationships from maps, particularly thematicmaps. For example, the relationshipbetween high literacy rates and low infantmortality rates often goes undetected bystudents because they do not recognizethe negative or inverse relationshipsbetween variables.19 Relationships canoccur when high values are associatedwith other high values or when highvalues are associated with low values,as in this case.Instruction does make a difference.Several studies confirm that the understanding of maps and how to use themcan be improved. 20 Children as youngas four or five can be successfully taughtabout the shape of Earth, directions,Earth-sun relations, and the concept ofscale. 21 Instruction using maps as a primary tool can improve the mental mapsof seventh-grade students and increasetheir understanding of the characteristics of places on a worldwide basis. 22 Ashort, 20-minute session that taught agroup of college students basic map terminology and how to read a topographicmap improved their performance significantly compared to a group thatreceived no instruction. 23As this brief review suggests, researchdoes not provide teachers with a testedmethod they can adopt to ensure theirstudents’ success. Nevertheless, researchstrongly implies that students can usemaps effectively, that appropriate instruction can help them improve their skills,and that instruction should be developedwith a full understanding of the difficulties learners experience in map learningand spatial thinking.A Map CurriculumThe National Geography Standards:Geography for Life (1994), written morethan a decade ago under the auspicesof the United States Department ofEducation, specifies the essential subjectmatter, skills, and perspectives that allpeople should have to be geographicallyliterate. The standards-setting processgave geography educators an opportunity to reflect on map learning, spatialthinking, and other key aspects of schoolgeography. One goal of Geography forLife was for educators to see maps as ameans of communication and to givestudents opportunities to become fluentin the language of maps.Maps play a central role in the firstthree (of 18) standards summarizedunder the heading Seeing the World inSpatial Terms. Standard 1—how to usemaps and other geographic representations, tools, and technologies to acquire,process, and report information froma spatial perspective—is about maps,mapping, and using maps (and other geographic representations such as globes,graphs, diagrams, and aerial- and satellite-produced images) to learn geography.Standard 2—how to use mental mapsto organize information about people,places, and environments—is aboutdeveloping a personal understanding ofAn Invitation to “Live and Learn in Historic Virginia”Monticello, Stratford, and the University of Virginia invite you to apply for their annual seminar for teachers,“Leadership and Life in Revolutionary America.” Dates for 2007 will be June 24-July 13. Principal “classrooms”are Jefferson’s Monticello and the Lees’ Stratford. However, participants also visit many other Virginia historicsites and stay a week at the historic Jeffersonian area of the University of Virginia known as “the Lawn.”Six semester hours of graduate credit in history from the University of Virginia will be awarded uponsuccessful completion of the seminar. Tuition includes graduate course fees, room and board, and textbooks.Now in its 27th year, the seminar is an Award of Merit recipient from the American Association for State andLocal History. Applications are available online at www.stratfordhall.org. Application materials must bereceived by March 1, 2007.For details, call (804) 493-8038, ext. 1558email kmcfarland@stratfordhall.org,fax (804) 493-8006, or write:Education Office, Stratford,Stratford, VA 22558.S o c i a l E d u c at i o n402
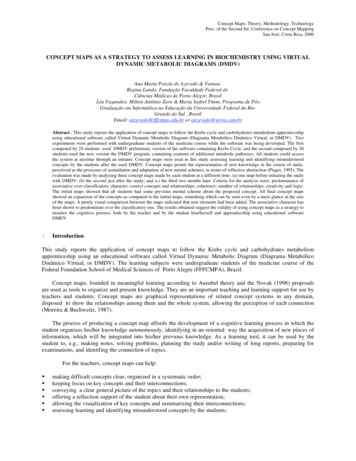
The Mercator map, because it wasdesigned to preserve on the flat mapcharacteristics of the round earth usefulto Earth navigators, exaggerates thesizes of places farther from the equator.Europe, for example, looks larger thanSouth America but is actually only halfits size, while Greenland appears as largeas Africa, but is less than 10 percent aslarge. By ignoring the needs of navigators, The Peters Map is able to show truesize relationships, though at the cost ofdistorting shapes.—Denis Woodthe locations and characteristics of places(a student’s mental map). Standard 3—how to analyze the spatial organizationof people, places, and environments onEarth’s surface—focuses on the ability todescribe and analyze patterns of people,places, and environments on Earth usingboth visual and mental maps.The National Geography Standardswere built on a foundation of traditionalmap components and skills such as reading maps, using scale to determine distance, and understanding map symbols.But the document also made recommendations based on the research alreadyreviewed here that, while not practicedwidely, are essential to our vision of maplearning.One suggestion was that studentsshould be able to make maps as well asread them. For example, the standardsrecommended that by the end of fourthgrade, a student should be able to represent information geographically by reading a story and creating a sketch map toillustrate it. An example of this skill wouldbe showing the movement of the familyof ducks through the city of Boston, asdescribed in the classic children’s bookMake Way for Ducklings.24A second recommendation of theNational Geography Standards wasthat students should use maps producedwith new technologies such as GIS andremote sensing. Maps displaying satellite imagery (e.g., Google Earth) arewidely available now and becoming verypopular; it was considered important,even in 1994, that students expand theirmap interpretation skills to includedigital maps and images. Although thestandards did not suggest integrationof GIS into K-12 education, its growingimportance was highlighted in an appendix. A more recent National Academy ofScience study explores the role of GISin supporting spatial thinking. 25A third suggestion addresses socialstudies learning in general. Researchsuggests that when students read, theyremember information as both wordstatements and visual images. This “dualencoding” can be enhanced when teachers encourage their students to link whatthey read to maps and other geographicrepresentations. For example, everyNovember / December 2006403American fifth-grade student readsabout Paul Revere’s ride, but what isunderstood and remembered is questionable.26 If students are asked to makea map of this momentous event showingthe starting point, the opposite shore, theroute of the two riders, and the eventualdestination, Revere’s ride becomes vivid.Linking what with where, and readingand thinking with and through maps,makes content more memorable.27Talking Back to Maps“Both in the selectivity of their contentand in their signs and styles of representation, maps are a way of conceiving, articulating, and structuring the human worldwhich is biased towards, promoted by,and exerts influence upon particular setsof social relations.”28 Just as the quotesat the beginning of this article representthe traditional importance of maps to thediscipline of geography, so this quotefrom J.B. Harley represents a postmodernappreciation. Postmodern geographicthought has had little impact on geography education in the elementary andsecondary schools of the United States,
but we believe two perspectives of criticalcartography are essential components ofa revitalized pedagogy of maps and maplearning: students and teachers shouldunderstand how geographic knowledgeis created, and they should understandthe purposes of such knowledge.In the context of maps and map learning, it is important that students andteachers understand that maps are socialconstructions. Just as texts are written byindividuals with varying points of view,and can be read and interpreted in different ways and for different purposes, maps,too, are not objective representations ofreality but social productions that can besubjected to critical analysis. Part of anyrevitalization of map learning, or to useHarley’s phrase, “an increase in levelsof carto-literacy,” must include explicitinstruction about how to interrogate amap—to consider the conditions underwhich it was produced, whether it mayportray a particular point of view, andRESOURCES FROMRETHINKING SCHOOLS4 easy ways to order!ORDER ONLINE:www.rethinkingschools.orgCALL TOLL-FREE:800-669-4192FAX ORDER TO:802-864-7626MAIL ORDER TO:Rethinking SchoolsP.O. Box 2222Williston,VT 05495RETHINKING SCHOOLS MAGAZINEThe leading grassroots education magazine. Every issueis packed with innovative teaching ideas, analyses ofimportant policy issues, and listings of valuable resources.Two years: 29.95 (Save 9 off the cover price!)One year: 17.95Subscriptions to Canada and Mexico add 5 per year.THE LINE BETWEEN USTeaching About the Border and MexicanImmigrationUsing stories, historical narrative, role plays, poetry, andvideo, veteran teacher Bill Bigelow shows how he approachesimmigration and border issues in his classroom.ISBN 0-942961-31-5 160 pages Only 16.95!*VISIT US ATBOOTH 216AT NCSS 2006IN WASHINGTON, D.C.FREE BOOK TO FIRST500 VISITORS!*Plus shipping and handling.U.S. shipping and handling costsare 15% of the total (minimumcharge 4.00). Canadian shipping and handling costs are 25%of the total (minimum charge 5.00).RETHINKING GLOBALIZATIONTeaching for Justice in an Unjust World“A treasury of ideas and information,” according tohistorian Howard Zinn. Includes role plays, interviews,poetry, stories, background readings, and hands-onteaching tools.ISBN 0-942961-28-5 400 pages Only 18.95!*OPEN MINDS TO EQUALITYA Sourcebook of Learning Activities to AffirmDiversity and Promote EquityActivities to help students understand and changeinequalities based on race, gender, class, age, language,sexual orientation, physical/mental ability, and religion.ISBN: 0-942961-32-3 408 pages Only 24.95!*what, if any, messages it conveys aboutpower and perspective.29 We believe it isessential for students to develop a criticalawareness and skepticism about maps aswell as other graphics and images. Weclose with two examples.During the Cold War, those whowished to emphasize the danger facedby the United States from communismoften portrayed global spheres of influence using a Mercator projection. Thesize of countries on this type of map isexaggerated as one moves toward thepoles. Thus, using this map to depictEastern Europe, China, and the USSR(often in a bright symbolic red color)made this northerly region seem largerand more menacing than it would haveon a map that represented areas morerealistically.30Choosing where to center a map alsoconveys the point of view of the mapmaker. Harley points out that centeringthis same Mercator projection on Europestrongly supported Europeans’ view oftheir global hegemony. This view makesit appear that “two-thirds of the Earth’ssurface lie in high latitudes,” the location of Europe. At the same time “thecolonies inhabited by coloured peoplesare shown too small.”31 The practice ofputting oneself at the center of the map isstill common. Most American textbookmaps in use today show the world withthe North American-European core atthe center, dividing the Pacific Rim inhalf and assigning it to the edges of themap. Not surprisingly, Japanese textbookmaps frequently center on the Pacificbasin splitting the Atlantic Ocean in halfand assigning it to the map’s edges.Here are three strategies to helpstudents become more critically“carto-literate”:1. Have students take a problem solvingapproach by asking them to map a phenomenon, such as murders in the UnitedStates, in two ways. First, have them(inappropriately) plot the total numberof murders by state. Then after dividingthe number of murders by the states’populations, ask students to map the percontinues on page 432S o c i a l E d u c at i o n404
MAPS from page 404capita murder rate. Ask why the latteris more appropriate if one is interestedin comparing the murder rate betweenstates. By linking how a map is createdto its purpose, students should gain abetter sense of ways maps can distortrelationships.2. Have students take an inquiry approachto understand the characteristics of mapprojections. The objective is to comprehend how projections affect the information maps convey and the conclusionsthat can or cannot be reached from mapswith various projections. Ask studentsto compare the size of northern regions(e.g., Canada, Russia, Greenland) onworld maps with different projectionssuch as the Mercator, the Robinson, andthe Peters (See Peters Pacific-Centeredmap on page 400). Which maps show(relative) sizes most accurately? Whichshow shape or distance more accurately?Ask students how map readers might beconfused or misled if an inappropriatemap projection is chosen.323. Combine problem solving with inquiryby requiring students to collect examplesof maps from a range of local, national,and international sources, includingnewspapers and magazines. Display themaps, and guide students’ evaluation ofthem, questioning the maps’ social andpolitical purpose(s), perspectives, biases,and possible distortions. By reflecting onthe assumptions made in producing eachmap, students may develop the habit ofmind to view maps critically.33Notes1. Richard Hartshorne, The Nature of Geography(Washington, D.C.: Association of AmericanGeographers, 1939).2. Peter Haggett, The Geographer’s Art (Cambridge,Mass.: Blackwell, 1990).3. Douglas Richardson and Patricia Solis, “Confrontedby Insurmountable Opportunities: Geography inSociety at the AAG’s Centennial,” ProfessionalGeographer 56, no.1: 4-11.4. Committee on the Support for Thinking Spatially:The Incorporation of Geographic InformationScience across the K-12 Curriculum, Committee onGeography, National Research Council, Learning toThink Spatially: GIS as a Support System in the K-12Curriculum (Washington D.C.: National AcademyPress, 2005).5. Sarah Elwood, “Negotiating Knowledge Production:The Everyday Inclusions, Exclusions, andContradi
that is, to think spatially—in various reasoning and problem-solving contexts in the classroom and real world.10 A recent survey completed by mem-bers of the Texas Alliance for Geographic Education provides information about teachers’ attitudes towards maps, how they use maps, and h