Transcription
LANDSAT9hrtaEmroFSecap
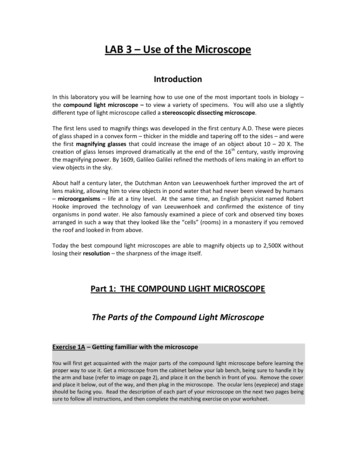
Tracking Decades of ChangeTo access Landsat data,visit https://www.usgs.gov/landsatFor nearly half a century, the Landsat mission hasshaped our understanding of Earth. Since the launchof the first Landsat satellite in 1972, the mission hasgathered and archived more than 8 million imagesof our home planet’s terrain, including crop fieldsand sprawling cities, forests and shrinking glaciers.These data-rich images are free and publicly available,leading to scientific discoveries and informedresource management.The continuous flow of Landsat data has enabledresearchers to monitor global land cover for more than48 years. With each pixel recording data on an areathe size of a baseball infield, 98 feet (30 meters) across,Landsat images are detailed enough to detect bothnatural and human-caused changes to the landscape.mine the health of global crops and the extent ofagricultural irrigation. It allows organizations to detectdeforestation in remote areas of the globe and quantifythe impact of wildfires. It also feeds efforts to improvewildlife habitat and prepare for natural disasters.The Landsat mission, a partnership between NASAand the U.S. Geological Survey (USGS), has providedthe longest continuous record of Earth’s land surfacesfrom space. The consistency of Landsat’s land-coverdata from sensor to sensor and year to year makes itpossible to trace land-cover changes from 1972 tothe present, and it will continue into the future withLandsat 9. With better technology than ever before,Landsat 9 will enhance and extend the data record tothe 50-year mark and beyond.More than 18,000 peer-reviewed research papershave used Landsat data. The mission helps deter-Continuing the Landsat LegacyImage credit: NASABuilding on the Landsat Legacy. Prior to 1972, the idea of using satellite data for land monitoring, mapping, or exploration was a novel concept. The Landsat Program—a series of Earth-observing satellite missions jointly managed by NASA and USGS—has revolutionized the wayhumans view and study our planet. This graphic depicts the 9 satellites that make up the Landsat series. Landsat 6 was lost in a launch failurein 1993. Landsat 7 and 8 are still operational, and Landsat 9 will continue the legacy of the Landsat missions’ rich, global archive.1Landsat 9 Earth From Space
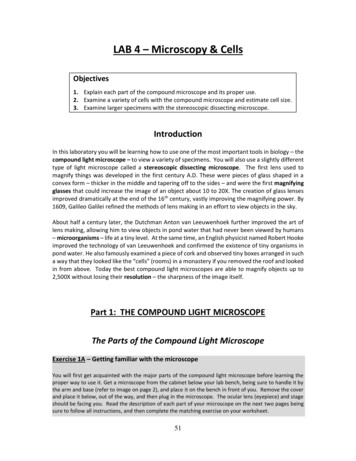
Landsat 9The newest Landsat satellite strikes a balance:Using state-of-the-art technology, Landsat 9 willcollect the highest quality data ever recorded by aLandsat satellite, while still ensuring that these newmeasurements can be compared to those taken byprevious generations of the Earth-observing satellite.The new satellite will add more than 700 scenes ofEarth to the mission’s archive each day. A near-polarorbit will allow the satellite’s sensors to image almostthe entire planet every 16 days. When Landsat 9 joinsLandsat 8 in orbit, the two satellites together will beable to image each swath of the globe every eight days.Landsat 9 will carry two instruments that largelyreplicate the instruments on Landsat 8: theOperational Land Imager 2 (OLI-2) and the ThermalInfrared Sensor 2 (TIRS-2). OLI-2 and TIRS-2 areoptical sensors that detect 11 wavelengths of visible,near infrared, shortwave infrared, and thermal infraredlight as it is reflected or emitted from the planet’ssurface. Data from these instruments are processedand stored at the USGS Earth Resources Observationand Science (EROS) Center in Sioux Falls, SouthDakota—where decades worth of data from all of theLandsat satellites are stored and made available for freeto the public.As Earth’s population approaches 8 billion people,Landsat 9 will continue to provide consistent and impartial data about the changing land cover and landuse of our planet, and enable enhanced studies of thefootprint of the growing population.Newer imagesImage credit: NASAOlder imagesLandsat 9 will have the same resolution as its predecessors, and the data will be precisely mapped to the globe so that researchers can study how eachindividual pixel—each parcel of land—changes over time.Image credit: NASAContinuing the Legacy of Tracking Water QualitySpotting Algal Blooms from Space. Harmful algalblooms can cause big problems in coastal areas andlakes across the United States. When toxin-containingaquatic organisms multiply and form a bloom, it cansicken people and pets, contaminate drinking water,and force closures at boating and swimming sites. Withlimited resources to monitor these often-unpredictableblooms, water managers are turning to data fromLandsat and other Earth-observing satellites. With itsmedium resolution, Landsat can gather data on smallerlakes than other satellites can, allowing scientists totrack water quality information from more than 60% ofthe U.S. lakes and reservoirs, or more than 170,000waterbodies. The image here shows a green algalbloom in western Lake Erie, taken by Landsat 8’sOperational Land Imager on September 26, 2017.Landsat 9 Earth From Space2
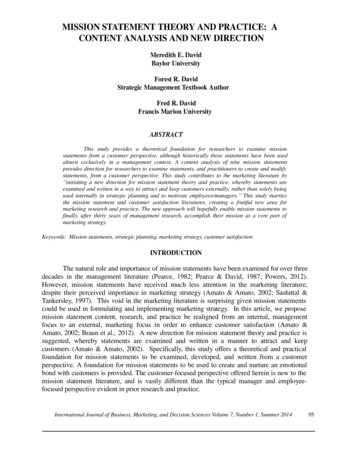
Operational Land Imager 2 (OLI-2)The OLI-2 instrument will produce stunning imagesof our home planet—algae swirling in the North Sea,teal melt ponds on a bright white glacier, checkerboards of crop fields stretching for miles—but thedata behind these images will tell scientists and landmanagers so much more.OLI-2 is being builtand assembled byBall Aerospace andTechnologies Corporation.Photo credit: BallAerospace andTechnologies CorporationWithin the OLI-2 instrument are thousands ofdetectors, aligned in rows. These detectors are sensitiveto light reflecting off Earth’s surface in nine differentwavelengths, including visible, near-infrared and shortwave-infrared light. With data from these bands, eitheralone or in combination, Earth’s surface is revealed.For example, healthy plants reflect near-infraredlight, so strong signals in that band, relative to others,provide scientists with information about growingvegetation. Information from the shortwave infraredbands can help ecosystem managers identify regionsthat have been scarred by wildfires. Visible light bandsrevealing subtle color variations in lakes can help watermanagers identify potentially harmful algae blooms.Several of these bands replicate the wavelengths detectedby previous Landsat instruments—allowing Landsat 9to maintain continuity with decades of previous observations. The Landsat 8 OLI instrument introducedtwo new bands: one that detects cirrus clouds and onethat has improved observations of coastal waters andaerosols. Landsat 9 will downlink 14-bit data fromOLI-2, as compared with 12-bit data from Landsat 8OLI, leading to improved observations of darkerregions, such as forests and coastal waters.OLI-2 will have a 98-foot (30-meter) spatial resolution across most of its spectral bands, meaning eachpixel represents an area about the size of a baseballinfield. Altogether, the sensors cover a swath 115 miles(185 kilometers) wide. This combination of a wideswath and moderate resolution allows OLI-2 to coverlarge areas, while still providing fine enough resolution to distinguish individual agricultural fields, forestplots or housing developments—important information for urban planners, land resource managers andcommodity analysts.Continuing the Legacy of Disaster ResponseUnburnedto very lowLowhot spotModerateHighburn scar3Landsat 9 Earth From SpaceImage credit: USDA Forest Service,Burned Area Emergency Response TeamBurned Area Emergency Response Maps. Before wildfires stop smoldering, forest restoration specialists are on the job. They analyze mapscreated using Landsat satellite data, called Burned Area Emergency Response maps, to determine where a burn destroyed vegetation andexposed soil—and to identify where to focus emergency restoration efforts. These maps can save federal agencies as much as 7.7 millionannually in post-fire costs, according to a 2019 study. Fire managers analyze before and after images from the near-infrared band, which reflectsstrongly from healthy vegetation, and the shortwave-infrared band, which reflects strongly from exposed ground, to identify scorched areas.The images below show the location of the 2013 Silver Fire in New Mexico. The “before” image [left] is a false-color Landsat 8 image acquiredMay 28, 2013. The “during” image [middle] shows the location of the fire (bright red dot) and burn scar (dark red) on June 13, 2013, while thefire was still growing. The image on the right is an example of a Burned Area Emergency Response map created using Landsat data, showingareas with high (red), moderate (yellow) and low (green) severity burns. Fire managers use maps like these to direct restoration resources.
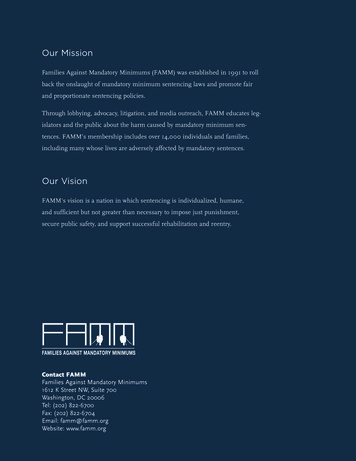
Thermal Infrared Sensor 2 (TIRS-2)Whether it’s a cornfield, a parking lot, or an iceberg,a surface emits thermal infrared radiation, or heat.By detecting radiation in two thermal wavelengths,Landsat 9’s TIRS-2 instrument can measure the temperature of our planet’s ground and water.TIRS-2 uses thermal bands to detect subtle shiftsin temperature—within a tenth of a degree Celsius. Its detectors are called Quantum Well InfraredPhotodetectors, or QWIPs, and were developed atNASA’s Goddard Space Flight Center in Greenbelt,Maryland. Thermal infrared radiation in a specificwavelength will excite electrons within the QWIPs,creating an electrical signal that is used to determinesurface temperature.Observing surface temperatures from space can bedifficult, however, as atmospheric moisture and airtemperature can skew the signals. The atmosphereaffects each of the TIRS-2 thermal bands sightly differently, resulting in a thermal image from one of thebands that is slightly darker than the other. Computerprograms can analyze that difference to compensate foratmospheric effects, creating a more accurate temperature record of Earth’s surface.TIRS-2 works on the same principles as the originalTIRS on Landsat 8, but corrects a problem the first instrument had with scattered light inside the telescope.And while TIRS has a three-year design life, TIRS-2is built with increased robustness and redundancy tolast at least five years. TIRS-2, like OLI-2, is a “pushbroom” sensor with arrays of detectors that line up toobserve a field of view that is 115 miles (185 kilometers) across, with a resolution of 328 feet (100 meters).Water resource managers, who use temperature measurements from the Landsat satellites to help track agricultural water use, advocated for the inclusion of the originalTIRS on Landsat 8. Water in the soil, as well as waterreleased from a plant’s leaves as it undergoes transpiration, results in cooler temperatures over irrigated,healthy crops—which can be detected in TIRS data.Scientists and resource managers have used Landsat thermal observations to locate the perimeters of active fires,since the thermal bands can penetrate smoke that mightotherwise obscure the view. TIRS data can also be used to“see” in the polar night, tracking icebergs in winter whenthere is little visible light for other bands to detect.Engineers at NASAGoddard work on TIRS-2,which will measuresurface temperatureson Earth’s surface fromthe Landsat 9 satellite.Photo credit: NASAContinuing the Legacy of Ice ObservationsImage credit: NASATracking Ice in Polar Darkness. Under the cloak of Antarctica’spolar night, a massive iceberg calved from the Larsen C IceShelf in July 2017. Despite the lack of sunlight, thermal imagesfrom Landsat 8’s TIRS instrument were able to tell the storyof how a chunk of ice about the size of Delaware broke loosefrom the Antarctic Peninsula. On September 16, 2017, theTIRS instrument on Landsat 8 took this false-color image of theberg, showing the relative warmth or coolness of the surfaces,allowing scientist to track its split and movement. Light blue andwhite colors are the coldest surfaces, including the ice shelf andthick iceberg. Purples reveal areas of thin sea ice, and regionsof mixed water, ice, and snow called mélange. The yellows andoranges indicate the warmest surfaces, such as the open waterbetween the shelf and berg.TIRS data can also beused to “see” in the polarnight, tracking icebergsin winter when thereis little visible light forother bands to detect.Thermal SignatureColderWarmerLandsat 9 Earth From Space4
Launch and OperationsLandsat 9 will launch from Vandenberg Air ForceBase in California, in a United Launch AllianceAtlas V rocket. It will go into a near-polar orbit at analtitude of 438 miles (705 km) above Earth, travelling16,760 miles per hour (26,972 km per hour).The two instruments aboard Landsat 9 areintegrated onto a spacecraft bus built by NorthropGrumman Space Systems. The spacecraft—whichhas a design similar to the one used for Landsat 8—provides the satellite with power, orbit control,propulsion, navigation, communications, datastorage and more.Four solar panels will deploy after launch, to chargethe spacecraft’s battery. A data recorder onboardwill store up to 4 terabits of data, before the data aretransmitted to one of three ground stations—either inGilmore Creek, Alaska; Svalbard, Norway; or SiouxFalls, South Dakota.The data are archived at the USGS Earth ResourcesObservation and Science (EROS) Center in SiouxFalls, which also generates the data products used byscientists, resource managers and other users. This isone element of the Landsat 9 ground system—theother consists of the Mission Operations Center(MOC) at NASA Goddard, which issues softwarecommands to control the satellite observatory anddirect science data collection.Continuing the Legacy of Helping FarmersOn February 11, 2013,at 1:02 p.m. EasternStandard Time (10:02 a.m.Pacific Standard Time), anAtlas V rocket successfullycarried the LandsatData Continuity Mission(LDCM)—later renamedLandsat 8—into orbit fromVandenberg Air ForceBase in California. Photocredit: NASAUsing Landsat Data to Track Regional Crop Changes. From major crops like corn and wheat, to regionalcrops like rice and citrus, the U.S. Department of Agriculture (USDA) tracks America’s farmland wit
Technologies Corporation. Photo credit: Ball Aerospace and Technologies Corporation Burned Area Emergency Response Maps. Before wildfires stop smoldering, forest restoration specialists are on the job. They analyze maps created using Landsat satellite data, called Burned Area Emergency Response maps, to determine where a burn destroyed vegetation and exposed soil—and to identify where to .