Transcription
Int. J. Biol. Sci. 2021, Vol. 17IvyspringInternational Publisher834International Journal of Biological Sciences2021; 17(3): 834-847. doi: 10.7150/ijbs.57099Research PaperAnterior gradient 2 increases long-chain fatty acid uptakevia stabilizing FABP1 and facilitates lipid accumulationYunqiu Wang1,2, Mengqi Jia1, Chuanjie Liang1,2, Nan Sheng1, Xiaodan Wang1, Fang Wang1, Yanhai Luo1,2, JinJiang1, Liangyu Cai1, Huanmin Niu1, Deyu Zhu2, Effat Un Nesa1, Charles YF Young3, Huiqing Yuan1,2 1.2.3.Key Laboratory of Experimental Teratology of Ministry of Education, Institute of Medical Sciences, the Second Hospital, Cheeloo College of Medicine, ShandongUniversity, Jinan 250031, China.Department of Biochemistry and Molecular Biology, School of Basic Medical Sciences, Cheeloo College of Medicine, Shandong University, Jinan 250014, China.Department of Urology, Mayo Clinic College of Medicine, Mayo Clinic, Rochester 55905, MN, USA. Corresponding author: Huiqing Yuan, Ph.D., Key Laboratory of Experimental Teratology of the Ministry of Education, Institute of Medical Sciences, the Second Hospital,Cheeloo College of Medicine, Shandong University, Jinan 250031, China. Tel: 86-531-85875118, E-mail: lyuanhq@sdu.edu.cn. The author(s). This is an open access article distributed under the terms of the Creative Commons Attribution License (https://creativecommons.org/licenses/by/4.0/).See http://ivyspring.com/terms for full terms and conditions.Received: 2020.12.13; Accepted: 2021.01.23; Published: 2021.02.08AbstractAnterior gradient 2 (AGR2), a protein disulfide isomerase (PDI), is a well-established oncogene. Here, wefound that Agr2-/- mice had a decreased fat mass and hepatic and serum lipid levels compared with theirwild-type littermates after fasting, and exhibited reduced high-fat diet (HFD)-induced fat accumulation.Transgenic mice overexpressing AGR2 (Agr2/Tg) readily gained fat weight on a HFD but not a normal diet.Proteomic analysis of hepatic samples from Agr2-/- mice revealed that depletion of AGR2 impaired long-chainfatty acid uptake and activation but did not affect de novo hepatic lipogenesis. Further investigations led to theidentification of several effector substrates, particularly fatty acid binding protein-1 (FABP1) as essential for theAGR2-mediated effects. AGR2 was coexpressed with FABP1, and knockdown of AGR2 resulted in a reductionin FABP1 stability. Physical interactions of AGR2 and FABP1 depended on the PDI motif in AGR2 and theformation of a disulfide bond between these two proteins. Overexpression of AGR2 but not a mutant AGR2protein lacking PDI activity suppressed lipid accumulation in cells lacking FABP1. Moreover, AGR2 deficiencysignificantly reduced fatty acid absorption in the intestine, which might be resulted from decreased fatty acidtransporter CD36 in mice. These findings demonstrated a novel role of AGR2 in fatty-acid uptake andactivation in both the liver and intestine, which contributed to the AGR2-mediated lipid accumulation,suggesting that AGR2 is an important regulator of whole-body lipid metabolism and down-regulation of AGR2may antagonize the development of obesity.Key words: AGR2, lipid metabolism, chaperone, FABP1, liver, intestineIntroductionThe endoplasmic reticulum (ER) is an organelleimportant for controlling protein quality, slational modification and trafficking [1-6].ER-resident proteins, such as chaperones, stressresponse proteins, and calcium-modulating proteins,are critical in maintaining ER homeostasis and cellfunction [7-9]. Protein disulfide isomerases (PDIs) areisomerases and molecular chaperones localizedprimarily within the ER [10]. PDIs possess disulfideinterchange and/or oxidoreductase activity viadistinct motifs, in which protein disulfide bonds areoxidized, reduced or isomerized [11]. As therate-controlling catalysts, PDIs promote proteinfolding and the correction of misfolded proteins intotheir native conformations via their chaperone and/orisomerase activity, functioning as critical factors in theregulation of stability and activity of diverse substrateproteins and maintenance proteostasis [12, 13]. Hence,dysfunction of these enzymes has been considered tocontribute to the development of diseases, includingneurodegeneration, cancer, and cardiovasculardiseases [14, 15]. However, the role of PDIs inmetabolic disorders including dyslipidemia remainslargely unknown.As most lipid metabolic enzymes contain one ormore cysteine residues that are essential formaintaining their protein conformation and exertingfunction, PDIs are emerging as important regulatorsin lipid metabolism. For example, the PDI familyhttp://www.ijbs.com
Int. J. Biol. Sci. 2021, Vol. 17member ERdj5 and PDI/PDIA1 are required forefficient folding of the LDL receptor and apoB100,facilitating very low density lipoprotein (VLDL)assembly [16]. ERp44 cooperates with Ero1α tocontrol the quality of adiponectin via thiol-mediatedretention [17].In the present study, we showed a previouslyunrecognized function of anterior gradient 2 (AGR2),a member of the PDI family which is a wellestablished oncogenic and prometastatic factor inmost adenocarcinomas [18, 19], in lipid metabolism.AGR2 is highly expressed in the liver and intestinebut not in adipose tissue, AGR2 null mice (Agr2-/-) lostfat mass and fat storage, associated with a reductionin blood lipid levels. Further investigationsdemonstrated the importance of AGR2 in mediatinglong-chain fatty acid (LCFA) uptake/activation andabsorption in the liver and intestine. This effect isascribed to the AGR2 chaperone activity inmaintaining substrate stability.Materials and MethodsAnimalsC57BL/6J mice (6-week-old) were obtained fromVital River Laboratory Animal Technology Co.(Beijing, China). Agr2-/- mice were obtained from TheJackson Laboratory (USA). TgTn (CAG-Agr2-WPREpA) overexpression transgenic mice (Agr2/Tg) wereobtained from Shanghai Model Organisms Center(Shanghai, China) using the promoter CAG. Allexperiments used male mice of the same age. Micewere caged in an environment with controlledtemperature and humidity with free access to waterand food under a 12-h light/dark cycle. At the end ofthe experiments, the mice were euthanized with anoverdose of pentobarbital sodium (150 mg/kg, i.v.).All animal experiments were approved by the EthicsCommittee of Shandong University School ofMedicine (Jinan, China).HFD-induced obese miceDiets were purchased from Trophic Animal FeedHigh-tech Co. (Nantong, China). After 1 week of dietadaptation, the mice at 8-week-old were fed a HFD(60% fat) for an additional 10 weeks to induce obesity.Mice fed a NCD were used as lean controls.Co-immunoprecipitationAliquots of proteins (1.2 mg) from cells wereprecleared with protein A/G Plus-Agarose (SantaCruz) in the presence of non-specific IgG (SantaCruz), then incubated with primary antibodies and 20µl agarose beads with continuous mixing overnight at4 C. The beads were washed and heated at 75 C for 5min in loading buffer prior to immunoblotting assays.835Body fat analysisThe body fat mass of mice was analyzed with aLUNAR Prodigy X-Ray Tube Housing Assembly (GEMedical Systems).Lipid absorption in miceMice were fasted for 4 h and then administered a100 μL volume of 1.5 mg/kg body weight BODIPYFL-C12 (a FA analog; AAT Bioquest; resuspended inDMSO) by oral gavage. BODIPY is an optimal lipidused for studying mucosal absorption. Additionally,the BODIPY fluorophore itself is intrinsicallylipophilic, and probes incorporating this fluorophoreundergo native-like transport and metabolism in cells.Serum BODIPY FL-C12 concentrations weremeasured in blood serially drawn 50, 100 and 150 minafter gavage and were quantified by measuring thefluorescence intensity at an excitation wavelength of488 nm and an emission wavelength of 515 nm [20].Histidine (His) pull-down experimentsIn His pull-down assays, about 50μg of theappropriate 6 His fusion proteins was mixed with500μL of the in vitro translated products andincubated in binding buffer (20 mM Tris buffer PH8.0, 150 mM NaCl). The binding reaction was thenadded to 30 μL of Co-Sepharose beads and mixed at 4 C for 2 h. The beads were washed three times withwashing buffer (20 mM Tris buffer PH 8.0, 150 mMNaCl, 10 mM Imidazole), resuspended in 50 μL ofElution buffer (20 mM Tris-HCl buffer pH 8.0, 150mM NaCl, 250 mM Imidazole), and resolved on 13.5%gels. Protein bands were detected with Coomassiestaining and western blotting.Quantitative proteomic analysis by TMTtechnologyLivers from 8-week-old WT and Agr2-/- micewere collected into 2mL tubes, and SDT buffer wasadded to the sample. The lysate was homogenized inan MP homogenizer (24 2; two times at 6.0 M/S for60 s each). The homogenate was sonicated and wasthen boiled for 15 min. After centrifugation at 14000 g for 40 min, the supernatant was filtered through 0.22µm filters. The protein content in the filtrate wasquantified with a BCA Protein Assay Kit (Bio-Rad,USA). The sample was stored at -80 C after repeatedultrafiltration (Microcon units, 10 kD). Then, 200 μg ofprotein per sample was digested with 4 μg trypsin(Promega). The resulting peptides were collected as afiltrate, and the peptide content was estimated by theUV light spectral density at 280 nm. A 100 μg peptidemixture of each sample was labeled using TMTreagent according to the manufacturer’s instructions(Thermo Fisher Scientific). LC-MS/MS analysis washttp://www.ijbs.com
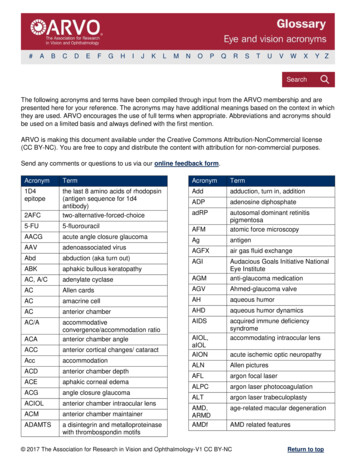
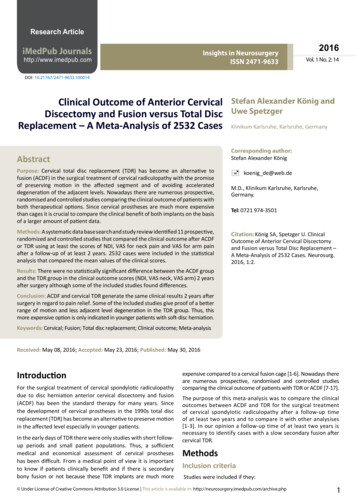
Int. J. Biol. Sci. 2021, Vol. 17performed over a 60 min period on a Q Exactive massspectrometer (Thermo Scientific) coupled to an EasynLC system (Proxeon Biosystems, now Thermo FisherScientific). MS/MS spectra were searched using theMASCOT engine (Matrix Science, London, UK;version 2.2) embedded into Proteome Discoverer 1.4.Bioinformatic analysisTo further explore the impact of differentiallyexpressed proteins on cell physiological processes anddiscover internal relations between differentiallyexpressed proteins, enrichment analysis wasperformed. GO enrichment analysis in threeontologies (biological process, molecular function,and cellular component) and KEGG pathwayenrichment analysis were applied based on Fisher’sexact test, considering all quantified proteinannotations as a background dataset. TheBenjamini-Hochberg correction for multiple testingwas further applied to adjust derived p-values. Onlyfunctional categories and pathways with p-values lessthan the threshold of 0.05 were considered significant.In general, p-values less than the threshold of 0.05were considered to indicate significant differences.The relative expression data for the studied proteinswere used to perform hierarchical clustering analysis.For this purpose, Cluster 3.0 and Java Treeviewsoftware were used. The Euclidean distance algorithmfor similarity measurement and the average linkageclustering algorithm (clustering is performed usingthe centroids of the observations) for clustering wereselected for hierarchical clustering. Heatmaps areoften presented as visual aids in addition todendrograms. The protein–protein interaction (PPI)information for the studied proteins was retrievedfrom STRING software. The results were downloadedin XGMML format and imported into Cytoscape 3.7.1software. Docking analysis was performed by in silicoprediction of protein binding using AutoDock Vina.Isolation and culture of primary mousehepatocytesMice were anesthetized with chloral hydrate; thelivers were perfused with normal saline for 5 min, andin vivo digestion was performed with collagenase (900mg/L) for 5 min. Hepatocytes were separated bycentrifugation for 5 min at 300 rpm, washed in PBSand plated on collagen-coated plates. Primary mousehepatocytes were maintained in low-glucose DMEM(HyClone, Logan, USA) supplemented with 20% fetalbovine serum, 5 mg/L insulin, 5 mg/L transferrin, 20μg/L dexamethasone and 2 nM glutamine [21].Statistical analysisThe data are presented as the mean SD andanalyzed with GraphPad Prism software (GraphPad,836La Jolla, CA, USA). Student's t-test or one-wayANOVA analysis was used for comparison amongdifferent groups. All the experiments have beenrepeated at least three times. Values of P 0.05 wasconsidered to be statistically significant, indicatedas *P 0.05, **P 0.01, and ***P 0.001 in the figures.Further experimental information is described inthe supplementary materials and methods.ResultsAGR2 knockout reduces serum lipid levels andfat accumulationWe initially investigated the physiological role ofAGR2 using Agr2-/- mice [22]. It was observed thatweight gain was significantly decelerated in Agr2-/mice compared with their wild-type (WT) littermatesfed a normal chow diet (NCD) after 10 weeks, andAgr2-/- mice weighed 17% less than their WTlittermates for 18 weeks (Figure 1A and FigureS1A-C). Whole body composition analysis by dualenergy X-ray absorptiometry (DEXA) indicated thatAgr2-/- mice had a proportionally lower fat mass andthat the fat percentage (as a fraction of total bodyweight) was decreased by 64% at 18-week comparedto that of the paired WT mice, but the body weight ofAgr2-/- and WT mice was comparable when the fatweight was subtracted from the total weight (Figure1B). AGR2 depletion did not alter food or waterintake, eliminating the possibility that the leannessresulted from a lower food intake (Figure S1D, S1E).No significant differences were found in the liver,kidney, heart, spleen, and lung weights or the tibialength between Agr2-/- and WT mice fed a NCD.However, the liver and spleen weights were increasedin Agr2-/- mice fed a HFD, although the weights of theother organs were unchanged (Figure S1F, S1G).Importantly, mice lacking AGR2 showed partialresistance to HFD-induced overweight, and the totalfat mass was decreased by 60% in Agr2-/- micecompared to the matched WT mice, but no significantchange was observed in the fat-free body weightbetween Agr2-/- mice and WT mice (Figure 1B, 1C).Meanwhile, the mass of epididymal white adiposetissue (eWAT) and subcutaneous white adipose tissue(subWAT) was significantly reduced in Agr2-/- micefed either a NCD or a HFD, the ratio of eWAT/wholebody weight and subWAT/whole body weight wasalso markedly decreased in Agr2-/- mice after NCD orHFD feeding, the change pattern was similar toobservations on whole body fat (Figure S1H, S1I).These findings suggest that AGR2 depletion mayreduce fat accumulation. We further assessedphenotypic changes in transgenic mice with AGR2overexpression (Agr2/Tg mice) (Figure S2A-D).http://www.ijbs.com
Int. J. Biol. Sci. 2021, Vol. 17Compared to the corresponding WT littermates,Agr2/Tg mice exhibited a noticeably increased fatweight gain or percent body fat when fed a HFD but837not when fed a NCD (Figure 1D, 1E and FigureS2E-H), demonstrating that AGR2 facilitates fatdeposition upon HFD feeding.Figure 1. AGR2 knockout reduces serum lipid levels and fat accumulation. The 8-week-old mice were fed a NCD or a HFD for an additional 10 weeks. A. Body weightof WT and Agr2 / mice during the 10 weeks of NCD feeding (n 5). B. Body weight, fat mass, lean body mass and fat percentage of WT and Agr2 / mice fed a NCD or a HFD(n 5). C. Body weight of WT and Agr2 / mice during the 10 weeks of HFD feeding (n 5). D. Body weight of WT and Agr2/Tg mice during the 10 weeks of HFD feeding (n 5).E. Body weight, fat mass, lean body mass and fat percentage of WT and Agr2/Tg mice fed a HFD (n 5). F. Adipose tissue staining and the diameter of adipocytes in WT and Agr2 / mice fed a NCD (top) or a HFD (bottom). G. Adipose tissue staining and the diameter of adipocytes in WT and Agr2/Tg mice fed NCD (top) or a HFD (bottom). H. Circulatinglipid profiles of WT and Agr2 / mice fed a NCD or a HFD (n 5). I. Circulating lipid profiles of WT and Agr2/Tg mice fed a NCD or a HFD (n 5). Representative figures weregenerated with data from at least three independent experiments. The data are presented as the mean SD values. *P 0.05, **P 0.01 by Student’s t test.http://www.ijbs.com
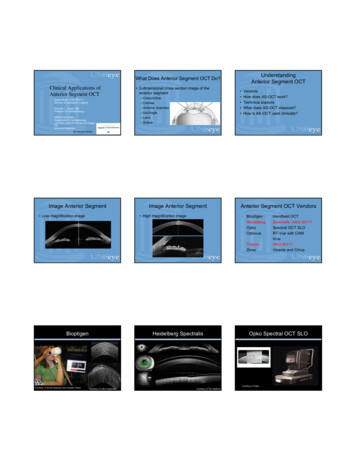
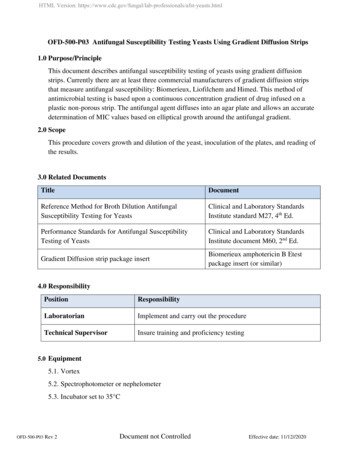
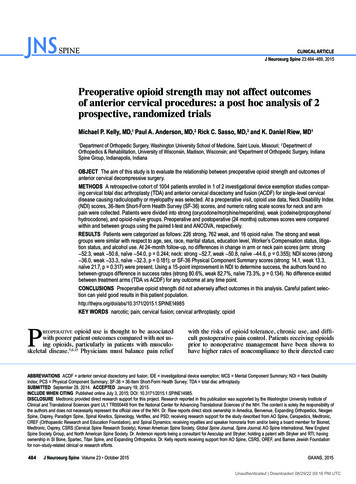
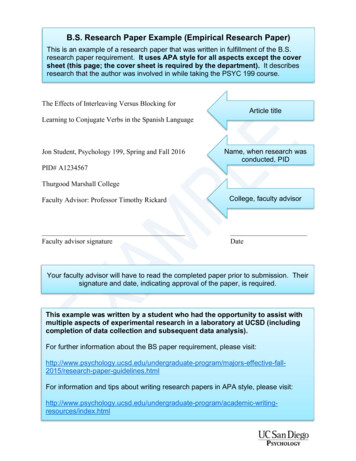
Int. J. Biol. Sci. 2021, Vol. 17We further analyzed the changes in adipocytes(epididymal white adipose tissue) in geneticallymodified mice. The immunostaining results showedthat the adipocytes in Agr2-/- mice were much smallerthan those in WT mice fed either a NCD or a HFD(Figure 1F). By contrast, the adipocyte diameter wasincreased in Agr2/Tg mice fed a HFD (Figure 1G),supporting the observations that AGR2 exerts aregulatory effect on fat metabolism.Since AGR2 is not expressed in adipocytes, wenext determined whether the AGR2-mediated effecton fat deposits has resulted from alterations in serumlipid levels. The results clearly showed that loss ofAGR2 efficiently reduced plasma triglyceride (TG),total cholesterol (TC) and low-density lipoproteincholesterol (LDL-C) levels (Figure 1H). TG levelsdecreased by 23% and 12%, TC levels by 42% and27%, and LDL-C levels by 41% and 22% in response toNCD and HFD feeding, respectively (Figure 1H).However, AGR2 depletion did not affect high-densitylipoprotein cholesterol (HDL-C) levels (Figure 1H). Bycontrast, plasma TG, TC, and LDL-C levels wereenhanced but the HDL-C level remained almostunchanged in Agr2/Tg mice under HFD feedingconditions (Figure 1I). Notably, plasma lipid levelswere not affected in Agr2/Tg mice fed a NCD (Figure1I), implying that a high level of AGR2 was unable toenhance lipid metabolism under NCD feedingconditions. Thus, AGR2 may regulate lipidmetabolism, which in turn affects fat storage.AGR2 deficiency impairs hepatic lipid synthesisConsidering the expression pattern of AGR2 intissues, we sought to determine whether the changesin plasma lipid levels could be ascribed to theregulatory effect of AGR2 on hepatic lipidmetabolism. Lipid (Oil Red O) staining of liversamples showed that lipid deposition wasprominently decreased in Agr2-/- mice compared tothe WT mice fed a NCD (Figure 2A). Importantly,hepatic lipid accumulation induced by HFD feedingwas dramatically alleviated in Agr2-/- mice, whereasextensive lipid storage was observed in WT mice(Figure 2A). Furthermore, the hepatic TG and TClevels in Agr2-/- mice were lower than those in WTmice, and this difference extended to mice fed a HFD(Figure 2B). By contrast, extensive accumulation ofhepatic lipids and the increased TG/TC levels wereobserved in Agr2/Tg mice challenged with HFDfeeding (Figure 2C, 2D). However, under NCDfeeding conditions, hepatic lipid accumulation inAgr2/Tg mice was indistinguishable from that in WTmice (Figure 2C, 2D).We further validated the effect of AGR2 on lipidmetabolism using mouse primary cells. The results838indicated that hepatic cells from Agr2-/- mice showedimpaired lipid droplet (LD) formation and reducedTG/TC levels in response to stearic acid (SA)compared with the primary liver cells from the WTmice (Figure 2E). Whereas the fluorescent activity ofLDs and TG/TC levels were significantly increased inAgr2/Tg primary liver cells exposed to SA than thatin WT mice (Figure 2F). Additionally, AGR2downregulation led to a significant decrease in lipidaccumulation and TG/TC levels in hepatocellularcarcinoma Huh7 cells (Figure 2G, 2H). While ectopicexpression of AGR2 but not the expression of thedominant-negative AGR2 mutant (AGR2-C81A, PDImotif mutation) greatly increased TG/TC levels andlipid accumulation (Figure 2I, 2J), highlighting theimportance of the PDI (amino acid residues 81-84,CPHS) activity of AGR2 in the regulation of lipidmetabolism. Thus, AGR2 is critical in the regulation ofhepatic lipid synthesis and deposition that maydepend on its PDI motif.AGR2 affects fatty acid uptake and ing AGR2-mediated regulation in lipidmechanism, we performed tandem mass tag(TMT)-based quantitative proteomics to analyzeprotein changes in the livers of Agr2-/- mice at 8 weeksof age. This proteomic analysis resulted in theidentification of 5196 proteins across 8 samples, fourfrom Agr2-/- mice and the others from WT mice.Unsupervised hierarchical clustering with Spearmancorrelation revealed a clear difference in the hepaticprotein profiles of Agr2-/- mice and WT mice (Figure3A). Further analysis led to the identification of 179proteins with a more than two-fold difference inexpression (P 0.05) upon AGR2 knockout (FigureS3A). GO classification and KEGG pathway analysisof differentially expressed proteins revealed thehighest enrichment in pathways such asoxidation-reduction process, lipid metabolic process,and steroid metabolic process (Figure 3B, 3C). Amongthese differentially expressed proteins, 36 proteinswere involved in the top metabolic pathway (Figure3C). We performed the analysis to identify proteinsthat are essential for the production of theseAGR2-mediated effects. Compared to those from WTmice, the samples from the livers of Agr2-/- mice werecharacterized by reduced expression of several genesassociated with fatty acid (FA) metabolism (Table 1and Figure 3D). For example, the expression ofFABP1, a liver-specific FABP important in FA uptakeand lipid accumulation, was significantly decreasedin response to AGR2 knockout. The expression ofmitochondrial enoyl-acyl-carrier-protein reductase(Mecr) [23], which catalyzes type II LCFA synthesis inhttp://www.ijbs.com
Int. J. Biol. Sci. 2021, Vol. 17mitochondria, and acetoacetyl-CoA synthetase(AACS), a ketone body-utilizing enzyme responsiblefor cholesterol and FA synthesis in the cytosol, wasreduced as well [24] (Table 1 and Figure 3D). Theexpression of insulin-induced gene 2 (Insig2), an ERmembrane protein that negatively controls TG and TCbiosynthesis [25], was markedly enhanced uponAGR2 depletion (Table 1 and Figure 3D). Notably,839both the expression and enzymatic activity of fattyacid synthase (FASN), the rate-limiting enzyme in denovo FA synthesis, remained unchanged in hepaticsamples from Agr2-/- mice (Figure 3D, 3E). Thesefindings suggest that protein/enzymes associatedwith LCFAs metabolism may be potential effectors ofAGR2 knockout.Figure 2. AGR2 promotes hepatic lipid synthesis. The 8-week-old mice were fed a NCD or a HFD for an additional 10 weeks. A. Lipid staining in liver tissue from WTand Agr2-/- mice fed a NCD (top) or a HFD (bottom). B. TG (top) and TC (bottom) contents in the livers of WT and Agr2-/- mice fed a NCD or a HFD (n 5). C. Lipid stainingin liver tissue from WT and Agr2/Tg mice fed a NCD (top) or a HFD (bottom). D. TG (top) and TC (bottom) contents in the livers of WT and Agr2/Tg mice fed a NCD or a HFD(n 5). E. Lipid droplet staining (left) and TG and TC contents (right) in primary hepatocytes in WT and Agr2-/- mice under normal conditions or under exposure to stearic acid.F. Lipid droplet staining (left) and TG and TC (right) in primary hepatocytes in WT and Agr2/Tg mice under normal conditions or under exposure to stearic acid. G. Lipid stainingin Huh7 cells treated with siRNA targeting AGR2. H. TG and TC contents in Huh7 cells treated with siRNA targeting AGR2. I. Lipid staining in HepG2 cells treated with AGR2and AGR2-C81A expression plasmids. J. TG and TC contents in HepG2 cells treated with AGR2 and AGR2-C81A expression plasmids. Representative figures were generatedwith data from at least three independent experiments. The data are presented as the mean SD values. *P 0.05 by Student’s t test.http://www.ijbs.com
Int. J. Biol. Sci. 2021, Vol. 17840Figure 3. AGR2 affects fatty acid uptake and utilization. A. Hierarchical clustering heatmaps of differentially expressed proteins between the livers of WT and Agr2-/mice. B. Results of GO term analysis of differentially expressed proteins between the livers of WT and Agr2-/- mice. C. Statistical results of analysis of the KEGG pathwaysassociated with the differentially expressed proteins between the livers of WT and Agr2-/- mice. D. Lipid metabolism gene expression in the livers of the 8-week-old WT and Agr2-/mice fed a NCD (n 3). E. Analysis of FASN activity in the cytoplasm in the livers of the 8-week-old WT and Agr2-/- mice fed a NCD (n 5). F. Western blot analysis of lipidmetabolism protein levels in the livers of the 8-week-old WT and Agr2-/- mice fed a NCD. Quantification was performed by normalizing proteins to β-actin. G.http://www.ijbs.com
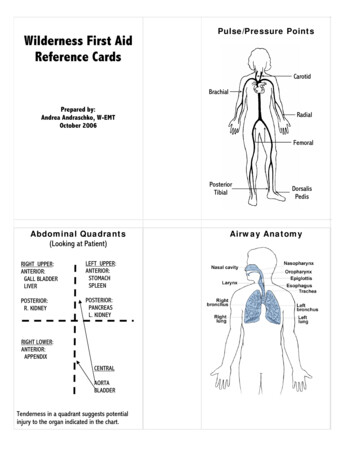
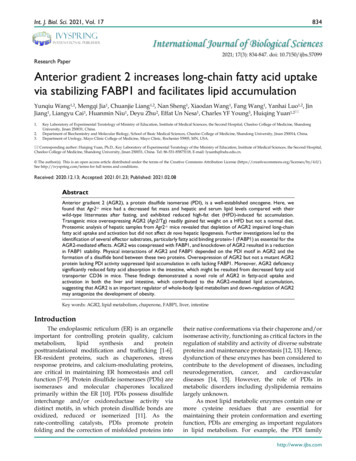
Int. J. Biol. Sci. 2021, Vol. 17841Immunohistochemical staining of FABP1, ACSL3 and ACSL5 in the livers of the 8-week-old WT and Agr2-/- mice fed a NCD. H. Western blot analysis of FABP1, ACSL3and ACSL5 in the livers of the 18-week-old WT and Agr2-/- mice fed a NCD. Quantification was performed by normalizing proteins to β-actin. I. Immunohistochemical stainingof FABP1, ACSL3 and ACSL5 in the livers of the 18-week-old WT and Agr2-/- mice fed a NCD. J. Western blot analysis of FABP1, ACSL3 and ACSL5 in the livers of 8-week-oldWT and Agr2/Tg mice fed a HFD for an additional 10 weeks. Quantification was performed by normalizing proteins to β-actin. K. Immunohistochemical staining of FABP1, ACSL3and ACSL5 in the livers of the 8-week-old WT and Agr2/Tg mice fed a HFD for an additional 10 weeks. L. Flow cytometric analysis of lipid absorption in primary hepatocytes fromWT and Agr2-/- mice. M. Flow cytometric analysis of lipid absorption in primary hepatocytes from WT and Agr2/Tg mice. N. Analysis of the ketone body content in the cytoplasmin the livers of 8-week-old WT and Agr2-/- mice fed a NCD or a HFD for an additional 10 weeks (n 5). Representative figures were generated with data from at least threeindependent experiments. The data are presented as the mean SD values. *P 0.05 by Student’s t test.Table 1. Differentially expressed proteins of lipid metabolismbetween the livers of WT and Agr2-/- miceProtein LRAP1CYP39A1ACOT2BSCL2INSIG2Fold 22751.24008171.24619471.38251451.4901663Therefore, we examined changes in proteinspotentially related to FA metabolism. The resultsindicated that FABP1 expression was predominantlydecreased in hepatic tissues of Agr2-/- mice comparedto WT mice either at 8 weeks or at 18 weeks (Figure3F-I). Activation of LCFAs by long-chain acyl-CoAsynthetases (ACSLs) is essential for their utilization incells [26]. Both ACSL3 and ACSL5 were slightlyaltered upon loss of AGR2 at 8 weeks of age in mice(Figure 3F, 3G), however, they significantly declinedin liver sections from Agr2-/- mice at 18 weeks (Figure3H, 3I), implicating that loss of AGR2 down-regulatedproteins associated with FA uptake and activationwith age. Moreover, an increase in FABP1 and ACSL5was clearly present in liver samples from Agr2/Tgmice compared to those from WT mice fed with HFD,while ACSL3 expression was marginally altered(Figure 3J, 3K), supporting the observations thatAGR2 exhibited an effect on FA metabolism. We nextdetermined whether AGR2 was associated withalterations in FA uptake. Primary hepatic cells fromeither Agr2-/- or Agr2/Tg mice were treated with thefluorescent LCFA analog boron-dipyrromethene(BODIPY), fluorescence activity in cells was measuredby flow cytometry. The results demonstrated thatreduced fluorescence was obviously observed inhepatic cells from Agr2-/- mice than that in WT mice(Figure 3L), whereas LCFA uptake was evidenced incells from the liver of Agr2/Tg mice (Figure 3M).Moreover, the ketone body content was markedlyincreased in hepatic tissues of Agr2-/- mice fed either aNCD or a HFD (Figure 3N), supporting the idea thatAGR2 knockout facilitates FA oxidation. In contrast,accumulation of acetyl-CoA in both the cytoplasmand mitochondria was evidenced upon AGR2overexpression in HepG2 cells, and reduced ketonebody production was observed in the livers ofAgr2/Tg mice (Figure S3B, S3C), confirming thefunction of AGR2 in FA metabolism.Taken together, AGR2 deficiency leads tosuppression of FA uptake and activation, whichmight be largely dependent on FABP1.AGR2-mediated effect on fatty acidmetabolism depends on FABP1We next determine whether FABPs and ACSLsare sufficient effector(s) for AGR2 mediated activityon FA metabolism. AGR2 deficiency suppressed theexpression of FABP1and FABP2, while ACSL3 andACSL5 slightly affected in Huh7 cells (Figure 4A).Overexpression of AGR2 increased the abundance ofFABP1 and FABP2, while had a moderate effect onACSL3 and ACSL5 (Figure 4A). Notably, theexpression of FABP1, FABP2, ACSL3, and ACSL5almost remained unchanged in cells overexpressingthe enzymatically inactive AGR2 (AGR2-C81A),indicating that the PDI motif in AGR2 is critical forregulation of these candidate proteins. TG productionanalysis was used to evaluate the involvement ofthese four proteins. The results showed that FABP1depletion exhibited more potent suppression on TGsynthesis than that of FABP2, ACSL3, and ACSL5,when AGR2 level was high in cells (Figure 4B-F),highlighting the importance of FABP1 in the deliveryeffect of AGR2. Given the significant response toAGR2, FABP1 is selected as a model for furtherinvestigation. As is shown in Figure 4E, FABP1knockdown significantly inhibited TG content andlipid-drop (LD) formation in primary hepatic cells. Anincrease in TG synthesis and LD formation wereshown in liver cells from Agr2/Tg mice, but thisenhancement was noticeably alleviated in the absenceof FABP1 (Figure 4F). Moreover, FABP1 depletionexacerbated the suppressive effect of AGR2 deficiencyon TG content and LD formation (Figure 4G). We alsofound that dominant-negative AGR2 (AGR2-C81A)lost its impact on FABP1 and TG accumulation(Figure 4H). Therefore, FABP1 plays an importantrole in the AGR2-mediated effect on lipidaccumulation.http://www.ijbs.com
Int. J. Biol. Sci. 2021, Vol. 17842Figure 4. AGR2-mediated effect on fatty acid metabolism depends on FABP1. A. Western blot analysis of lipid metabolism protein levels in whole-cell lysates fromHuh7 cells treated with siRNA targeting AGR2. Western blot analysis of lipid metabolism protein levels in whole-cell lysates from HepG2 cells treated with A
Quantitative proteomic analysis by TMT technology Livers from 8-week-old WT and Agr2-/-mice were collected into 2mL tubes, and SDT buffer was added to the sample. The lysate was homogenized in an MP homogenizer (24 2; two times at 6.0 M/S for 60 s each). The homogenate was sonicated and was then boiled for 15 min. After centrifugation at 14000