Transcription
Introduction to Tableau DesktopJock D. Mackinlayjmackinlay@tableausoftware.comCopyright 2003-2010 Tableau Software, Incorporated and its licensors. All rights reserved. Patents pending. Tableau Software, the TableauSoftware logo, Visual Analysis for Databases, and VizQL are either registered trademarks or trademarks of Tableau Software, Incorporated in theUnited States and/or other countries.
Databases: A Success Story 1960s: Many approaches Niche applications High costs 1970s: Relational databases emerge as a standard Rows of data organized into normalized tables High-level query language (SQL) Support parallel, transactional queries 1980s: Widespread adoption of OLTP technologyReprinted with the permission of The Nasdaq Stock Market, Inc. Photo credit: Peter Aaron/EstoCopyright 2003-2010 Tableau Software, Incorporated and its licensors.
Databases: A Success Story 1990s: Data warehousing enables analytic reporting Dimensional modeling and star schemas Multidimensional cubes & MDX 2000s: Ad hoc queries become mainstream Data warehouse appliances Column stores In-memory databasesCopyright 2003-2010 Tableau Software, Incorporated and its licensors.
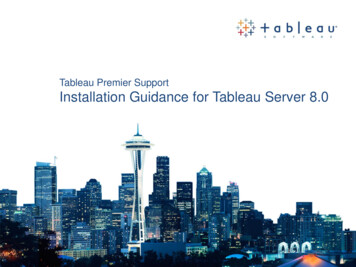
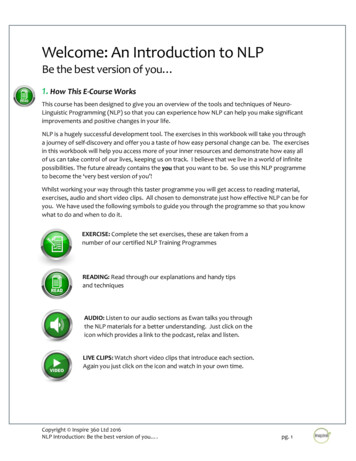
Visual Interfaces: Another Success 1981: Xerox StarFrom www.digibarn.comCopyright 2003-2010 Tableau Software, Incorporated and its licensors.
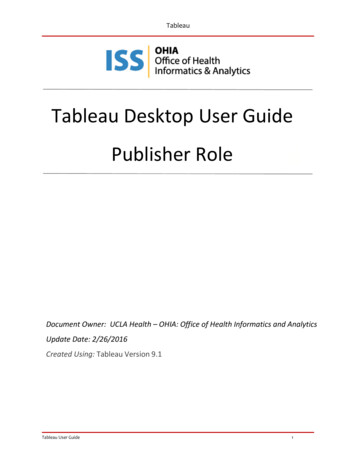
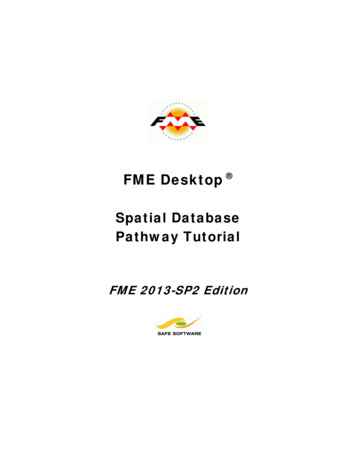
UnifiedNeed to be able to change both the data and the view:Traditional Reporting ToolsQuery many times and then generate a summary graph.Visual AnalysisIteratively change both to find the perfect view.Traditional Visualization ToolsversusQuery once and then iterate on the presentation of the data.Copyright 2003-2010 Tableau Software, Incorporated and its licensors.
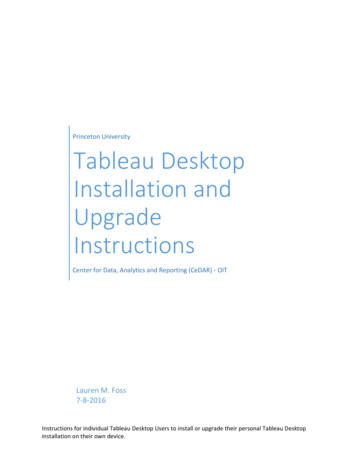
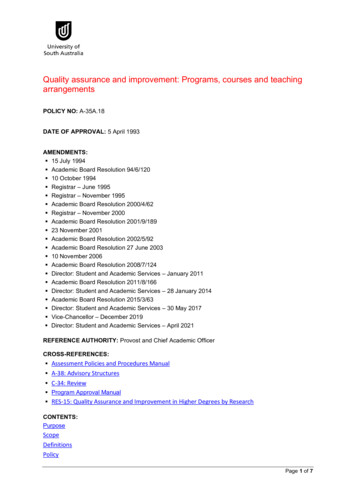
VizQL: Specifies Queries and Views Compiles into multiple query languages Generates many view typesVizQLQueryData InterpreterVisual InterpreterView Supports an intuitive “drag and drop” interfaceCopyright 2003-2010 Tableau Software, Incorporated and its licensors.
Cycle of Visual AnalysisAn unpredictable and cyclical process ofquestion-and-answer involving many tasks: Discovering structure Finding patterns and outliers Deriving causalrelationships etc.Copyright 2003-2010 Tableau Software, Incorporated and its licensors.
The Cycle of Visual AnalysisDataModelingVisualAnalysisSharingCopyright 2003-2010 Tableau Software, Incorporated and its licensors.
Typical DataDimensionsMeasuresCopyright 2003-2010 Tableau Software, Incorporated and its licensors.
Tableau DemoCopyright 2003-2010 Tableau Software, Incorporated and its licensors. All rights reserved. Patents pending. Tableau Software, the TableauSoftware logo, Visual Analysis for Databases, and VizQL are either registered trademarks or trademarks of Tableau Software, Incorporated in theUnited States and/or other countries.
More Information Tableau is hiring Seattle, WA San Mateo, CA Help menu in application Sample workbooks Links to help topics, community center, and video tours Web site www.tableausoftware.com Learning center training Community center support Database drivers Email jmackinlay@tableausoftware.comCopyright 2003-2010 Tableau Software, Incorporated and its licensors.
More Information Tableau is hiring Seattle, WA San Mateo, CA Help menu in application. Title: Slide 1 Author: Jock Mackinlay Created Date: 20100202174852Z