Transcription
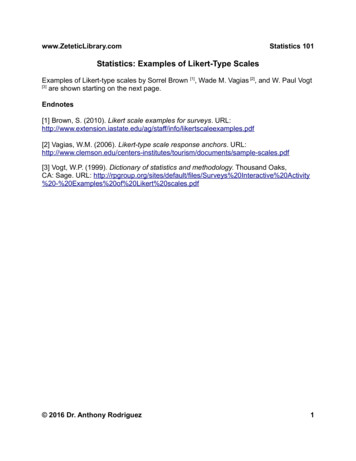
wwSTATISTICS BRIEFNovember 2010 - No. 15Figure 1. The impact of the global economic crisis on new enterprise creations inselected OECD countries – quarterly dataNumber of new enterprises, 2006 100, ed 06Further readingQ4-200612Q2-20068 .and employmentdynamism from firmbirth and deathThe recent global crisis has heightened interest in entrepreneurship as an essentialelement to foster economic recovery and employment growth throughout the world.But, in order to understand and promote entrepreneurship, government analystsand policymakers require sound statistical indicators, preferably comparableacross countries. The OECD-Eurostat Entrepreneurship Indicators Programme(EIP) develops measures of entrepreneurship with the aim of providing a solidfoundation for policy formulation and monitoring in this area. This issue of StatisticsBrief presents some of the key entrepreneurship indicators developed by theEIP, along with basic information on the methodologies for their collection, andQ3-20066 .for the analysis ofenterprise survivalby Mariarosa Lunati, Jeroen Meyer zu Schlochtern and Gueram SargsyanQ1-20066 Harmonisedbusiness demographydata.The OECD-Eurostat Entrepreneurship Indicators ProgrammeQ2-20065 and on businessclosuresMeasuring EntrepreneurshipQ1-20062 The impact of the crisison enterprise creationOrganisation for Economic Co-operation and Development
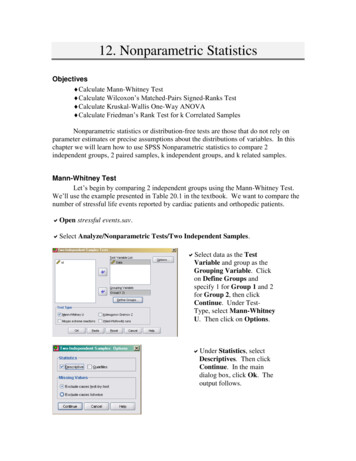
explains the policy context for their use. While theEIP collects different measures of entrepreneurship and its determinants, this Brief focuses onindicators based on business demography statistics. The first part focuses on recent statisticscollected from various national sources, while thesecond part presents indicators from the OECDStructural and Demographic Business Statisticsdatabase, which contains harmonised data fromofficial government statistics sources.quarterly data trends. It indicates that in 2008 thenumber of enterprises diminished in all countriesfor which data were available, except France. Thesize of the decrease, however, varied considerablyacross countries. The decline continued in 2009in most countries, though a few showed smallincreases. Only in Germany and Sweden did the2009 levels equal those of 2007. The differencesbetween yearly averages and quarterly profilesare related to the differences in the timing of thecrisis and recovery across countries.The impact of the crisis on enterprisecreationThe timely indicators database contains monthlyand quarterly data for the total economy andalso, for a number of countries, by industry. ThisSince new and young firms contribute criticallyto job creation, innovation and growth, observingrecent trends of firm formation provides valuableinformation to policy makers. The impacts of economic cycles on new firm creation can beanalysed through as up-to-date as possible dataon business demography. To facilitate the reviewand cross-country comparison of firm creationsensitivity to the business cycle, the EIP has builta database of timely data on enterprise creationsand destructions for selected countries whererecent data are available. As explained in Box1, which sets out the methodology for compilingthe “Timely Indicators” database, timely seriesare only reliable for direct comparisons acrosscountries in terms of trends, but not in levels. Withthis in mind, Figure 1 shows that the recent economic and financial crisis has had an importantimpact on the creation of new enterprises: aftera significant decrease in the second half of 2008,or earlier in some countries (e.g. Australia andSpain), the number of new enterprises started torecover around the first half of 2009, although notin Denmark and the United Stated. However, bythe second quarter of 2010, the number of newlycreated enterprises was still below its pre-crisislevel in most countries (except Australia, Franceand the United Kingdom). In many countries, thedecline in the creation of new enterprises occurredat the same time as the decline in real GDP.Figure 2. Change in new enterprise creations annual dataNumber of new enterprisesPercentage changes from previous yearSpainUKNew ndBelgiumAustria2009/08USAFinlandSwedenA comparison of annual changes by country (Figure 2) complements the insights from theStatistics Brief - November 2010 - No. 15Germany2008/07France-30.02-20.0-10.00.0
Timely Indicators of EntrepreneurshipMost of the OECD countries produce data on business demography on an annual basis. Data come fromnational business registers for statistical purposes, typically managed by National Statistical Offices(NSOs). These statistical business registers are compiled from information from various administrativerecords and surveys and both the quality and comprehensiveness of the data drawn from them arehigh. But often quality is achieved at the expense of timeliness, as data processing, cross-checkingand control take time. Yet, events such as the global economic crisis demand immediate access to up-to-date indicators. Policy analysts need to understand the impact of such events on entrepreneurshipand respond promptly with policy initiatives.Thus the EIP has supplemented its register-based data with a new set of timely indicators of entrepreneurship.The compilation process focuses on timeliness as the indicators are based on monthly and quarterlydata on enterprise creations and failures that are available through the internet. The sources used areamong those employed for business registers. For most countries, a single source is exploited; for firmcreation it is normally an administrative file or a register from a chamber of commerce; for firm closures,the source is mainly bankruptcy records.There are two important qualifications concerning the data collected through these alternative sources.First, since a single source is used, rather than the multiple sources used for national business registers,the population of enterprises is often incomplete. Depending on the country, the chosen single sourcemay not cover certain legal forms of enterprises (e.g., sole proprietor) or sectors of activity (e.g. agriculture or education) or enterprises below a certain turnover or employment threshold. Second, theconcepts of enterprise “creation” and “failure” reflected in the data series differ across countries. Someof the national sources selected for the timely indicators use the concept of creation, while others thatof enterprise birth. The latter concept is more restrictive as it refers to a legal entity that appears for thefirst time with no other enterprise involved in the creation process. It excludes firm creations resultingfrom mergers or changes of name, type of activity or ownership. The notions of failure are also different.The sources may record the opening of bankruptcy procedures or actual liquidations. Finally, attentionis drawn to specific data issues in three countries. In France, enterprise creations are recorded at thedate of the data treatment and not at the real date of enterprise creation; in Spain, the administrativesource includes new enterprises registered but non-active; and, for the United States, new creationsrefer to establishments and not to enterprises.To address the issues above, and before their inclusion in the database, a number of adjustments havebeen made to the series. In addition, the monthly and quarterly data have been seasonally adjusted.Metadata, explaining the characteristics and adjustments made to each single data series, are accessibleon the OECD website (http://www.oecd.org/dataoecd/60/15/46346883.pdf). Data can be found onlinein OECD . Stat: http://stats.oecd.org Industry and Services Timely Indicators of EnterpreneurshipWhile indicator levels are not strictly comparable across countries in the timely series, comparisons interms of trends and growth rates are valid. Trends in countries’ adjusted series on firm creation andbankruptcies show a remarkably similar pattern across countries.3November 2010 - No. 15 - Statistics Brief
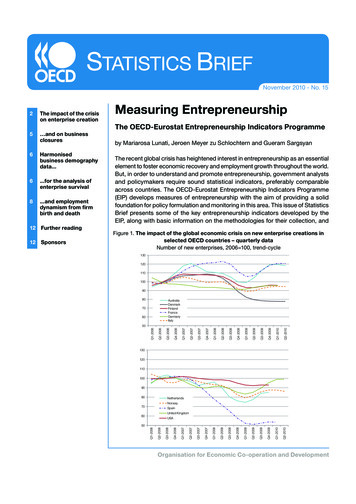
Table 1: Enterprise creations by activityyear-on-year growth rates in percentageFinlandActivitiesISIC rev. 4 / Nace rev. 2GermanyItalyNorwayUSA2009Q1/ 2010Q1/ 2009Q1/ 2010Q1/ 2009Q1/ 2010Q1/ 2009Q1/ 2010Q1/ 2009Q1/ 2009Q4/2008Q1 2009Q1 2008Q1 2009Q1 2008Q1 2009Q1 2008Q1 2009Q1 2008Q1 2008Q410 33: Manufacturing-22213-10-4-4-2411-4641 43: Construction-361863-16-7-3014-8445 47: Wholesale and retail trade; repair ofmotor vehicles and motorcycles-1324-2-15-1123-6-549 53: Transportation and storage-22-15-5-9-3-6-2920-6-23108-47-4-26-4-1258 63: Information and communication-10-5-74.44116-1164 66: Financial and insurance activities-19-16-6-112-3727-14-268: Real estate activities-26-4-5-5-21-2-3716-8-469 82: Professional, scientific, technicaland other business support activities-1143-5-34-75-2185 88: Education, health and social workactivities-9913-137-3-8210390 96: Arts, entertainment and other service activities-1068-3103-96-2-301 99: Grand Total-1424-2-94-1412-10255 56: Accommodation and food serviceactivitiesNotes:Italy:Change in the industry classification in 2009. ATECO 2002 has been replaced by ATECO 2007.USA:Derived from the 3-digit North American Industrial Classification System (NAICS)Figure 3. Number of bankruptcies - quarterly dataAverage 2006 100, 00NorwayDenmarkJapanUnited Kingdom250Statistics Brief - November 2010 - No. 06Q3300
CountriesSources of timely indicatorsAustralia»» Australian Securities & Investments Commission (ASIC) - New company registrations and Insolvency statistics (Companies entering externaladministration), Incorporated companies onlyAustria»» Wirtschaftskammer Österreich (WKO) - The Austrian Federal Economic ChamberBelgium»» SPF Economie, DGSIE, Dynamique de la population des entreprises - VAT registrationsDenmark»» The (Danish) Central Business Register (CVR) - Number of new registrations in market industries. Bankruptcy data are taken from The DanishOfficial Gazette (Statstidende) and the Statistical Business Register (Statistics Denmark). After the implementation of the registry-based method in2009 only bankruptcies of enterprises are counted, i.e. bankruptcies associated with a CVR number.Finland»» Statistics Finland’s Business Register - Number of enterprise “openings”. Bankruptcy cases instigated and decided by district courts (StatisticsFinland).France»» INSEE, SIRENE - Number of births. Data exclude registrations of self-employed in order to mitigate the bias due to the implementation in 2009 ofa new enterprise status (régime de l’auto-entrepreneur). Data on bankruptcies are coming from the BODACC (data processed by INSEE) and referto the openings of insolvency proceedings.Germany»» Statistiches Bundesamt - Destatis - Unternehmen und Arbeitsstätten, Gewerbeanzeigen, number of new establishments (main offices andsecondary establishments). All activities are taken into accountHungary»» Hungarian Central Statistical Office (HCSO/KSH) - Number of newly registered economic corporations and unincorporated enterprisesIceland»» Statistics Iceland - New registrations of limited liability companies and Insolvencies of Icelandic enterprises, including personal bankruptciesItaly»» InfoCamere, Movimprese - Business register of Italian Chambers of Commerce. Number of entries (iscritte)Japan»» Tokyo Shoko Research, Ltd., Business Failure News - Number of SME bankruptcies, Incorporated companies onlyNetherlands»» Centraal Bureau voor de Statistiek (CBS) - Business Register. Number of establisment births (Data are only available for Industry, trade andmarket services). Number of bankruptcies pronounced by Dutch courts (Excluding individuals without a sole proprietorship)Norway»» Statistics Norway - Number of newly established enterprises (excluding primary industries). Bankruptcy proceedings including personalbankruptciesPortugal»» Formation and dissolution of companies, Ministry of Justice - Incoporated companies onlySpain»» Instituto Nacional de Estadistica de Espana (INE) - The Mercantile Companies (MC), quarterly data are taken from the “Mercantile Companies”register which includes information on incorporated enterprises only. Annual data are taken from the Companies Central Directory (CCD)Sweden»» Swedish Agency for Growth Analysis and Statistics Sweden- Number of new enterprises (genuine new businesses i.e. births), Number ofbankruptciesUnited Kingdom»» Companies House - New registrations and Total insolvencies (Including compulsory liquidations, creditors’ voluntary liquidations, admin ordersconverted to Cred. Excluding Members’ voluntary liquidations). Incorporated companies onlyUnited States»» Bureau of Labor Statistics (BLS) - Business Employment Dynamics (BED), unemployment insurance (UI) records, number of establishments withat least one employee. United States Courts - Statistics on bankruptcy petition filings are provided by the United States Courts, total businessfilings (chapters 7, 11, 12 and 13)Detailed sources and definitions are available on the OECD website at: ows an assessment of impacts at the sectorallevel. The distribution by industrial activity of new enterprises did not change significantly during thecrisis. An exception is the construction industrywhose share of new enterprises decreased
Structural and Demographic Business Statistics database, which contains harmonised data from official government statistics sources. The impact of the crisis on enterprise creation Since new and young firms contribute critically to job creation, innovation and growth, observing recent trends of firm formation provides valuable information to policy makers. The impacts of economic cycles on new .