Transcription
Basic Concepts in Researchand Data AnalysisIntroduction: A Common Language for Researchers .2Steps to Follow When Conducting Research .3The Research Question . 3The Hypothesis . 4Defining the Instrument, Gathering Data, Analyzing Data, and Drawing Conclusions . 5Variables, Values, and Observations .6Variables. 6Values . 7Quantitative Variables versus Classification Variables . 7Observations . 7Scales of Measurement and JMP Modeling Types .9Nominal Scales . 9Ordinal Scales . 9Interval Scales.10Ratio Scales .11Modeling Types in JMP .12Basic Approaches to Research. 12Nonexperimental Research .12Experimental Research.13Descriptive versus Inferential Statistical Analysis . 16Descriptive Analyses: What Is a Parameter? .16Inferential Analyses: What Is a Statistic? .16
2 JMP for Basic Univariate and Multivariate Statistics: A Step-by-Step GuideHypothesis Testing . 17Types of Inferential Tests .18Types of Hypotheses .19The p Value.22Fixed Effects versus Random Effects .23Summary . 25References. 25Overview. This chapter reviews basic concepts and terminology from research design andstatistics. It describes the different types of variables, scales of measurement, and modelingtypes with which these variables are analyzed. The chapter reviews the differences betweennonexperimental and experimental research and the differences between descriptive andinferential analyses. Finally, it presents basic concepts in hypothesis testing. Aftercompleting this chapter, you should be familiar with the fundamental issues andterminology of data analysis, and be prepared to learn about using JMP for data analysis.Introduction: A Common Language for ResearchersResearch in the social sciences is a diverse topic. In part, this is because the socialsciences represent a wide variety of disciplines, including (but not limited to) psychology,sociology, political science, anthropology, communication, education, management, andeconomics. Further, within each discipline, researchers can use a number of differentmethods to conduct research. These methods can include unobtrusive observation,participant observation, case studies, interviews, focus groups, surveys, ex post factostudies, laboratory experiments, and field experiments.Despite this diversity in methods used and topics investigated, most social scienceresearch still shares a number of common characteristics. Regardless of field, mostresearch involves an investigator gathering data and performing analyses to determinewhat the data mean. In addition, most social scientists use a common language inconducting and reporting their research: researchers in psychology and managementspeak of “testing null hypotheses” and “obtaining significant p values.”The purpose of this chapter is to review some of the fundamental concepts and terms thatare shared across the social sciences. You should familiarize (or refamiliarize) yourself
Chapter 1: Basic Concepts in Research and Data Analysis 3with this material before proceeding to the subsequent chapters, as most of the termsintroduced here will be referred to again and again throughout the text. If you arecurrently taking your first course in statistics, this chapter provides an elementaryintroduction. If you have already completed a course in statistics, it provides a quickreview.Steps to Follow When Conducting ResearchThe specific steps to follow when conducting research depend, in part, on the topic ofinvestigation, where the researchers are in their overall program of research, and otherfactors. Nonetheless, it is accurate to say that much research in the social sciences followsa systematic course of action that begins with the statement of a research question andends with the researcher drawing conclusions about a null hypothesis. This sectiondescribes the research process as a planned sequence that consists of the following sixsteps:1. Developing a statement of the research question2. Developing a statement of the research hypothesis3. Defining the instrument (questionnaire, unobtrusive measures)4. Gathering the data5. Analyzing the data6. Drawing conclusions regarding the hypothesis.The preceding steps reference a fictitious research problem. Imagine that you have beenhired by a large insurance company to find ways of improving the productivity of itsinsurance agents. Specifically, the company would like you to find ways to increase thedollar amount of insurance policies sold by the average agent. You begin a program ofresearch to identify the determinants of agent productivity.The Research QuestionThe process of research often begins with an attempt to arrive at a clear statement of theresearch question (or questions). The research question is a statement of what you hope tohave learned by the time you complete the program of research. It is good practice torevise and refine the research question several times to ensure that you are very clearabout what it is you really want to know.
4 JMP for Basic Univariate and Multivariate Statistics: A Step-by-Step GuideFor example, in the present case, you might begin with the question“What is the difference between agents who sell more insurance and agents who sellless insurance?”An alternative question might be“What variables have a causal effect on the amount of insurance sold by agents?”Upon reflection, you realize that the insurance company really only wants to know whatthings management can do to cause the agents to sell more insurance. This realizationeliminates from consideration certain personality traits or demographic variables that arenot under management’s control, and substantially narrows the focus of the researchprogram. This narrowing, in turn, leads to a more specific statement of the researchquestion, such as“What variables under the control of management have a causal effect on the amountof insurance sold by agents?”Once you have defined the research question more clearly, you are in a better position todevelop a good hypothesis that provides an answer to the question.The HypothesisA hypothesis is a statement about the predicted relationships among events or variables.A good hypothesis in the present case might identify which specific variable has a causaleffect on the amount of insurance sold by agents. For example, the hypothesis mightpredict that the agents’ level of training has a positive effect on the amount of insurancesold. Or, it might predict that the agents’ level of motivation positively affects sales.In developing the hypothesis, you can be influenced by any of a number of sources, suchas an existing theory, related research, or even personal experience. Let’s assume that youare influenced by goal-setting theory. This theory states, among other things, that higherlevels of work performance are achieved when difficult work-related goals are set foremployees. Drawing on goal-setting theory, you now state the following hypothesis:“The difficulty of the goals that agents set for themselves is positively related to theamount of insurance they sell.”
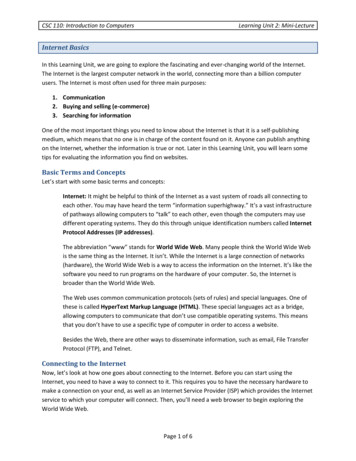
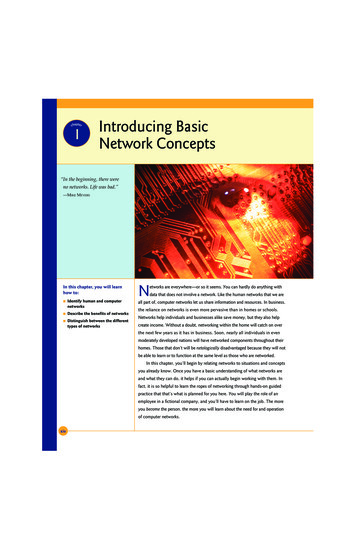
Chapter 1: Basic Concepts in Research and Data Analysis 5Notice how this statement satisfies the definition for a hypothesis: it is a statement aboutthe relationship between two variables. The first variable could be labeled GoalDifficulty, and the second, Amount of Insurance Sold. Figure 1.1 illustrates thisrelationship.Figure 1.1 Hypothesized Relationship between Goal Difficulty and Amountof Insurance SoldThe same hypothesis can also be stated in a number of other ways. For example, thefollowing hypothesis makes the same basic prediction:“Agents who set difficult goals for themselves sell greater amounts of insurance thanagents who do not set difficult goals.”Notice that these hypotheses have been stated in the present tense. It is also acceptable tostate hypotheses in the past tense. For example, the preceding could have been stated,“Agents who set difficult goals for themselves sold greater amounts of insurance thanagents who did not set difficult goals.”You should also note that these two hypotheses are quite broad in nature. In manyresearch situations, it is helpful to state hypotheses that are more specific in thepredictions they make. A more specific hypothesis for the present study might be,“Agents who score above 60 on the Smith Goal Difficulty Scale sell greater amountsof insurance than agents who score below 40 on the Smith Goal Difficulty Scale.”Defining the Instrument, Gathering Data, Analyzing Data, andDrawing ConclusionsWith the hypothesis stated, you can now test it by conducting a study in which you gatherand analyze some relevant data. Data can be defined as a collection of scores obtainedwhen a subject’s characteristics and/or performance are assessed. For example, you couldchoose to test your hypothesis by conducting a simple correlational study.
6 JMP for Basic Univariate and Multivariate Statistics: A Step-by-Step GuideSuppose you identify a group of 100 agents and determine the difficulty of the goals set for each agent the amount of insurance sold by each agent.Different types of instruments result in different types of data. For example, aquestionnaire can assess goal difficulty, but company records measure amount ofinsurance sold. Once the data are gathered, each agent has one score that indicatesdifficulty of the goals, and a second score that indicates the amount of insurance the agentsold.With the data gathered, an analysis helps tell if the agents with the more difficult goalsdid, in fact, sell more insurance. If yes, the study lends some support to your hypothesis;if no, it fails to provide support. In either case, you can draw conclusions regarding thetenability of the hypotheses, and you have made some progress toward answering yourresearch question. The information learned in the current study might then stimulate newquestions or new hypotheses for subsequent studies, and the cycle repeats. For example,if you obtained support for your hypothesis with the current correlational study, youcould follow it up with a study using a different method, perhaps an experimental study.The difference between correlational and experimental studies is described later. Overtime, a body of research evidence accumulates, and researchers can review this body todraw general conclusions about the determinants of insurance sales.Variables, Values, and ObservationsWhen discussing data, you often hear the terms variables, values, and observations. It isimportant to have these terms clearly defined.VariablesFor the type of research discussed here, a variable refers to some specific characteristicof a subject that assumes one or more different values. For the subjects in the study justdescribed, amount of insurance sold is an example of a variable—some subjects sold a lotof insurance and others sold less. A different variable was goal difficulty—some subjectshad more difficult goals, while others had less difficult goals. Age was a third variable,and gender (male or female) was yet another.
Chapter 1: Basic Concepts in Research and Data Analysis 7ValuesA value refers to either a subject’s relative standing on a quantitative variable, or asubject’s classification within a classification variable. For example, Amount ofInsurance Sold is a quantitative variable that can assume many values. One agent mightsell 2,000,000 worth of insurance in one year, another sell 100,000 worth of policies,and another sell nothing ( 0). Age is another quantitative variable that assumes a widevariety of values. In the sample shown in Table 1.1, these values ranged from a low of 22years to a high of 56 years.Quantitative Variables versus Classification VariablesYou can see that, in both amount of insurance sold and age, a given value is a type ofscore that indicates where the subject stands on the variable of interest. The word “score”is an appropriate substitute for the word “value” in these cases because both arequantitative variables. They are variables in which numbers serve as values.A different type of variable is a classification variable, also called a qualitative variableor categorical variable. With classification variables, different values represent differentgroups to which the subject belongs. Gender is a good example of a classificationvariable, as it assumes only one of two values—a subject is classified as either male orfemale. Race is another example of a classification variable, but it can assume a largernumber of values—a subject can be classified as Caucasian American, African American,or Asian American, or as belonging to another group. These variables are classificationvariables and not quantitative variables because values only represent group membership;they do not represent a characteristic that some subjects possess in greater quantity thanothers.ObservationsIn discussing data, researchers often make references to observational units (orobservations), which can be defined as the individual subjects (or other objects) thatserve as the source of the data. Within the social sciences, a person is usually theobservational unit under study (although it is also possible to use some other entity, suchas an individual school or organization, as the observational unit). In this text, the personis the observational unit in all examples. Researchers often refer to the number ofobservations (or cases) included in their data, which simply refers to the number ofsubjects who were studied. For a more concrete illustration of the concepts discussed sofar, consider the data in Table 1.1.
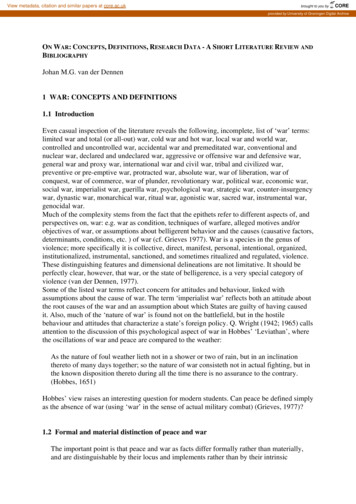
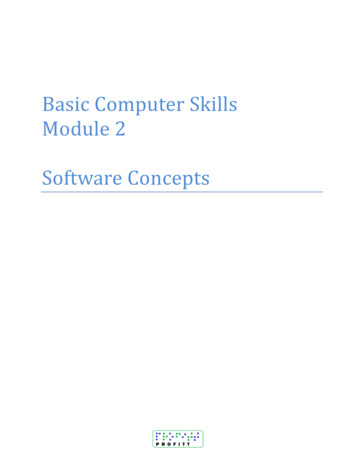
8 JMP for Basic Univariate and Multivariate Statistics: A Step-by-Step GuideTable 1.1 Insurance Sales DataObservation 214356 598,243 367,342 254,998 80,344 40,172 0This table reports information about six research subjects: Bob, Walt, Jane, Susan, Jim,and Mack—the data table includes six observations. Information about a givenobservation (subject) appears as a row running from left to right across the table. The firstcolumn of the data set (running vertically) indicates the observation number, and thesecond column reports the name of the subject who constitutes or identifies thatobservation. The remaining five columns report information on the five researchvariables under study. The Gender column reports subject gender, which assumes either “M” for male or “F”for female. The Age column reports the subject’s age in years. The Goal Difficulty Score column reports the subject’s score on a fictitious goaldifficulty scale. Assume that each participant completed a 20-item questionnaire thatassessed the difficulty of the work goals. Depending on how they respond to thequestionnaire, subjects receive a score that can range from a low of 0 (meaning thatthe subject’s work goals are quite easy to achieve) to a high of 100 (meaning that theyare quite difficult to achieve). The Rank column shows how the supervisor ranked the subjects according to theiroverall effectiveness as agents. A rank of 1 represents the most effective agent, and arank of 6 represents the least effective. The Sales column lists the amount of insurance sold by each agent (in dollars) duringthe most recent year.The preceding example illustrates a very small data table with six observations and fiveresearch variables (Gender, Age, Goal Difficulty, Rank, and Sales). Gender is aclassification variable and the others are quantitative variables. The numbers or lettersthat appear within a column represent some of the values that these variables can have.
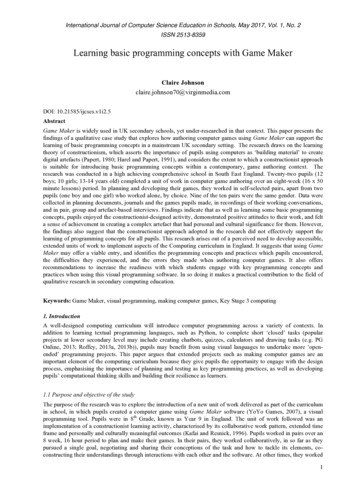
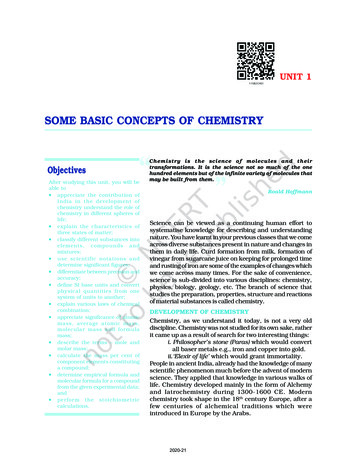
Chapter 1: Basic Concepts in Research and Data Analysis 9Scales of Measurement and JMP Modeling TypesOne of the most important schemes for classifying a variable involves its scale ofmeasurement. Researchers generally discuss four scales of measurement: nominal,ordinal, interval, and ratio. In JMP, scales of measurement are designated using threemodeling types. Modeling types are discussed later, in the section “Modeling Types inJMP.”Before analyzing a data set, it is important to determine each variable’s scale ofmeasurement (modeling type) because certain types of statistical procedures requirecertain scales of measurement. For example, one-way analysis of variance generallyrequires that the independent variable be a nominal-level variable and the dependentvariable be an interval or ratio (continuous) variable. In this text, each chapter that dealswith a specific statistical procedure indicates what scale of measurement is required bythe variables under study. Then, you must decide whether your variables meet theserequirements.Nominal ScalesA nominal scale is a classification system that places people, objects, or other entities intomutually exclusive categories. A variable measured using a nominal scale is aclassification variable that indicates the group to which each subject belongs. Theexamples of classification variables provided earlier (Gender and Race) also serve asexamples of nominal variables. They tell us to which group a subject belongs, but they donot provide any quantitative information about the subjects. That is, the Gender variablemight tell us that some subjects are males and other are females, but it does not tell usthat some subjects possess more of a specific characteristic relative to others. However,the remaining three scales of measurement provide some quantitative information.Ordinal ScalesValues on an ordinal scale represent the rank order of the subjects with respect to thevariable being assessed. For example, the preceding table includes one variable calledRank that represents the rank ordering of subjects according to their overall effectivenessas agents. The values on this ordinal scale represent a hierarchy of levels with respect tothe construct of effectiveness. That is, we know that the agent ranked “1” was perceivedas being more effective than the agent ranked “2,” that the agent ranked “2” was moreeffective than the one ranked “3,” and so forth.
10 JMP for Basic Univariate and Multivariate Statistics: A Step-by-Step GuideCaution: An ordinal scale has a limitation, in that equal differences in scalevalues do not necessarily have equal quantitative meaning. For example,look at the following ce that Walt is ranked “1” while Bob is ranked “2.” The rank difference betweenthese two rankings is 1 (2 – 1 1), so there is one unit of rank difference between Waltand Bob. Now notice that Jim is ranked “5” while Mack is ranked “6.” The rankdifference between them is also 1 (6 – 5 1), so there is also 1 unit of difference betweenJim and Mack. Putting the two together, the rank difference between Walt and Bob isequal to the rank difference between Jim and Mack. However, that does not necessarilymean that the difference in overall effectiveness between Walt and Bob is equal to thedifference in overall effectiveness between Jim and Mack. It is possible that Walt is justbarely superior to Bob in effectiveness, while Jim is substantially superior to Mack.These rankings reveal very little about the quantitative differences between the subjectswith regard to the underlying construct (effectiveness, in this case). An ordinal scalesimply provides a rank order of the subjects.Interval ScalesWith an interval scale, equal differences between scale values do have equal quantitativemeaning. For this reason, an interval scale provides more quantitative information thanthe ordinal scale. A good example of an interval scale is the Fahrenheit degree scale usedto measure temperature. With the Fahrenheit scale, the difference between 70 degrees and75 degrees is equal to the difference between 80 degrees and 85 degrees: The units ofmeasurement are equal throughout the full range of the scale.However, the interval scale also has an important limitation: it does not have a true zeropoint. A true zero point means that a value of zero on the scale represents zero quantity ofthe construct being assessed. The Fahrenheit scale does not have a true zero point. Whena Fahrenheit thermometer reads 0 degrees, that does not mean there is absolutely no heatpresent in the environment.
Chapter 1: Basic Concepts in Research and Data Analysis 11Researchers in the social sciences often assume that many of their man-made variablesare measured on an interval scale. For example, in the preceding study involvinginsurance agents, you probably assume that scores from the goal difficulty questionnaireconstitute an interval-level scale. That is, you assume that the difference between a scoreof 50 and 60 is approximately equal to the difference between a score of 70 and 80. Manyresearchers also assume that scores from an instrument such as an intelligence test aremeasured at the interval level of measurement.On the other hand, some researchers are skeptical that instruments such as these have trueequal-interval properties, and prefer to call them quasi-interval scales. Disagreementabout the level of measurement achieved with such instruments continues to be acontroversial topic within the social sciences.However, it is clear that neither of the preceding instruments has a true zero. A score of 0on the goal difficulty scale does not indicate the complete absence of goal difficulty, anda score of 0 on an intelligence test does not indicate the complete absence of intelligence.A true zero point is found only with variables measured on a ratio scale.Ratio ScalesRatio scales are similar to interval scales in that equal differences between scale valueshave equal quantitative meaning. However, ratio scales also have a true zero point, whichgives them an additional property. With ratio scales, it is possible to make meaningfulstatements about the ratios between scale values. For example, the system of inches usedwith a common ruler is an example of a ratio scale. There is a true zero point becausezero inches does in fact indicate a complete absence of length. With this scale, it ispossible to make meaningful statements about ratios. It is appropriate to say that anobject four inches long is twice as long as an object two inches long. Age, as measured inyears, is also on a ratio scale—a 10-year-old house is twice as old as a 5-year-old house.Notice that it is not possible to make these statements about ratios with the interval-levelvariables discussed above. You would not say that a person with an IQ of 160 is twice asintelligent as a person with an IQ of 80 because there is no true zero point on the IQscale.Although ratio-level scales might be easiest to find in the physical properties of objects,such as height and weight, they are also common in the type of research discussed in thismanual. For example, the study discussed previously included the variables for age andamount of insurance sold (in dollars). Both of these have true zero points, and aremeasured as ratio scales.
12 JMP for Basic Univariate and Multivariate Statistics: A Step-by-Step GuideModeling Types in JMPIn JMP, each variable has a modeling type that designates its scale of measurement. In aJMP analysis, the modeling types of the variables convey their scale of measurement.The JMP modeling types are called nominal, ordinal, and continuous. Nominal andordinal modeling types have the same characteristics as those described above for thesame scales of measurement. The continuous modeling type in JMP encompasses thecharacteristics of both the ratio and interval scales of measurement. Modeling types areused by JMP analysis platforms to help determine the correct analysis that needs to bedone.The discussions that follow refer to JMP modeling types, which are discussed in detail inChapter 3, “Working with JMP Data.”Basic Approaches to ResearchNonexperimental ResearchMuch research can be described as being either nonexperimental or experimental innature. In nonexperimental research (also called nonmanipulative, correlational, orobservational research), the researcher studies the naturally occurring relationshipbetween two or more naturally occurring variables. A naturally occurring variable is avariable that is not manipulated or controlled by the researcher. It is measured as itnormally exists.The insurance study described previously is a good example of nonexperimental researchin that you measured two naturally occurring variables (goal difficulty and amount ofinsurance sold) to determine whether they were related. Another example ofnonexperimental research would be an investigation of the relationship between IQ andcollege grade point average (GPA).With nonexperimental designs, researchers sometimes refer to response variables andpredictor variables. A response variable is an outcome variable or criterion variable, whose values youwant to predict from one or more predictor variables. The response variable is oftenthe main focus of a study because it is mentioned in the statement of the researchproblem. In the previous example, the response variable is Amount of Insurance Sold.In some experimental research, the response variable is also called the dependentvariable.
Chapter 1: Basic Concepts in Research and Data Analysis 13 A predictor variable is the variable used to predict values of the response. In somestudies, you might even believe that the predictor variable has a causal effect on theresponse. In the insurance study, for example, the predictor variable was GoalDifficulty. Because you believed that Goal Difficulty could positively affect insurancesales, you conducted a study in which Goal Difficulty was the predictor and Sales wasthe response. You do not necessarily have to believe that there is a causal relationshipbetween two variables to conduct a study such as this—you might only be interestedin determining whether it is possible to predict one variable from the other. Inexperimental research, the predictor variable is also known as the independentvariable.Notice that nonexperimental research, which investigates the relationship between justtwo variables, does not provide evidence concerning cause-and-effect relationships. Thereason for this can be seen by reviewing the insurance sales study. If a psychologistconducts this study and finds that the agents with the more difficult goals also tend to sellmore insurance, it is not necessarily true that having difficult goals causes them to sellmore insurance. Perhaps selling a lot of insurance increases the agents’ self-confidence,and this causes them to set higher work goals for themselves. Under this second scenario,it is the insurance sales that had a causal effect on goal difficulty.As this example shows, with nonexperimental research it is often possible to obtain asingle result that is consistent with a number of contradictory causal explanations. Hence,a strong inference that variable A had a causal effect on variable B is rarely if ever validwhen you conduct simple correlational research with just two variables. To obtainstronger evidence of cause and effect, researchers either analyze the relationshipsbetween a larger number of variables using sophisticated statistical procedures that arebeyond the scope of this text, or drop the nonexperimental approach entirely and useexperimental research methods instead. The nature of experimental research is discussedin the following section.Experimental ResearchMost experimental research can be identified by three important characteristics: Subjects are randomly assigned to experimental conditions. The researc
6 JMP for Basic Univariate and Multivariate Statistics: A Step-by-Step Guide Suppose you identify a group of 100 agents and determine the difficulty of the goals set for each agent the amount of insurance sold by each agent. Different types of inst