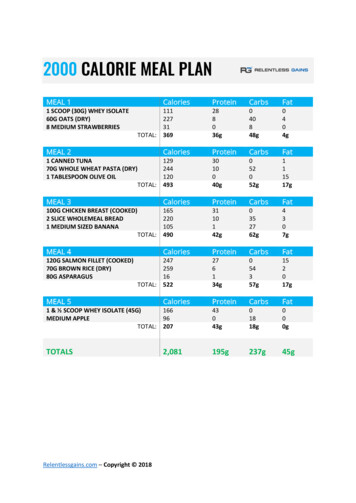
Transcription
PROGRESS ON HOUSEHOLDDRINKING WATER,SANITATION AND HYGIENE2000-2020FIVE YEARSINTO THE SDGsWHO/UNICEF JOINT MONITORING PROGRAMME FOR WATER SUPPLY, SANITATION AND HYGIENE
HighlightsFive years into the SDGsThe World Health Organization andUnited Nations Children’s Fund (WHO/UNICEF) Joint Monitoring Programmefor Water Supply, Sanitation andHygiene (JMP) produces internationallycomparable estimates of progresson drinking water, sanitation andhygiene (WASH) and is responsible forglobal monitoring of the SustainableDevelopment Goal (SDG) targets relatedto WASH. In 2020, the JMP releasedupdated estimates for WASH in schoolsand WASH in health care facilities(2000-2019). This report presentsupdated national, regional and globalestimates for WASH in households forthe period 2000 to 2020 and takesstock of progress five years into theSDG period (2015-2020).6WHO UNICEF JMPThe 2030 Agenda for SustainableDevelopment called for ‘ensuringavailability and sustainable managementof water and sanitation for all’ underSDG 6, and established ambitiousindicators for WASH services undertargets 6.1 and 6.2. While the numberof countries with estimates availablefor the new SDG global indicatorshas increased with each JMP progressupdate, many still only have a smallnumber of data points, making it difficultto assess trends. However, we nowhave enough data to begin to assess theprospects for achieving the SDG targets.This report extrapolates estimates basedon existing trends to illustrate currenttrajectories and the acceleration requiredto achieve universal coverage by 2030.PROGRESS ON HOUSEHOLD DRINKING WATER, SANITATION AND HYGIENE 2000-2020
Achieving SDG WASH targets by 2030 will require a quadrupling of current rates of progressDRINKING YGIENE 991004x904x80787370676760Population (%)60716054474040402020200201502020BasicFIGURE 120252030Safely managed201502020No open defecation2025Basic20302015Safely managed202020252030BasicGlobal coverage of WASH services, 2015-2020 (%), and acceleration required to meet targets by 2030Five years into the SDGs, the worldis not on track to achieve SDGtargets 6.1 and 6.2. Achievinguniversal coverage by 2030 willrequire a quadrupling of currentrates of progress in safely manageddrinking water services, safelymanaged sanitation services, andbasic hygiene services (Figure 1).Least developed countries (LDCs)have the furthest to go and itwill be especially challenging toaccelerate progress in fragilecontexts1. Many more countriesare facing challenges in extendingservices to rural areas and to poorand vulnerable populations who aremost at risk of being left behind.1As of May 2021, the OECD States of Fragility seriesidentifies 57 fragile contexts, including 13 that are classifiedas extremely fragile. Source: 770-en.htm HIGHLIGHTS7
DRINKING WATERFrom 2015 to 2020In 2020 The proportion of the global population using safelymanaged services increased from 70% to 74%, ruralcoverage increased from 53% to 60%, and urbancoverage increased from 85% to 86%. 2 billion people lacked safely managed services,including 1.2 billion people with basic services,282 million with limited services, 367 million usingunimproved sources, and 122 million drinkingsurface water. The number of people without safely managed servicesdecreased by 193 million, decreasing by 225 million inrural areas but increasing by 32 million in urban areas.One in four people lackedsafely managed drinkingwater services in 20202638018 138 countries and five out of eight SDG regions hadestimates for safely managed services, representing45% of the global population. The number of countries with estimates available forSDG 6.1.1 increased from 96 to 138, and the proportionof the global population with data available increasedfrom 34% to 45%. Latin America and the Caribbeanrecorded the biggest increase in data coverage. 84 countries had achieved universal ( 99%) accessto at least basic services, including 30 countries thathad achieved universal access to safely managedservices. On average, use of safely managed services increasedby 0.63 percentage points per year (% pts/yr) at thenational level, 0.89 % pts/yr in rural areas and 0.06 %pts/yr in urban areas. 16 countries are on track to reach universal accessto safely managed services, and 34 countries areon track to reach universal access to at least basicdrinking water between 2020 and 2030. Achieving universal access to safely managed servicesby 2030 will require a 4x increase in current rates ofprogress (10x in LDCs and 23x in fragile contexts). People living in fragile contexts were twice as likelyto lack safely managed services as those living innon-fragile contexts. At current rates of progress, the world will only reach81% coverage by 2030, leaving 1.6 billion peoplewithout safely managed services. Eight out of ten people who still lacked even basicservices lived in rural areas. Around half of themlived in LDCs.254100Surface waterUnimprovedLimitedBasicSafely managed166040707420020152020FIGURE 2Global drinking water coverage,2015-2020 (%)Five SDG regions had estimates for safely managed drinking water services in 16182139231100 Countries2015Europe andNorthernAmerica2020NorthernAfrica andWestern Asia2015Latin Americaand theCaribbean2020Central andSouthern AsiaSub-SaharanAfricaFIGURE 3201515857332020413943027201575935938383Surface waterUnimprovedLimitedBasicSafely managed32752002141Australia andNew Zealand4096161Eastern 152020Small ntexts101441647LeastDevelopedCountries100Regional drinking water coverage, 2015-2020 (%)In 2020, 138 countries2 had estimates for safely managed drinking water services2 20-2525-5050-7575-99 99Insufficient dataNot applicable2The JMP producesinternationallycomparable estimatesfor 234 countries,areas and territories,including all UnitedNations Member States.Statistics in this reportrefer to countries, areasand territories.FIGURE 48Proportion of population using safely managed drinking water services, 2020 (%)WHO UNICEF JMPPROGRESS ON HOUSEHOLD DRINKING WATER, SANITATION AND HYGIENE 2000-2020
SANITATIONFrom 2015 to 2020In 2020 The proportion of the global population using safelymanaged services increased from 47% to 54%, ruralcoverage increased from 36% to 44%, and urbancoverage increased from 57% to 62%. 3.6 billion people lacked safely managedservices, including 1.9 billion people with basicservices, 580 million with limited services, 616million using unimproved facilities, and 494million practising open defecation. The population practising open defecation decreasedby a third, from 739 million people to 494 million.85% of this drop occurred in rural areas. The number of countries with estimates availablefor safely managed services increased from 84 to120, and the global population with data availableincreased from 48% to 81%.Nearly half the world’s populationlacked safely managed sanitationservices in 2020100 120 countries and seven out of eight SDGregions had estimates for safely managedservices, representing 81% of the globalpopulation. On average, use of safely managed servicesincreased by 1.27 percentage points per year (%pts/yr) at the national level, 1.48 % pts/yr in ruralareas, and 0.84 % pts/yr in urban areas.47200 Two thirds of people who still lacked even basicservices lived in rural areas. Nearly half of themlived in sub-Saharan Africa. At current rates of progress, the world will onlyreach 67% coverage by 2030, leaving 2.8 billionpeople without safely managed services.262440 Eight countries are on track to reach universalaccess to safely managed services, and 26countries are on track to reach universal accessto at least basic services between 2020 and 2030. Achieving universal access to safely managedservices by 2030 will require a 4x increase incurrent rates of progress (15x in LDCs and 9x infragile contexts).7760 62 countries had achieved universal ( 99%)access to at least basic services, including eightcountries that had achieved universal access tosafely managed services.81080Open defecationUnimprovedLimitedBasicSafely managed6105420152020FIGURE 5 92% of the population practising opendefecation lived in rural areas.Global sanitation coverage,2015-2020 (%)Seven SDG regions had estimates for safely managed sanitation services in 20204643635806023 1273131585549473941224302902402102121202031351114 1547 4632FIGURE 63128202020157845104935 352020201520201520152020201520202015202010161124 26201520201616 138815 15301125142414293131 3320159151220209Open defecationUnimprovedLimitedBasicSafely nia20204276Europe andNorthernAmerica20153771Australia andNew Zealand20203447Eastern ntral andSouthern Asia1960NorthernAfrica andWestern Asia1119Latin Americaand theCaribbean2018212521401668 68202020152020Small dlockedDevelopingCountries100Regional sanitation coverage, 2015-2020 (%)In 2020, 120 countries had estimates for safely managed sanitation services0-2525-5050-7575-99 99Insufficient dataNot applicableFIGURE 7HIGHLIGHTSProportion of population using safely managed sanitation services, 2020 (%)9
HYGIENEFrom 2015 to 2020In 2020 The proportion of the global population with basic handwashing facilities withsoap and water at home increased from 67% to 71%. 71% of the global population had basic handwashing facilities withsoap and water at home. The number of people lacking basic services decreased from 2.4 billion to 2.3billion. 2.3 billion people lacked basic services, including 670 millionpeople with no handwashing facilities at all. Over half of thesepeople (374 million) lived in fragile contexts. The population with basic services increased by an average of 0.69 percentagepoints per year (% pts/yr). The rate of increase was greater in rural areas, at 1.08% pts/yr. There were not enough data to make global estimates for urban areas. 79 countries and four out of eight SDG regions had estimates forbasic services, representing 50% of the global population. Four countries had already achieved universal ( 99%) access tobasic services, and six countries were on track to reach universalaccess between 2020 and 2030. The number of countries with estimates available for basic services increasedfrom 70 to 79, and the proportion of the global population with data availableincreased from 30% to 50%. Central and Southern Asia recorded the biggestincrease in data coverage, followed by Oceania. Most high-income countries lacked data on the availability ofhandwashing facilities with soap and water at home. Achieving universal access to basic services by 2030 will require a 4x increase incurrent rates of progress (7x in LDCs and 5x in fragile contexts). In 16 countries, the gap in basic hygiene coverage between urbanand rural areas was more than 20 % pts, and in 12 countries, thegap between highest and lowest sub-national region was more than50 % pts. At current rates of progress, the world will only reach 78% coverage in 2030,leaving 1.9 billion people without basic services.2321No facilityLimitedBasic606108035343536313729 272828 28402502015262020Sub-SaharanAfrica2020FIGURE 8Global handwashingcoverage, 2015-2020 (%)39288423 203124 2837 373735 354853 529165 6920201529FIGURE tries674023 21346020034NorthernAfrica andWestern Asia40100432015202020152020Small IslandDevelopingStates9Central andSouthern Asia809Oceania100Four SDG regions had estimates for basic hygiene services in 2020FragilecontextsSeven out of ten people hadbasic hygiene services in 2020Regional handwashing coverage, 2015-2020 (%)Note: For Northern Africa and Western Asia, limited and no service levels for 2020 were projected based on 2018 estimates.In 2020, 79 countries had estimates for basic hygiene services0-2525-5050-7575-99 99Insufficient dataNot applicableFIGURE 1010Proportion of population with basic hygiene services, 2020 (%)WHO UNICEF JMPPROGRESS ON HOUSEHOLD DRINKING WATER, SANITATION AND HYGIENE 2000-2020
MENSTRUAL HEALTHEmerging data and indicators on menstrual health SDG target 6.2 calls for ‘special attention to the needs of women and girls’ andWASH programmes are increasingly monitoring menstrual health-related needs.The JMP has expanded its global database to include emerging national data onmenstrual health. National data on these menstrual health indicators have been collectedfrom 42 countries, 29 of which had some information on at least three ofthe indicators. Nearly half (19) of the 42 countries with national data on the menstrualhealth indicators are in the sub-Saharan Africa region, and the majorityare either low-income (13) or lower-middle-income countries (18). Nohigh-income countries had national data on any of the four menstrualhealth indicators. New indicators related to menstrual health and associated WASH service needshave been progressively included in household survey questionnaires for womenand girls age 15 to 49, and can be grouped as follows:› Awareness of menstruation before menarche (first menstruation).› Use of menstrual materials to capture and contain menstrual blood, such aspads, cloths, tampons or cups. These can also be grouped into single-use andreusable materials.› Access to a private place to wash and change while at home.› Participation in activities during menstruation, such as school, work and socialactivities. Only two countries had national data on awareness of menstruation beforemenarche; 32% and 66% of girls were aware of menstruation before theirfirst period in Bangladesh and Egypt, respectively. Emerging data show in many countries a significant proportion of womenand girls do not have the services they need for menstrual health andthere are often substantial disparities between population sub-groups,particularly between sub-national regions and for women and girls withand without disabilities.In 2020, 42 countries had nationally representative data on at least one menstrual health indicator1 indicator2 indicators3 indicators4 indicatorsInsufficient dataNot applicableNumbers of menstrual health indicators with national data available, by country, 2020FIGURE 11Use of menstrual materials is high, but some women lack a private place to wash and changeUse of materialsProportion of women and girls age 15-49 (%)1001009999 99 99948999 99 9999 9998 9898 99 9898989897969593Private place to wash and change9898989797 97 979697969594939392879696959595949493 95939291919090898787818080958985838082 81 81 81746056524020HIGHLIGHTSSamoa (2020)Lao People's DemocraticRepublic (2017)Niger (2016)Ethiopia (2017)Mongolia (2018)Burkina Faso (2019)Suriname (2018)Nepal (2019)Madagascar (2018)Algeria (2019)Chad (2019)Democratic Republicof Congo (2018)Iraq (2018)Nigeria (2018)Central AfricanRepublic (2019)Togo (2017)Tunisia (2018)Kyrgyzstan (2018)Montenegro (2019)Cuba (2019)Sierra Leone (2017)Ghana (2018)Zimbabwe (2019)Uganda (2017)Lesotho (2018)Kiribati (2019)Serbia (2019)Gambia (2018)Bangladesh (2019)North Macedonia (2019)Democratic People’sRepublic of Korea (2017)Kenya (2016)Costa Rica (2018)Côte d'Ivoire (2018)FIGURE 12Turkmenistan (2019)Sao Tome andPrincipe (2019)0Proportion of women and girls age 15-49 who use menstrual materials, and have a private place to wash and change during menstruation,selected countries, 2016-202011
DRINKING WATER In 2020, 74% of the global population used safely manageddrinking water services, 60% in rural and 86% in urban. 2 billion people lacked safely managed services, including1.2 billion people with basic services, 282 million with limitedservices, 367 million using unimproved sources, and 122million drinking surface water. Estimates for safely managed services were available for 138countries and five out of eight SDG regions, representing 45%of the global population. Achieving universal access to safely managed services by 2030will require a 4x increase in current rates of progress (10x inleast developed countries (LDCs) and 23x in fragile contexts).SANITATION In 2020, 54% of the global population used safely managedsanitation services, 44% in rural and 62% in urban. 3.6 billion people lacked safely managed services, including1.9 billion people with basic services, 580 million with limitedservices, 616 million using unimproved facilities, and 494million practising open defecation. Estimates for safely managed services were available for 120countries and seven out of eight SDG regions, representing81% of the global population. Achieving universal access to safely managed services by 2030will require a 4x increase in current rates of progress (15x inLDCs and 9x in fragile contexts).MENSTRUAL HEALTHHYGIENE In 2020, 71% of the global population had basic handwashingfacilities with soap and water at home. 2.3 billion people lacked basic services, including 670 millionpeople with no handwashing facilities at all. Estimates were available for 79 countries and four out of eightSDG regions, representing 50% of the global population. Achieving universal access to basic services by 2030 willrequire a 4x increase in current rates of progress (7x in LDCsand 5x in fragile contexts). New indicators related to menstrual health are increasinglyincluded in household survey questionnaires for women and girlsage 15 to 49. 42 countries had national data available on awareness ofmenstruation, use of menstrual materials, access to a privateplace to wash and change, and participation in activities duringmenstruation. A large proportion of women and girls in countries where dataare available reported not to have the services they need formenstrual health and there are often substantial disparitiesbetween sub-national regions and for women and girls with andwithout disabilities. Further work is needed to refine these indicators and evaluate ifothers may be more relevant to menstrual needs.JMP website: washdata.orgISBN 978-92-4-003084-8
services lived in rural areas. Around half of them lived in LDCs. In 2020, 138 countries2 had estimates for safely managed drinking water services2 2 2 The JMP produces internationally comparable estimates for 234 countries, areas and territories, including all United Nations Member St