Transcription
Power Transformer TestingCourse No: E03-041Credit: 3 PDHVelimir Lackovic, Char. Eng.Continuing Education and Development, Inc.22 Stonewall CourtWoodcliff Lake, NJ 07677P: (877) 322-5800info@cedengineering.com
POWER TRANSFORMER TESTINGTransformers may be tested using AC or DC voltage. AC voltage is preferable to DCvoltage for transformer testing because AC voltage simulates the internal stress thatthe transformers face during operating conditions. The following tests are routinelyconducted in the field on the transformer:-Excitation current test-Insulating fluid dielectric tests-Insulation PF test-Insulation Resistance test-TTR test-Polarity test-AC or DC hi-pot test-Induced potential test-Frequency response analyzer-Dissolved gas analysis tests-DC winding resistance-Transformer core ground test-Polarization recovery voltage testAC Hi-Pot TestThe AC hi-pot test is used to assess transformer windings condition. Hi-pot test issuggested for all voltages, particularly those above 34.5 kV. For transformer routine
maintenance testing, the test voltage should not surpass 65% of factory test voltage.Nevertheless, the hi-pot test for routine maintenance is typically not applied totransformers because of the possibility of damage to the winding insulation. Hi-pottest is typically used for acceptance testing or after transformer repair testing. TheAC HV test value should not surpass 75% of the factory test value. When AC hi-pottests are used for routine maintenance, the power transformer can be examined atrated voltage for 3 min instead of testing at 65% of factory test voltage. The AC hipot test values for voltages up to 69 kV are presented in Table 1.Table 1. AC dielectric test for acceptance and routine maintenance for liquid-filledpower transformersTransformerFactory test ACAcceptance field testMaintenancewinding voltagevoltage (kV)AC voltage,periodic test,(kV)75% (kV)65% 00140105.0091.00TTR TestDuring TTR test voltage is applied to one transformer winding. Also, voltage onanother winding on the same core is detected. In the case of a low voltage handcrank powered TTR, 8 V AC is applied to the tested, low-voltage transformer windingand a reference transformer in the TTR set. The HV transformer windings and theTTR reference transformer are connected through null detecting equipment. Afterpolarity has been made at 8 V, when the null reading is zero, the dial readings showthe ratio of the tested transformer.In the case of an electronic TTR test set, a voltage (usually 80 V AC) is applied tothe tested transformer HV winding. The voltage detected on the low-voltage windingis measured and the voltage ratio between high and low windings is determined.Voltage ratio is proportionally equal to turns ratio.
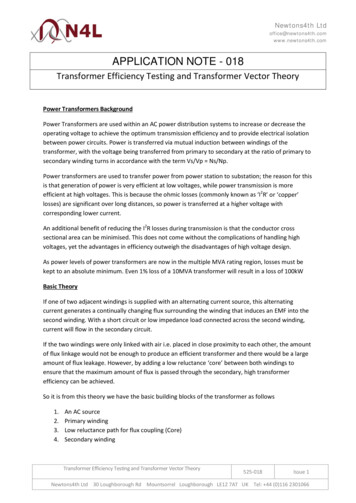
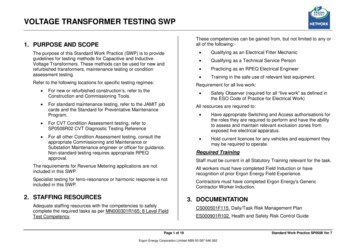
The TTR test gives the following:-It checks the turns ratio and polarity of single- and three-phase powertransformers, one phase at a time.-It verifies nameplate ratio, polarity, and vectors.-It checks polarity and the ratio (but not voltage rating) of transformers withoutmarkings. Tests consider all transformer no-load tap positions. Tests considerall load taps on load, tap changer (LTC) transformers if connected for voltageratio control. On LTC transformers connected for phase angle control, ratioand polarity are completed only in neutral positions. If checked on load taps,measurements may be taken for reference for future comparison, but willdeviate from nameplate ratings. LTC taps may be checked by using low threephase voltage and reading volts and the phase angle for each.-Find issues in power transformer windings, such as open-circuit and shortcircuits of turn-to-turn sensitivity. The standard deviation as described in IEEEC57.12.00-2006, suggests that results should be within 0.5% of nameplatemarkings, with rated voltage applied to one winding. The TTR with accuracyof 0.1% is accepted as sufficiently accurate.The following steps are used for completing the TTR test:-Transformer is isolated and tagged and leads disconnected-Check transformer nameplate-Check the polarities and vectors (phasors)-Determine ratios for each no-load and load tap positionThe test connections are presented in Figure 1 a through c. In the case of anelectronic TTR, a unity ratio check is also done, but null and zero checks are notmandatory.
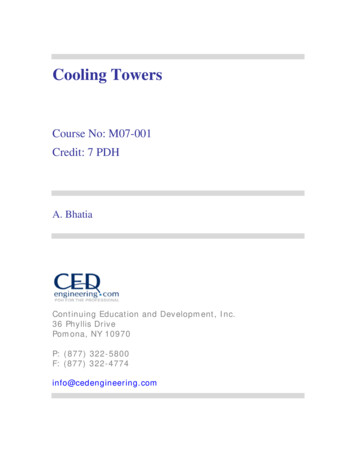
HX11AV(a)NX2H2TTR test setTransformerX1H1AV(b)H2NX1TTR test setTransformerH2X1AV(c)NH2X2TransformerTTR test setFigure 1. TTR test set connections; (b) test connection for null verification for TTRand (c) test connections for zero verification for TTRAlternative Test for TTRIn case a TTR test set cannot be used, fast and rough test can be completed toverify the continuity and phase identification of transformer windings. The testconsists of the following. The equipment required for this test is a 100 W lamp withsocket and an extension cord for connection to a 120 V 60 Hz power supply, withwhich three test procedures are completed.Test 1: Connect the 120 V, 60 Hz power through the lamp to the transformerprimary, terminals as presented in Figure 2 (a). Leave the transformer secondary
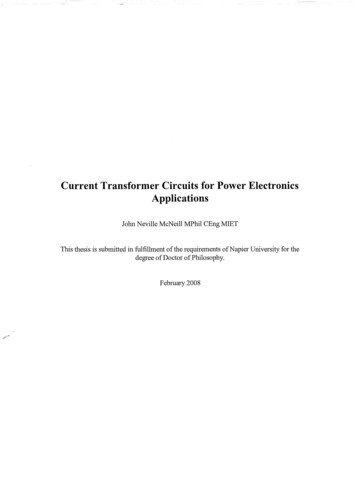
winding open. The lamp will burn dimly.Test 2: Keep connections as presented in test 1, but now short the secondarywinding. The lamp should burn with great brilliance. If the lamp still burns withsomewhat less than full brilliance, check for issues in the transformer winding.Connections for this test are presented in Figure 2 (b).Test 3: This test is similar to tests 1 and 2, but as applied to a three phasetransformer for phase identification and phase continuity check. Complete tests 1and 2 for each winding of a three-phase transformer individually with the remainingwindings kept open. The test connection arrangement is shown in Figure 2 H3X3(c)H2120V60HzX2X1100WH1X0Figure 2. Transformer winding continuity verification
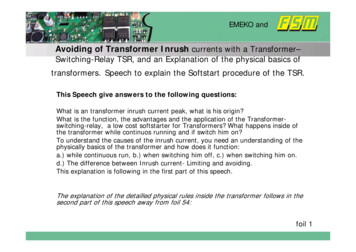
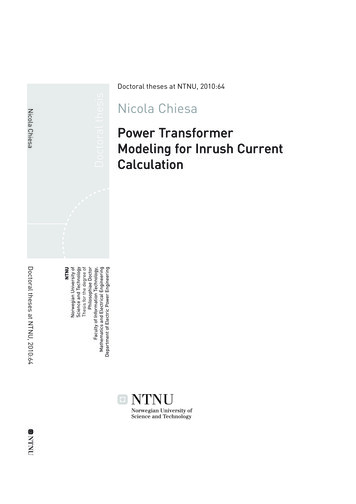
TTR CapacitorThe TTR test may be completed at higher voltages using a capacitor in combinationwith the PF test set. With the installation of the TTR capacitor the turns ratio of powertransformers at potentials up to 10 kV can be measured. Installation of the capacitorin place of the common TTR test set, allows a greater test voltage, up to 10 kV thatcan be applied to the primary winding. Majority of TTR test sets are limited to lessthan 100 V which highly decrease the voltage on the secondary windings. Theadvantages of the HV TTR tests are that it can discover issues and anomalies in theelectric and magnetic circuit (core and coils) of the power transformer that cannot bediscovered with the low-voltage TTR tests.Polarity TestThe polarity test can be completed with the TTR on power, distribution, and potentialtransformers. Nevertheless, for current transformers the TTR test is not used.Instead a test typically known as the kick test is used. The kick test can also be usedfor power distribution, and potential transformers. Nevertheless, the TTR test ispreferred. The connection arrangement for a kick test for a current transformer ispresented in Figure 3. The DC battery voltage is typically about 7.5 V, and the multimeter voltage range is set for 3 V full-scale. The battery negative terminal isconnected to current transformer terminal H2 and the positive side is left hanging forthe time being. The multi-meter positive terminal is connected to the transformersecondary terminal X1 and negative terminal to X2. To complete the test, touch thepositive side battery jumper to transformer terminal H1 and notice the multi-meterscale indication, if the multi-meter scale kick is up scale, the transformer isconnected in subtractive polarity. If the kick is down scale, it is connected in additivepolarity.
X2H2-veMultimeter veH1X1Figure 3. Polarity verification using the kick techniqueInduced Potential TestThe induced potential check is a proof test and completed at higher voltage levelsthan normal operating voltages. Under this test, turn-to-turn insulation and line-to-lineinsulation are stressed at 65% of factory test voltage at frequency greater than 60Hz, such as 200–300 Hz. The frequency of completing this test needs to be 5 yearsor more for big transformers. The induced potential verification for transformerswhich receive the full standard applied potential test is done by applying between theterminals of one winding a voltage of twice the normal voltage developed in thewindings. This voltage is applied for 7200 cycles, and the duration should notsurpass 60 s. Since the induced potential test overexcites the transformer, thefrequency of the applied potential needs to be high enough to prevent the excitingcurrent of the transformer, which should not exceed about 30% of its rated loadcurrent. Ordinarily this requirement requires the usage of a frequency of 120 Hz ormore, when testing 60 Hz units. When frequencies greater than 120 Hz are applied,the test severity is abnormally increased and for this reason test duration needs tobe decreased as presented in Table 2.Table 2. Frequency versus test durationFrequency (Hz) Duration (s)120 and less6018040240303002040018
The voltage needs to be started at one-quarter or less of the full value and increasedup to full value in not more than 15 s. After being kept for the time presented in Table2, it needs to be slowly decreased (in not more than 5 s) to one-quarter of themaximum value or less.When power transformers have one winding earthed for operation on an earthedneutral system, special attention needs to be taken to avert high electrostaticstresses between the other windings and earth.In the case of power transformers having one end of the HV winding earthed duringthe induced potential test, earth on each winding may be made at a selected windingpoint or at the step-up transformer winding which is used to supply the voltage orwhich is merely connected for the purpose of furnishing the ground. Three-phasetransformers may be checked with single-phase voltage. The specified test voltage isinduced, from each line terminal to earth and to adjacent line terminals. The windingneutrals may or may not be held at earth potential during these tests. When theinduced test on the winding results in a voltage between terminals of other windingsin excess of the low-frequency test voltage, the other windings may be sectionalizedand earthed. Additional induced tests need to be done to give the required testvoltage between terminals of windings that were sectionalized.FRAThe FRA test may be completed as an impulse response or as a SFRA test. Theimpulse method estimates the frequency response whereas sweep frequencyresponse method measures the response over a range of frequencies of interest.Both the FRA and SFRA techniques are nondestructive tests used to understand ifdeformation of core and coils has taken place. Sweep frequency response is a majorbenefit in transformer condition assessment, allowing visualization of the inside ofthe transformer’s tank without empting the transformer tank. The standard definitionof FRA is the ratio of a sinusoidal output from a test object exposed to a steadysinusoidal input. SFRA is a proven test for completing accurate and repeatablemeasurements. There is a direct relationship between the geometric arrangement ofthe winding and core, and the series and parallel impedance network of inductance,capacitance, and resistance. This network can be described by its frequency-
dependent transfer function.FRA assessment by the sweep frequency response technique uses networkassessment tools to find the transfer function. Changes in the geometricarrangement affect the impedance network, and in turn affect the transfer function.This allows detection of a wide range of failure modes. Assessment of SFRA testresults partly relies on comparison between phases and against old test results.Commonality between similar transformers is also anticipated. Actually, SFRAchecks are a series of many tests completed over a band of frequencies from 20 Hzto 2 MHz. The SFRA test results can be referred to as traces that can be presentedon a graph. Traces present the ratio of the output voltage to the input voltage of thetested transformer circuit at each of the frequencies. It has been demonstrated thatthese traces are a signature that is related to the distributed resistance, inductance,and capacitance (RLC) of the transformer components. They are supposed to followcertain general shapes and favorable comparisons should exist among thetransformer phases, with old test results, and among transformers of same design.The first, or benchmark, traces also give a valuable tool to identify windingmovement in the future.In comparison to the “impulse” procedure, SFRA is preferred for frequency domainverifications. It covers the full dynamic range and keeps the same energy level foreach frequency, giving accurate, consistent results. A high signal-to-noise ratioacross the entire 20 Hz to 2 MHz frequency range ensures correct measurements.Sweep frequency response analyzers discover mechanical failure or windingmovements due to short circuits, mechanical shocks, or transportation. Thesechecks are completed to ensure transformer performance, decrease maintenancecost, and increase overall transformer life. System faults, short circuits, aging, orimproper handling can affect transformer’s mechanical structure. Since these issuesare difficult to discover, they typically remain unnoticed and worsen over time,leading to complete performance loss and possibly failure. Until recently, themethods for dealing with these severe issues were limited. If such damage wassuspected in a power transformer, the options were limited. These issues could beneglected and hope for the best, or empty transformer tank to complete costly andtime-consuming visual inspection. Even that might not indicate the damage.
The sweep frequency response analyzer introduces a powerful tool to the qualitycontrol and maintenance equipment, allowing a look inside the transformer todiscover even subtle changes in the core and winding mechanical structure—withoutemptying the transformer tank. This is the most efficient diagnostic tool fordiscovering mechanical issues in power transformers. The instrument emits anexcitation signal into the transformer and detects the returning signals. Comparingthis response to baseline and other results (such as from similar units) allowsdetection of deviations. Common internal mechanical issues found in transformerswith FRA are:-Core displacement-Partial winding collapse-Faulty core grounds-Shorted turns and open windings-Broken or loosened clamping structures-Winding deformation and displacementDescribed test techniques are typically used on big HV power transformers becausethey are sensitive tests to discover winding distortion and deformation in powertransformers. Considerable amount of deformation can happen in the windings as aresult of high through fault currents which can remain undiscovered before an actualfailure happens. The voltage stress changes in the winding insulation structure afterthe onset of initial winding deformation. Subsequently, the winding deformation willlead to partial discharges and gassing. Nevertheless, by the time partial dischargeand subsequent gassing appear degradation of the transformer has alreadyhappened. Winding deformation is one of the first and basic precursors to show adegraded condition in the transformer windings. The FRA tests are completed at thefactory and also in the field. The measurements are cross compared to check ifchanges have happened in the transformer. Special test equipment is needed tocomplete FRA or SFRA tests. Typically, the procedure requires the transformer to be
de-energized and isolated. Each individual phase of every winding is examined. Oneset of tests is completed by injecting the signal at one end of the winding andmeasuring the other end. Another test is completed by injecting the signal at one endof a primary winding and measuring the corresponding secondary winding.DC Winding ResistanceThis test checks the transformer winding DC resistance and is done with a lowresistance ohmmeter or a Kelvin bridge. Winding resistance will change due to looseconnections, shorted turns or deteriorating contacts in tap changers. One of theissues related to measurement of the transformer DC resistance is the inductivecircuit that must be energized. The inductance must be charged and stabilized inorder to allow an accurate reading to be completed. Special low-resistanceohmmeters are available for the purpose of completing this test.The test process for measuring DC winding resistance requires the transformer to bede-energized and disconnected. Both the primary and secondary terminals need tobe isolated from external connections, and measurements completed on each phaseof all windings. The measured resistance needs to be corrected to a commontemperature such as 75 C or 85 C using the following formula:𝐶𝐹 𝐶𝑇𝑅𝐶 𝑅𝑀 ()𝐶𝐹 𝑊𝑇whereRC is the corrected resistanceRM is the measured resistanceCF is the correction factor for copper (234.5) or aluminum (225) windingsCT is the corrected temperature (75 C or 85 C)WT is the winding temperature ( C) at time of testMeasurements need to be done on all tap changer positions and cross compared to
older or factory test measurements. The test values after temperature correctionneed to be cross compared with the factory test values or older test results fortransformer windings and leads condition assessment. The acceptance criteria forthe field-measured values after temperature correction need to be within 2% of thefactory values. A change bigger than the acceptance criteria suggests short-circuitedturns, poor joints, or bad tap changer contacts. This test needs to be done duringacceptance testing and when other maintenance electrical tests are done.Transformer Core Ground TestAn IR measurement is made to discover the presence of unintentional core grounds.Generally, power transformer laminated cores are insulated from ground, andintentionally earthed at a single point. Typically this earthing point can be accessedat the top of the transformer, either externally at a small bushing or internally behinda manhole cover.Unintentional core grounds can develop due to improper shipping, though faults, ordeterioration of core insulation. Any of these issues can cause increased localizedheating through circulating currents in the core and surrounding structure, causinggeneration of specific gases in the insulating oil. The routine for the test requires thetransformer to be de-energized and isolated. The intentional core ground connectionis lifted and the DC IR test is completed between the core connection and theearthed transformer enclosure. Acceptable readings are 100 MΩ or higher.Polarization Recovery Voltage TestThe transformer insulation systems are composites of two insulating materials:cellulose fibre (paper) and insulating oil. This design shows space-chargepolarization effects which are highly affected by the moisture content and agingproducts. These cause time constant reduction. The time constant caused by spacecharge polarization surpasses 10ms and, in the case of new dry insulation, even1000s. Figure 4 (a) presents the circuit of a recovery voltage meter.
re 4. (a) The principle circuit of time tc recovery voltage measurement, (b)Recovery Voltage Meter measurement cycle and the quantities recorded during onecycle, and (c) recovery voltage V as a function of time tcSwitch S1 is closed for a time tc and DC voltage source U, applies a certain chargeto the capacitor (test object). Switch S1 then opens and switch S2 closes for a time td(typically td tc/2). Part of the capacitor charge is dissipated, then switch S2 opensand the residual capacitor charge generates a voltage at the capacitor electrodes(Figure 4 (b)). Two common parameters of this so-called recovery voltage are itsmaximum value (Vmax) and initial slope (tanα). If the time tc is increased, along withtime td from a small initial value, a different value of Vmax and initial slope tanα will beobtained for each time tc. Figure 4 (c) presents the variation of Vmax with tc. It is easilyproved that the Vmax/tc curve peaks at the time constant value, i.e., tcritcal T. Thisresult suggests that the Vmax/tc curve also represents a polarization spectrum withmaximum value at the insulation time constants.The Measuring InstrumentInstruments are developed for automatic completion of the series of required
measurements for determination of the spectra polarization. These systems areportable microprocessor-controlled automatic units that are also suitable for fielduse. Measurement results are presented in digital form. Operation and adjustment ofthe instrument is done through a menu-driven program, with a possibility forcompletely automatic measurement sequences or single manual measurementswhere needed. Instruments have LCD screen display and an alphanumerical printerfor test data results.Typical features include an RS232C interface and screened two-core HV cable forconnection to the test object. Assessment software analyses the data and generatesdefinitive moisture content as a percentage (%) of paper mass and a qualitativeinterpretation of polarization spectrum. The typical settings in the automaticmeasurement program ensure efficient acquisition of the significant part of thepolarization spectrum for power transformer oil/paper insulation. Typically, inautomatic measurement mode the instrument displays:-Recovery voltage peaks-Initial slopes with corresponding charge time tc-All measured parameters (Umax, tanα, tc), the typical values (tc/td) will besaved, displayed, and/or printed outTest Setup for Power Transformers Recovery Voltage MeasurementAs presented in Figure 5, the transformer terminals need to be disconnected fromthe system. The ends of the low-voltage windings need to be joined and connectedto the HV core of the instrument test lead. The ends of all other windings need to bejoined together and connected to the tank earth and the low-voltage core of the testlead. The instrument has the capability of charging voltage at 2000 V DC, tc/td 2, andtc time range of 10ms to 10,000 s.
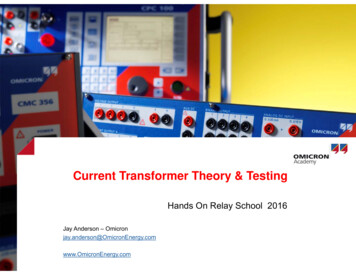
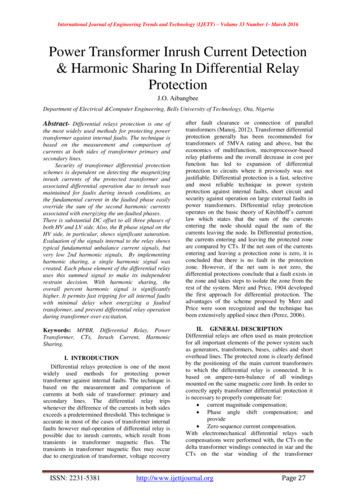
Test cableMeterTest objectFigure 5. Power transformer RVM test setupAssessment of Measured Polarization SpectraThe electrical features and reliability of the oil/paper insulation used on majority ofpower transformers greatly depend on the state (aging and moisture content) of theoil and, even more so, on that of the paper. Oil condition is rather easily checked byconventional oil sample analysis methods such asKarl-Fischer moisturemeasurement, PF, etc. However, these provide limited details on the condition of thepaper insulation. Condition of oil-impregnated paper can be directly ascertained fromthe polarization spectrum without any need to take and assess an oil sample.Figure 6 presents typical spectra measured at constant temperature on oilimpregnated paper insulation laboratory models. The curves in Figure 6(a) presentspectra recorded at varying moisture content on the insulation model. Figure 6(b)presents similar curves obtained under artificial aging of varying duration.
re: 25 CVr(V)10002000 h4000 hNew1001010.1(b)110T(s)Aging on 120 C1001000Figure 6. Polarization spectral curves relative to (a) moisture at 25 C and (b) aging at120 CThese curves indicate that the behavior of the spectrum (particularly displacement ofthe curve peak toward small time constants) closely reflects condition changes, i.e.,dielectric degradation, i.e., oil/paper insulation.Power Transformer Online Condition MonitoringPower transformers are vital and expensive assets in the electric power systembeginning with the grid, transmission, and down to the plant. They are one of thecrucial elements for providing reliable energy flow. As an asset class, powertransformers make one of the biggest investments in a utility’s system or in anindustrial complex. For this reason power transformer condition assessment andmanagement is one of the greatest priorities. Each entity is unique and investment
levels in asset condition and assessment management changes according to risklevel and investment return models. Even though the models are different for eachentity, the common element in them is that transformers are stratified according tothe criticality of individual transformers. This approach means that the most criticaltransformers get the biggest condition assessment investment and managementtools while less-critical or noncritical transformers get lower levels of assetallocations. A simplified model below presents one approach to transformer conditionassessment:Critical: If failed, these power transformers would have a considerable, negativeimpact on grid stability, utility revenue, and service reliability of the critical facility.Generator step-up transformers (GSU) and transmission transformers that are partof critical power corridors fall in this group.Important: If failed, these transformers would have a considerable, negative effect onrevenue and utility system service reliability, or the plant production. Transmissionsubstation transformers and major distribution substation transformers are commonlyin this group.Recoverable: If failed, these transformers would have low impact on revenue andplant reliability. Typically, these are smaller distribution substation transformers.Transformer reliability is more critical today than was in the past. Transformers donot last as long they used to in the past. In the United States, the average life of atransformer is 40 years, and many power transformers installed in the 1960s and1970s are now reaching the end of their design life. Bigger loads placed on powertransformers, in a market that demands more energy, have also taken their toll ontransformer longevity. Due to consolidation and deregulation of the electric industry,maintenance and condition monitoring budgets have been decreased. Hence, therequirement to more closely manage transformer assets becomes even moreimportant these days. Utility and plant managers by selecting adequate transformercondition monitoring tools can prevent unplanned failures, lower maintenance costs,and defer capital expenditures in replacement cost. Condition management is allabout selecting proper transformer monitoring tools.
Transformer Online MonitoringSeveral online monitoring systems can be used for continuously assessing thecondition of big and critical power transformers. The online monitoring systemsreadily available on the market include DGA, PF monitoring of bushing, leakagecurrent monitoring of lightening arrestors, and FRA of transformer windings. Thebushing and lightening arrestors are externally installed auxiliaries on a powertransformer. Hence, they are more susceptible to different environmental conditions.Damage in the transformer bushing or lightening arrestor is a failure of the powertransformer. As previously mentioned, the online testing gives another managementtool for condition monitoring and assessment of the most important transformers.DGA: The DGA is one of the many tests that are applied for monitoring the health ofoil-filled power transformers. The off-line DGA tests have been commonly completedusing laboratory DGA analysis performed at periodic intervals, such as on quarterly,semiannually, or yearly basis. DGA of transformer oil is the single best indicator oftransformer overall condition and is completed without taking it out of service. Now,this is a common practice that got started in the 1960s. While laboratory or portableDGA is the common practice, application of online DGA tools has gained inpopularity. The reason for this is the requirement for utilities to maintain or improvetheir reliability in the presence of decreased capital expenditures and an aginginfrastructure. Something more than periodic laboratory or portable DGA is requiredto be successful in the current environment and the two approaches (online DGAand laboratory DGA) now coexist at many utilities. Online DGA assists utilities toavoid unplanned interruptions, adopt cheaper condition-based maintenance, anddefer capital expenditures by extending the transformer’s useful service life. Firstgeneration products, as well as certain current online DGA products, provided totalcombustible gas (TCG) or single gas (hydrogen) monitoring. This equipmentprovides indication of developing issues in the transformer but offer no legitimatediagnostic features. Online DGA equipment have evolved from this early approach toinclude multi-gas monitors that discover and analyze some or all of the eight faultgases specified in the IEEE standards. They also provide diagnostic features. Neweronline DGA equipment have the unique feature to permanently trend severaltransformer gases and relate them with other key parameters such as transformer
load, oil, and ambient temperatures as well as customer-specified sensor inputs.This feature allows utilities to relate gassing to external incidents, a key to meetingutility reliability and financial goals in the current environment. Certain online DGAequipment may provide improved accuracy and repeatability than laboratory DGA.This can enhance the transformer asset manager’s decision timeliness andconfidence when incipient faults are discovered. With the arrival of online DGAmonitoring, there has also been new discoveries about the nature of transformerfaults. Online DGA monitoring has introduced numerous case studies that show thedevelopment of critical faults, which could cause catastrophic transformer collapsesif left undetected, in timeframes from a few days to se
tests are used for routine maintenance, the power transformer can be examined at rated voltage for 3 min instead of testing at 65% of factory test voltage. The AC hi-pot test values for voltages up to 69 kV are presented in Table 1. Table 1. AC dielectric test for acceptance and routine maintenance for liquid-filled