Transcription
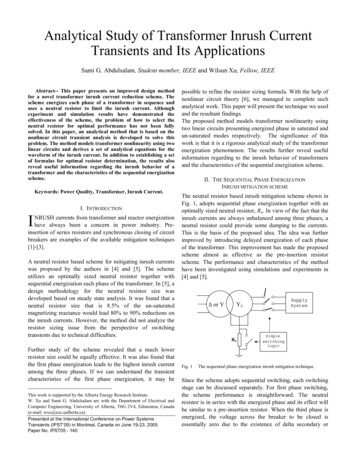
HIGH-POWERED RESEARCHFORDecember 2011 Issue TH1 Modeling Current Transformer (CT)Saturation for Detailed Protection StudiesE REAL WORDecember 20116 The Wound Rotor (WR) and SquirrelCage (SQ) Induction Machine Modelsin the PSCAD Library9 New PT Connections11 Meet the Team!12 PSCAD 2012 Training SessionsLDModeling Current Transformer (CT)Saturation for Detailed Protection StudiesDr. Dharshana Muthumuni, Lisa Ruchkall, and Dr. Rohitha Jayasinghe, Manitoba HVDC Research CentreThe PSCAD Master Library contains a numberof models that could be used for detailedprotection system analysis. The most importantof these models are the current transformer models.Current transformer saturation is associated withmany protection problems encountered in powersystems. CT saturation is a complex phenomenonand accurate modeling in a simulation environment ischallenging. The models available in PSCAD are basedon the advanced mathematical models proposed byJiles and Atherton and commonly referred to as the‘Jiles-Atherton theory of Ferromagnetic hysteresis.’These developed models have been extensively testedwith field recordings in collaborations with CT, relayand protection equipment vendors.This case is used to illustrate the effects of CTsaturation. The key parameters that impact CTsaturation are discussed in an effort to guide PSCAD users who may use this model for their simulations.General Theory The magnetic characteristic of theCT is shown in Figure 1 (hysteresis not shown). In thelinear region, the CT will behave almost like an idealratio changer. That is, the CT secondary current isan identical but scaled down replica of the primarycurrent. However, If the CT saturates, more currentis required to magnetize the core and as a result thesecondary current (IS) available as inputs to the relayFigure 1 IM –Flux curvemay not be an identical scaled down replica of theactual primary current (IP). This can lead to protectionissues and should be given due consideration.System Overview The AC system shown inFigure 2 consists of two 230 kV, 60 Hz Thevaninvoltage sources, a 75 MVA load and three 230 kVtransmission lines (125 km, 75 km and 200 km).A single phase (Phase A) to ground fault is appliedbetween the first two transmission lines.
Current Transformer Saturation CT saturationcan be explained using the simplified equivalentcircuit shown in Figure 3.This representation is valid since the CT is essentially ashort circuit (in series) from the primary power systemnetwork perspective.In the linear region of operation, magnetizing current(IM1) is very small and hence IP – IM is approximatelyequal to IP. Thus IS would be a scaled down version(by a factor of N). If the CT saturates, the magnetizingcurrent increases (IM2). As a result, only a part of IPis available for transformation to the secondary.In this simulation case, a fault is simulated on thetransmission line and the CT is at the end of theline (where Iabc is measured).Key Parameters Impacting CT SaturationThe following can have a significant impact onCT saturation and should be given due considerationin a simulation study:Note: Figure 4 shows how the CT model is used inPSCAD . Note also that the input primary current (Iabc)is in kilo amps and the secondary current (Isabc) is inamps. The CTs are modeled as (independent) blocksand do not have to be connected to the electric circuit.1) DC offset in the primary side fault current.2) Remnant flux on the CT prior to the fault (if any).3) Secondary side impedance including those ofthe relay, connecting wires and CT secondaryimpedance - this parameter plays a major role inthe level of saturation the CT will be subjected to.Illustrative simulation results are presented in thefollowing sections to highlight some of the key points.Figure 2 AC system modelFigure 3 Schematic representation of CT (left) and the simplifiedequivalent circuit (right)2 PULSE THE MANITOBA HVDC RESEARCH CENTRE JOURNALFigure 4 CT PSCAD implementation
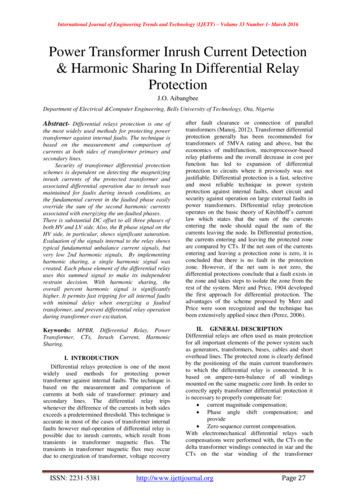
800Impact of DC offset in the primary fault current.Case 1 – Impact of DC offset in the primary faultcurrent: The point on the voltage wave form atthe instant of the fault determines the level of theDC offset in the primary current. The maximum DCoffset will occur when the fault is applied at a voltageminimum (t 0.49167 s). The results in Figure 5a occurwhen the DC offset is significant.The simulation results in Figure 5b demonstrate asituation when there is no DC offset (fault is applied att 0.4876 s, voltage maximum). As can be seen, the CTdoes not go into saturation and only a small amountof magnetizing current is required to magnetize thecore. Therefore, the secondary current is an exact butscaled down replica of the primary current.As can be seen, the DC offset causes the flux (Figure5b) to be driven down and into saturation. The CThas saturated after about two cycles. The reductionof the secondary current is evident from Figure 5a.In Figure 5a also note the remnant flux in the CT coreonce the fault is cleared. Effects of remnant flux willbe discussed in Case 2.IabcVoltage 00-1.50-2.000.5000.5500.600Figure 5a DC offset 0.7500.8000.8500-20-30DECEMBER 0.450Figure 5b No DC offset 100-150-20020Sec. Current (A)-20-30Ia secPri. Current (kA)-100.4500-100Flux density (T)Pri. Current (kA)Flux density (T)0.850Sec. Current (A)00.5010020104.0Vabc-200Ia secPri. Current (kA)Sec. Current (A)20200Voltage (kV)200150100500-50-100-150-200Main : GraphsFlux density (T)Voltage (kV)Main : GraphsVabcB
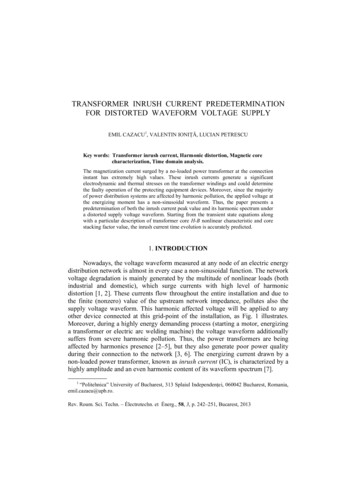
Note: the B-H loop trajectory of the CT during thefault is shown in Figure 6. The formation of the minorB-H loops and hysteresis are accurately modeledbased on the Jiles-Atherton theory of ferromagnetichysteresis. Such detailed representations of the CTbehavior are necessary for detailed protection systemanalysis, such as:Case 2 – Reclosing the line while the fault isstill present (auto reclose): In the first fault event,saturation had taken approximately two cycles. If theline is reclosed while the fault is still present, the CTmay saturate much faster due to the presence of theremnant flux. This is demonstrated in Figure 7. As canbe seen, the saturation occurs in approximately half acycle, possibly before the relay had time to respond. CT response during auto reclose Protection schemes with CTs operating in parallel– 6 CTs in parallel in a three-phase transformerdifferential scheme– 3 CTs in parallel in an earth fault relay scheme– CT connections in generator protectionsFigure 7 Case 2 resultsFigure 6 B-H loop trajectory4 PULSE THE MANITOBA HVDC RESEARCH CENTRE JOURNAL
The response of one CT may impact the behaviourof the other and should be appropriately modeled Main : bc2.01.0kA0.0-1.0-2.0-3.0-4.0-5.0B0.00-0.50F lux denNote: The CT model used in the example case isthat of a single CT operating independently ofany other CTs in the protection scheme. In general,a protection scheme may have a number of CTsoperating in parallel. The response of one CT mayimpact the behaviour of the other and thus, shouldbe appropriately modeled. Contact the PSCAD Technical Support Team for more informationon specific models.Ia sec10.0ACase 3 – Effect of the secondary impedance: The CTsecondary side burden impedance has a significantimpact on CT saturation. In Case 1, the burden was setto 2.5 Ω. The results shown in Figure 8 were obtainedby reducing the burden to 0.5 Ω in the simulation.As can be seen from the results, the flux is not drivendown as far. It also takes a longer time for the CTto become saturated (approximately 6 7000.7500.8000.850Figure 8 Case 3 resultsDECEMBER 20115
The Wound Rotor (WR) and Squirrel Cage (SQ)Induction Machine Models in the PSCAD LibraryDr. Dharshana Muthumuni, Manitoba HVDC Research CentreThe induction machine models are two ofthe most widely used components from thePSCAD Master Library. The PSCAD library hastwo induction motor models:The equivalent circuit of a double cage design(as implemented in PSCAD ) squirrel cage machineis shown below in Figure 2.RSXLSXMR1) Squirrel cage induction machine modelrepresenting a double cage design – (SQ).2) Wound rotor induction machine model – (WR).XLC2RC2Figure 2 SQ cage (double cage) equivalent circuitMathematically, the SQ cage machine can berepresented by the WR machine. The WR modelcould also be used to represent a double cage SQmachine. The two examples below will describerelevant data entry considerations and also compareresults for validation purposes.The simple simulation case shown below is used tohighlight the key points. A SQ machine and a WRmachine with comparable parameters (identicalratings and data) are connected to the same supplysource (60 Hz, 0.69 00TTIN2TIN1TIN2Figure 1 Circuit diagram (WR – top, SQ cage – bottom)6 PULSE THE MANITOBA HVDC RESEARCH CENTRE JOURNALRSXLSXLRXMRRTo use the SQ cage machine model to representa single cage machine:WTimedBreakerLogicOpen@t0The equivalent circuit of a wound rotor machinemodel (single rotor winding) is shown in Figure 3.Figure 3 WR IM (single winding) equivalent circuitExample 1: Modeling a single cage inductionmachine The SQ cage machine model or the WRmachine model may be used to represent a singlecage (SQ) machine (IM study 01.pscx).IMRC1XMThe Technical Support Team receives questionsfrom our users as to which model they should useto represent a set of specific data provided by theequipment vendor. The goal of this technical noteis to provide the necessary information to helpPSCAD users when faced with such questions.– Make the ‘second cage resistance’ (RC2) andthe ‘second cage unsaturated reactance’ (XLC2)relatively large (compared to the other leakageinductances/resistances). In this case, the valuesused are RC2 5 PU and XLC2 5PU, which is muchlarger than RC1 0.0507PU and XMR 0.091 PU.– Give the SQ cage ‘rotor unsaturated mutualreactance’ (XMR) the same value as the WR‘rotor leakage reactance’ (XLR).
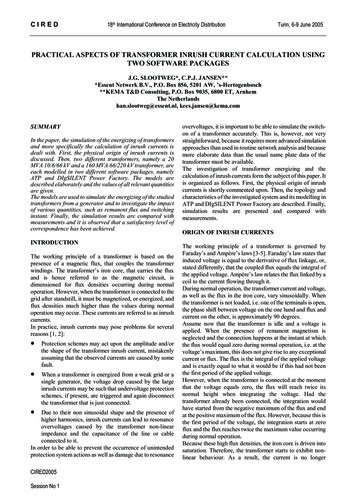
Figure 4 SQ cage and WR setup configurationFigure 4 shows the data entry for the SQ cage (left)and WR models (right). By using equivalent values,both models show comparable behaviour (Figure 5)and represent a single cage machine design.Simulation 0.500.751.001.251.501.752.00Figure 5 Simulation results (IM study 06 a.pscx)The simulation results shown in Figure 5 show thatthe speed (W – WR, W2 – SQ cage) and torque (T – WR,T2 – SQ cage) of both machines are identical. Thus, anyone of the induction machine models may be used torepresent a single cage induction machine.Example 2: Modeling a double cage inductionmachine. The WR machine model can be setup to represent a double cage SQ cage machine(IM study 02.pscx).In the WR model, select the “No. of Rotor SquirrelCages 1”, as shown in Figure 6. The equivalentcircuit representation is as in Figure 7.Figure 6 WR configurationRSXLSXMRRLRXLC1RRRC1XMFigure 7 WR IM (No. of rotor squirrel cages 1) equivalent circuitNDOE VCEMBER 2010197
Figure 8 WR setup configurationFigure 8 shows the data entry for the WR model.With the appropriate data, the SQ cage and WRmachine models will give identical results (Figure 9).A SQ cage and WR machinemodel deliver equivalent resultswhen configured properly Figure 9 Simulation results (IM study 06 b.pscx)Conclusions As can be seen from the results,a SQ cage and WR machine model deliver equivalentresults when configured properly. Hence, a SQcage machine model can be accurately representedusing a WR machine model. PSCAD users areencouraged to use the WRIM model due to itsmore conventional and straight forwardparameter configuration.PSCAD Cases:IM study 01.pscx and IM study 02.pscx8 PULSE THE MANITOBA HVDC RESEARCH CENTRE JOURNAL
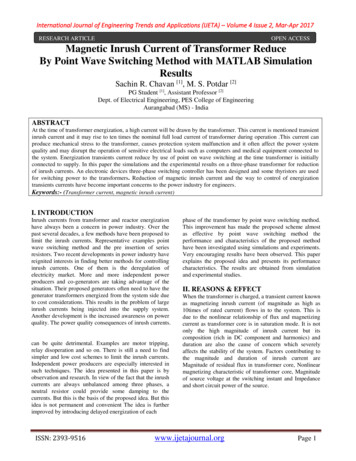
New PT ConnectionsDr. Namal Fernando, Manitoba HydroBackground Generator and transformer protectionupgrade at Seven Sisters generation station. Thereare six units and the existing electromechanical relaysare being replaced with multi-functional digital relays.The project includes replacement of line end potentialtransformers; the existing two potential transformers(i.e. open delta with phase B grounded) are beingreplaced with three potential transformers (groundedwye). There is only one synchronizing system for allsix units. Incoming voltage reference is line voltage;phase AB with B at ground potential.Problem Since the new design includes three potential transformers with neutral grounded, we could notconnect directly to the existing synchronizer system.The existing system is based on phase B at groundpotential and common to all the units, whereas theunits with the new protection design will have neutralpoint grounded (i.e., for units with new protectiondesign, the phase B is no longer at ground potential).EaD0.15555930Figure 1 Phasor diagramSolution Install an isolating transformer betweenthe line voltage AB and the incoming voltage inputto the synchronizer system.PSCAD Application It is well known that PTs shouldbe connected in correct phase sequence. While thecorrect connections can be determined through simplehand calculations by constructing relevant phasordiagrams (Figure 1), this is not always straightforward.There are many instances where incorrect connections have caused unit tripping at the commissioningand testing stage. This could create a headache forall involved and the consequences can be significant.PSCAD provides a simple and efficient way to verifythe new connections. We used a simple PSCAD simulation circuit to verify that the PT connectionscorresponding to the running and incoming voltagesto the synchronizer are connected properly.DECEMBER 20119
The PSCAD case used for the study is shown in thefigure below. The simulation is not complex. However,we find this to be a useful engineering application.The schematic diagrams are shown in Figures 2 and 3.Figure 2 New PT connectionFigure 3 Old PT connection10 PULSE THE MANITOBA HVDC RESEARCH CENTRE JOURNALThe important data for this simulation is just the PTvoltage (turns) ratios. Other details, such as saturation,etc. are not important for this basic analysis.
PUBLICATION AGREEMENT # 41197007RETURN UNDELIVERABLE CANADIAN ADDRESSES TOMANITOBA HVDC RESEARCH CENTRE211 COMMERCE DRIVEWINNIPEG MB R3P 1A3 CANADAT 1 204 989 1240 F 1 204 989 1277info@pscad.comMeet the Team!Manitoba HVDC Research CentreThe Manitoba HVDC Research Centre prides itself on its excellent customer support and service.Our success is a direct result of our client focused efforts. We are committed to providing our clients withthe best possible support to ensure optimum success with our products and services. “Meet the Team” willbe a regularly published addition to the Pulse Newsletter to introduce our experienced team members.This publication features Juan Carlos Garcia Alonso and Arash Darbandi; just a few of the dynamic staffmembers we are fortunate to have at the Manitoba HVDC Research Centre (MHRC).Juan Carlos Garcia Alonso, P.Eng.Power System Simulation & Studies EngineerJuan Carlos (JC) received his Electrical Engineering degree fromthe National University of Colombia, Bogota, Colombia in 1996and subsequently received his M.Sc. degree from the Universityof Manitoba, Canada. He designed power transformers withPauwels Transformers in Winnipeg and in 2006 joined the MHRC.JC participates in various engineering service projects in the areasof insulation coordination, VSCs, protection and superconductivemagnetic devices, among others. His main focus during this periodhas been writing new models for magnetic simulation with PSCAD .JC can be found enjoying his favourite outdoor activities, such asrock climbing, canoeing and hiking.Arash DarbandiEngineering Application SpecialistArash received his Electrical Engineering degree from the Universityof Manitoba, Canada in 2010 and is currently pursuing his M.Sc.at the same university. In his short time here with us, Arash hasimproved the line feature software of our Ice Vision system anddeveloped a new algorithm to improve the existing software. Arashassisted with the Line Fault Locator (LFL) product by developingnew factory acceptance tests for the LFL, improving software quality and performance. Arash is currently involved with the batteryre-purposing research project developing a power electronic gridinterconnection and a reactive power study. He is also performingreactive power studies in different plants, as well as providingrecommendations to clients to improve their system performance.Arash enjoys a healthy and active lifestyle, volunteering withthe University of Manitoba Satellite team as their TechnicalCoordinator, and travelling internationally to experienceculture and cuisine.DECEMBER 201111
Wind Power Modeling and Simulation using PSCAD Includes wind models, aero-dynamic models, machines,soft starting and doubly fed connections, crowbarprotection, low voltage ride through capability.Duration: 3 DaysConnect with Us!January 11–13, 20122012 PSCAD and RTDS Asia Conferencewww.nayakpower.comBangalore, IndiaThe following courses are available, as well as customtraining courses – please contact training@pscad.comfor more information.Fundamentals of PSCAD and ApplicationsIncludes discussion of AC transients, fault andprotection, transformer saturation, wind energy,FACTS, distributed generation, and power qualitywith practical examples. Duration: 3 DaysAdvanced Topics in PSCAD SimulationIncludes custom component design, analysis of specificsimulation models, HVDC/FACTS, distributed generation,machines, power quality, etc. Duration: 2–4 DaysHVDC Theory & ControlsFundamentals of HVDC Technology and applicationsincluding controls, modeling and advanced topics.Duration: 4–5 DaysAC Switching Study Applications in PSCAD Fundamentals of switching transients, modelingissues of power system equipment, stray capacitances/inductances, surge arrester energy requirements,batch mode processing and relevant standards, directconversion of PSS/E files to PSCAD . Duration: 2–3 DaysDistributed Generation & Power QualityIncludes wind energy system modeling, integration to thegrid, power quality issues, and other DG methods such assolar PV, small diesel plants, fuel cells. Duration: 3 DaysLightning Coordination & Fast Front StudiesSubstation modeling for a fast front study, representingstation equipment, stray capacitances, relevant standards,transmission tower model for flash-over studies, surgearrester representation and data. Duration: 2 DaysMachine Modeling including SRR Investigationand ApplicationsTopics include machine equations, exciters, governors,etc., initialization of the machine and its controlsto a specific load flow. Also discussed are typicalapplications and SSR studies with series compensatedlines as the base case. Duration: 2 DaysModeling and Application of FACTS DevicesFundamentals of solid-state FACTS systems. Systemmodeling, control system modeling, converter modeling,and system impact studies. Duration: 2–3 DaysTransmission Lines & Applications in PSCAD Modeling of transmission lines in typical power systemstudies. History and fundamentals of transmission linemodeling, discussion on models, such as Phase, Modal,Bergeron and PI in terms of accuracy, typical applications,limitations, etc., example cases and discussion on transposition, standard conductors, treatments of ground wire,cross-bonding of cables, etc. Duration: 3 DaysJanuary 18–22, ndex.aspxMumbai, IndiaJanuary 24–26, 2012DistribuTECH Conference & Exhibitionwww.distributech.com/index.htmlSan Antonio, Texas, USA Booth #4541March 27–30, 20122012 PSCAD European User Group Meetingtraining@pscad.comCastelldefels, SpainJune 3–6, 2012AWEA Windpower 2012 Conference & Exhibitionwww.windpowerexpo.orgAtlanta, Georgia, USA Booth #7513August 27–31, 2012CIGRE Session 44 and Technical s, FranceMore events are planned!Please see www.pscad.com for more information.PSCAD Training SessionsHere are a few of the training courses currently scheduled.Additional opportunities will be added periodically,so please see www.pscad.com for more informationabout course availability.April 17–19, 2012Fundamentals of PSCAD and ApplicationsMay 15–17, 2012HVDC Theory and ControlsSeptember 11–13, 2012Fundamentals of PSCAD and ApplicationsSeptember 18–20, 2012Wind Power Modeling & Simulation using PSCAD November 27–29, 2012HVDC Theory and ControlsAll training courses mentioned above are heldat the Manitoba HVDC Research Centre Inc.Winnipeg, Manitoba, Canadatraining@pscad.com www.pscad.comPlease visit Nayak Corporation's websitewww.nayakcorp.com for courses in the USA.For more information on dates,contact training@pscad.com today!Pulse is distributed free of charge and is posted electronically at www.hvdc.ca If you would like to receive a copy of Pulse,please send us an email to info@hvdc.ca Articles and submissions addressing the use of PSCAD in the real world are always welcome. 2011 Manitoba HVDC Research Centre, a division of Manitoba Hydro International Ltd. Printed in Canada Expanding Knowledge
General Theory The magnetic characteristic of the CT is shown in Figure 1 (hysteresis not shown). In the linear region, the CT will behave almost like an ideal ratio changer. That is, the CT secondary current is an identical but scaled down replica of the primary current. Ho