Transcription
Reduction of Scrap in an Electronic Assembly LineUsing DMAIC ApproachAfzal Matathil1, Ganapathi K. N.2, Kalathil Ramachandran31- M. Sc. [Engg.] Student, 2-Asst.Professor,Mechanical and Manufacturing Engineering, MSRSAS, Bangalore 560 058.3-Manager-QA, Sanmina-SCI, ChennaiAbstractIn today’s buyer’s market; quality based competition is intensifying and enforces any manufacturing industry toproduce better quality products with least cost. Quality with least cost is only possible by reducing the rejection rateespecially at downstream customer. The study concentrates on the reduction of customer claimed scrap as it is capable ofreducing the product profit and also the future business.Quality is nothing but satisfying the customer needs and expectations on a continuous basis. The scope of this studyis (1) Well designed products with functional perfection, (2) Meeting or exceeding customer expectation, (3) Excellence inservice and (4) absolute empathy with customer. DMAIC methodology is used for this project, as it serves as a guidelinefor successfully identifying root cause of the selected problem and for understanding, implementing and evaluatingsolution/s.The study brought more than 88% reduction of scrap cost within six months of work. The study brought manytangible and intangible benefits including increased future business. It is concluded from the study that the actual qualityis lying with manufacturing process and any complicated problem can be solved by systematic application of DMAICapproach.Key Words Six Sigma, Scrap Reduction, DMAIC, Communication Failure.adopt strategies that meet the need of the industry andits stakeholders while protecting the interest of ourenvironment. Reduced life cycle of electrical andelectronic equipments (EEE) is one of the reasons forincreased E- waste generation. Products can becomeobsolete in a short time due to short life time orinadequate technology. These can be solved byimproving product quality. Hence, now it has beenaccepted by any industry that primary solution forreduction of e-waste is improving quality in all aspectsof the business; such as material quality, processquality, human resource quality, machine quality, etcand finally the end product CAPPMQCQMSSIPOCSOPTQMVoCWIPWRMZstCustomer Complaint ManagementCritical to QualityDefine, Measure, Analyze, Improve,ControlElectronics Manufacturing ServiceElectrical and Electronics EquipmentsFailure Mode Effective AnalysisMaterial Review BoardPrinted Circuit BoardPlan, Do, Check, ActParts Per MillionQuality ControlQuality Management SystemSupplier, Input, Process, Output, ControlStandard Operating Procedure.Total Quality ManagementVoice of CustomerWork In ProcessWork Relationship MatrixSigma Short TermQuality of the products can be improved by improvingvarious factors affecting quality. Some of them are man,machine, method, measurement system, environmentetc. These factors are critical for any electronic industryfor ensuring product quality. Projects for qualityimprovement would provide other tangible andintangible benefits to the industry, such as r/supplier/other stake holders, reduced productcost, increased profit and many other benefits.1. INTRODUCTIONThere are various approaches available for conducting aquality improvement/problem solving project. One ofthe prominent approaches is DMAIC. DMAICapproach act as guide line for conducting a project. Itfacilitates appropriate and effective utilization of qualityand six sigma projects. This study conducted strictly onthe guidelines of DMAIC approach. The study has fivephases; Define, Measure, Analyze, Improve andControl. Various quality tools and six sigma tools wereused in each phase of the project.Scrap in an electronic assembly line is commonlyreferred as a type of electronic waste or simply Ewaste. E waste is a term used to describe obsolete,broken or irreparable electronic devices. It may includeelectronic components, work in progress electronicassemblies or consumer end electronic products. Withthe increased concern about the negative impacts of Ewaste, need to behave in a sustainable manner hasbecome vital consideration for any electronic industry.Reduction of E-waste has attained increased attentionever before by the people and by the governments. Itsnegative impact on environment has been widelydiscussed all over the world. So, an industry has toSASTECH Journal1.1 Place of Work53Volume 11, Issue 2, Sep 2012
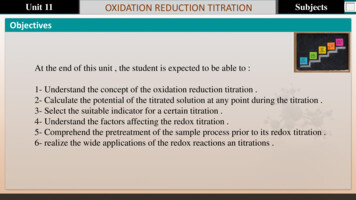
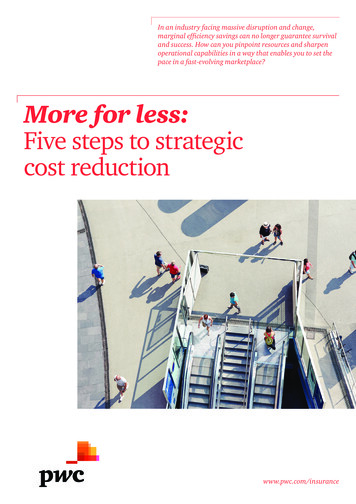
Sanmina- SCI is a global electronics manufacturingservice (EMS) provider, headquartered in San Jose,California serves original equipment manufacturers intechnology related industries such as communicationsand computer hardware. It has nearly 80 manufacturingsites around the world. Sanmina- SCI is the largestindependent manufacturer of black panes.assembly line. And this overall cost can be subdividedas customer claim scrap, work in progress scrap andincoming material scrap. The scraps are valued in termsof cost and not in terms of numbers. The bar graphbelow shows distribution of scrap cost in the selectedline in the three sub groups.From the figure 1, bar graph above, it could beunderstood that 97% of total scrap cost is due tocustomer claim, 1.3% is contributed by WIP scrap andremaining 1.4% is caused by incoming material defects.Hence, as the most contributing group, this studyconcentrates on reduction of scrap generated throughcustomer claim.2. PROBLEM DEFENITIONAn electronic assembly line from the Sanmina-SCI isselected for the study based on scrap value. Theselected assembly line scraps 0.6% of the total revenue.The selected line produces class-3 products goes fordefense. The main contribution of scrap is fromcustomer rejects which is in terms of 97%. Theproducts cannot be reworked due to high qualityrequirements of customer. The scrap value createsmuch intangible loss to the customer apart fromfinancial losses. The aim of the study is stated as “Toreduce scrap rate from 9000 PPM to less than 1000PPM in an electronic assembly line using DMAICapproach”.Focused study on customer claim scrap cost isconducted for better understanding of various issuescontributing to it. The Pareto diagram been has beendrawn after the focused analysis of customer claimedscraps.3. METHODOLOGY Literature survey on electronic production lineand Assembly techniques and to understandDMAIC approach for problem solving byreferringbooks , journals, quality systemmanuals and related documents.Collected scrap data and identified areas ofimprovement using QC tools like Pareto analyses,Process Mapping, SIPOC etc.Studied capability of current measuring systemand quantified it using kappa analysis.Analyzed the current process and operatingprocedures to identify root cause for scrapgeneration using various six sigma tools like brainstorming, cause and affect matrix, hypothesistesting etc.Implementation of viable solution/s by forming across functional team.Statistical testing of improvements have beendone using hypothesis testing.Benefits through the study are validated anddocuments are modified with necessary changesfor controlling the identified problem.Fig. 2 Pareto on customer claimed scrapsThe figure 2 reveals that 88.52% of the total scrap costis due to communication failure. And 6.52% is due toCC PCB failure and remaining costs are due to variousother factors. Hence for this project, communicationfailure has been selected. Resolving this problemwould reduce 85% of the total scrap cost.It has been understood that ‘communication failure’ isvery severe for the product. As the product is entirelycontrolled by computer, communication failure literallystops entire operation of the product. It makes hugefinancial loss for the customer and stops importantoperations of the customer. As customer is defence, norework was allowed and has to be scrapped directly. So,the whole product to be scrapped for the sake ofcommunication failure and it’s a huge financial burdenfor the company.4. ANALYSIS4.1 Kappa AnalysisTo analyze the current measuring system capability,Kappa analysis has been conducted by putting threeoperators in place with 20 units randomly arranged.Each operator has to check each of the products. Theanalysis concluded that, each of the operators agreeswith two others on each of the sample. It ensures thatthe measuring system is capable of repeated results andit reproduces the same result each time and every time.The table 1 below shows the results of the test.Fig. 1 Bar graph for scrap distributionFor better understanding of the scraps, more detaileddata has been collected. From the first analysis, thecalculated cost of scrap is 0.6% of the selectedSASTECH JournalTable. 2 Measurement system capability analysis54Volume 11, Issue 2, Sep 2012
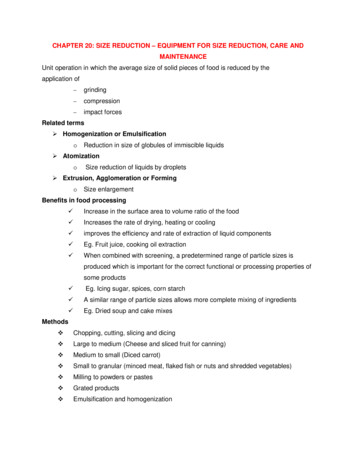
Brainstorming session had been conducted tounderstand possible causes for “communicationfailure”. Brainstorming is done by the cross functionalteam participating production, testing, design, quality,process and finance departments. The figure belowillustrates possible causes found in brainstormingsession.4.3 Action Plan Communication FailureAn Action plan has been formed after the brainstormingsession. Some causes has been marked as “not a cause”during the initial judgment in the post-brainstormingsession. 18 causes have been identified as possiblecauses and planned an action plan for finding the vitalfew. The table below shows the action plan and theresults. It can be noticed from the table that 2 out of 18haveidentifiedasvitalor“existing”. Remaining 16 has been identified as “notexisting”. The vital few identified are “Telejack Pinshort” and “Inappropriate contact surface mating”.Table. 3 Action plan Communication failureThe figure below shows measurement systemagreement analysis report got from Minitab software.And the Cohen’s kappa is calculated is 1.4.4 FMEATable. 4 FMEA beforeFig. 3 Kappa analysisFrom the above study it has been concluded that there isno loop hole in the process of determining the scrap.4.2 Brainstorming Communication FailureFMEA is the acronym for Failure Mode EffectiveAnalysis. It is a tool to identify means that aproduct/process can fail. The RPN is the acronym forRisk Priority Number. It has been identified that thereare two failure modes for “communication failure”;inappropriate contact surface mating and telejack pinsshort. The RPN number for the failure modes arecalculated and finalized by the CFT that, 560 and 490respectively. The table below shows FMEA for“communication failure”.4.5 Further AnalysisFig. 4 Fish bone diagramSASTECH JournalThe vital few causes have been further examined to findout the root cause. It has found that “telejack pin short”and “inappropriate contact surface mating” are the55Volume 11, Issue 2, Sep 2012
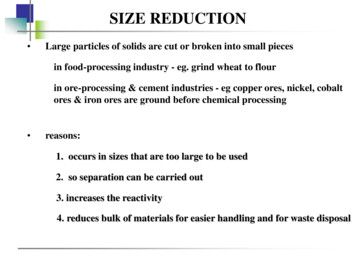
immediate causes for communication failure. And byobserving the contact strings/pins of telejack it has beenunderstood that “inappropriate contact surface mating”is occurred due to corrosion. The figure below showscorrosion observed on telejack pins.4.7 Brainstorming Flux Penetration inside theTelejackFurther brainstorming session has been conducted tofind out the possible causes for “Flux penetration insidethe telejack”. Production, NPD, process, purchase, andQuality representatives have been attended the session.The figure below illustrates possible causes for “Fluxpenetration inside the telejack”.Fig. 5 Telejack pin corrosionThe action plan has been formed to find out the actualcause for the corrosion. The action plan and findings arelisted on table below, and the study is explained later.Table. 5 Action plan Further analysisFig. 6 Fish bone diagram Flux penetration insidethe telejack4.8 Action plan flux penetration inside thetelejackAction plan formed after the brainstorming session isillustrated in table below. Each identified causes hadbeen examined under detailed study to find out itsexistence and non-existence. Some of the causes foundout in the brainstorming session had been ruled out inthe initial judgment. Remaining causes has gonethrough further examination. The table below showsaction plan formed after the post brainstorming sessionand its results. The vital few causes are highlighted inthe action plan.The causes for corrosion have been studied thoroughlyfor finding the underlying reason. Through themicroscopic inspection, it has been found that duringthe wave soldering process, flux is getting penetratedinto the telejack. Absence of flux in the new telejackand presence in the ‘wave soldered telejack’ conformedthe result. And it has been assumed that this causes thecorrosion and also for the ‘telejack pin short’.Table. 6 Action plan Flux penetrates inside telejackFor concluding the findings, salt spray test fromexternal agency has been done. The result showed that‘red corrosion’ on flux penetrated or wave solderedtelejack and ‘no corrosion’ on new telejack.4.6 Temporary Corrective ActionTemporary corrective action had been identified andimplemented for reducing flux penetration inside thetelejack. Those are, Cleaning process before the wave solderingprocess using IPL and a brush. Pasting scotch tap on telejack contact stringsbefore wave soldering. Removing scotch tap off telejack contact stringsafter wave soldering. Cleaning the pins after the wave solderingprocess. Microscopic inspection of telejack after wavesoldering process.The temporary corrective action added 3 head counts tothe line, it also added 4 minutes to the cycle time of theproduct. The corrective action has found successful andverified by the microscopic inspection as well as by saltspray test.SASTECH Journal4.9 Why-Why AnalysisThe why- why analysis below illustrates how“clearance hole” eventually caused in thecommunication failure.56Volume 11, Issue 2, Sep 2012
diagram below shows current and proposed design oftelejack.Fig. 8 Telejack design old and proposedAs the new proposed design send to the design teamsituated at U.S.A, The proposed design has beenapproved with minor modification. The approveddesign has square leads instead of circular shape withdiameter reduction of 0.1 mm. The figure below showsactual photos of old and new telejack.Fig. 7 Why-why analysisThe root cause had been confirmed after covering eachtelejack leads by a stiffener and by checking each withmicroscope for the flux penetration after the wavesoldering process. Found that the flux penetration hasbeen completely eliminated for the sample of 100. So,from the detailed analysis, it has been concluded thatroot cause for the communication failure are “TelejackLead Assembly Clearance Hole” and “Wrong directionof PCB flow”Fig. 9 Telejack old and new5. PROBLEM SOLVING Problem solving includes identification of feasiblesolution, implementation of identified solution andfinally evaluating effects of implemented solution. Theproblem solving steps are explained in this chapter. 5.1 Solution IdentificationPin clearance hole has been specified and definedin the telejack data sheet. As per the new drawing,no clearance hole allowed.Circular shaped pins are modified into square.The diameter of the pin has been modified from0.9mm diameter into 0.89 diagonal lengths.5.3 Change in the Board Flow DirectionTable 7 Identified solutionsSolutions for eliminating communication failure havebeen identified. Below table shows identified solutionsand its explanations.Fig. 10 PCB direction before and afterTo avoid flux accumulation at pins of telejack pins,flow of board has been reversed and now the telejack ison the leading edge. The figure below shows PCB flowbefore and after. The telejack is marked as ‘J2’ in thefigure. Instructions are added on WI and an alert hasbeen provided in the line.5.2 Telejack Design ChangeThe clearance hole has been defined and specified onthe telejack specification sheet. A new design oftelejack has been proposed for designer approval. TheSASTECH Journal57Volume 11, Issue 2, Sep 2012
Where, p1 is the failure proportion of old telejack andp2 is the failure proportion of new or improved telejack.5.4 Microscopic InspectionA permanent workstation for microscopic inspection oftelejack has been added. It would help to verify the fluxpenetration into the contact strings of telejack. Theoperator has been trained to do the inspection, and hasto paste a sticker upon inspection. The sticker has toremove the sticker and to mark on the check list. Anyproblem found should be informed to line supervisorand quality. The work station will be “on” for threemonths, and will be discarded upon customer feedback.The test has been conducted and found that 97 out of100 old telejack have been failed after the wavesoldering; in other words the flux penetration is found.And with new or improved telejack, the failure was 0out of 100. The test is conducted at the significancelevel of 0.05. Below are the observations or inputs forthe test. 6. RESULT AND DISCUSSIONS Project results have to be validated and discussed beforeclosing. There are six sigma tools helps to validate theresults of project. Validation of the study is veryimportant to verify the results of the project. Theimprovements are measured by using six sigma tools.The validation of the study is explained below. 6.1 FMEA after the Study FMEA is the acronym for Failure Mode EffectiveAnalysis. It is tool to identify means that aproduct/process can fail. It can also be used for definingprocess improvements and controls. The tables belowshow FMEA before and after for the scrap. It could benoted that, the RPN for the failure mode“communication failure” has been reduced to zero afterthe project. As severity remains the same before andafter the project, frequency and detection has beenimproved.p1 0.97 (Sample proportion of failure with oldtelejack).q1 0.03 (Sample proportion of success with oldtelejack).n1 100 (Sample size of testing old telejack).p2 0 (Sample proportion of failure with newtelejack).q2 1.0 (Sample proportion of success with oldtelejack).n2 100 (Sample size of testing new telejack).Alpha 0.05 (Level of significance for testingthis hypothesis).After putting these inputs to the MinitabSoftware, 2-Propotion test has been conducted. Thefigure below shows screen shot of result from Minitabsoftware.Fig. 11 2-Propotion testThe null hypothesis (H0) has been rejected andaccepted alternate hypothesis (Ha) based on theobservations made from result as explained below,Table. 8 FMEA after 6.2 Two-Proportion Test For ensuring/ validating the results statistically, 2propotion test has been done. The test is conducted byrunning 200 products with 100 of it with each old andnew telejack. Each product has been checked throughmicroscope for identifying flux penetration. Thecomponents found as flux penetration are marked as“fail”. And the components with no flux penetration aremarked as “pass”. The test is conducted on the samemachine and the result would be useful to ensure theimprovement made through improved design. 0 lies outside the confidence interval fordifference (0.936566,1)Z calculated (56.86) is greater than the Z table(1.96)P value is less than 0.05So, null hypothesis has been rejected and acceptedalternate hypothesis. It could be concluded that “Thereis a significant impact/reduction on communicationfailure through telejack design change”.6.3 PPM LevelPPM level of scrap has been reduced drastically from9223 PPM to 1058 PPM against the target of 1000PPM. The graph below shows the improvement.The hypotheses made are,H0 (Null hypothesis) p1 p2 (There is no significantimpact on communication failure by telejack designchange).Ha (Alternate hypothesis) p1 p2 (There is asignificant impact on communication failure by telejackdesign change).SASTECH Journal58Volume 11, Issue 2, Sep 2012
Better customer relationship.Reduced breakdowns at customer.7. CONCLUSIONSDMAIC approach helped successful completion of thestudy with clearly defining study road map. TheSanmina-SCI had very good system and procedure fordefining the scrap. But the company lacks in datacollection and effort for reduction. The study broughtout the importance of data collection of scrap by thequality team and importance of defining the scrap interms of quality. The study was successful with 88%reduction in total scrap cost. Cost saving through thestudy is estimated as Rs.23. 27 lakhs p.a. The companyhas to focus on continual improvement for furtherreduction of scrap. It is concluded from the study thatthe actual quality is lying with manufacturing processand any complicated problem can be solved bysystematic application of DMAIC approach.Fig. 12 PPM Before and after6.4 Zst LevelZst had been improved from 4.61 to 5.2 against thetarget of 5.21. The graph below shows theimprovement.8. REFERENCES[1] Hemant Urdhawareshe, (2000) “The Six SigmaApproach”, Quality & Productivity Journal, Vol01, 3rd Quarter, pp 1-6.[2] Julo Ponce, Adam Karahoca (2009), Data Miningand Knowledge Discovery in Real LifeApplications. Austria; I-Tech.[3] James R. Evans, James W, Dean JR(2006), TotalQuality Management Management, Organizationand Strategy, USA; South-Western College Pub.[4] Arash Shahim (1997), “Customer onal Management Conference, Germany,[5] Ibrahim A. Rawabdeh, (2005), “A model for theassessment of waste in job shop environments”International Journal of Operations & ProductionManagement, Vol. 25, pp 800-822.,[6] Jung-Lang Cheng, (2008) “Implementing sixsigma via TQM improvement an empirical study inTaiwan”, The TQM journal, Vol.20, pp 182-195.[7] Margaret P. Bates and Paul S. Philips, (1999).“sustainable waste management in the food anddrink industry’, British Food Journal , Vol. 101No.8, 1999, pp 580-589.[8] Thomas Pyzdek (2003), “The six sigma handbooka complete guide for green belts, black belts, andmanagers at all levels”. USA McGraw-Hill.Fig. 13 Zst Before and after6.5 Cost Benefit AnalysisCost Benefit analysis measures cost benefit achieved bythe project. The study incurred cost for itsimplementation and brings cost benefit to the company.Costs associated with study implementation are, Training cost.Manpower Cost.System and development cost.Cost of change ( material and machine)Costs saved through the implementation are,Scrap material cost.Scrap transportation cost.Manpower cost.Production cost.The total cost saved by study is estimated asRs.2327000 / Annum.6.6 Intangible BenefitsThere are many intangible benefits company relish afterthe completion of the projects, as intangible benefits arecannot be measured it cannot be identified as well.Some of the identified intangible benefits are listedbelow Increased product profit.Increased product reliability.Increased customer satisfaction.Increased employee satisfaction.Reduced unscheduled customer visit.SASTECH Journal59Volume 11, Issue 2, Sep 2012
An electronic assembly line from the Sanmina-SCI is selected for the study based on scrap value. The selected assembly line scraps 0.6% of the total revenue. The selected line produces class-3 products goes for defense. The main contribution of scrap is from customer rejects which is in term