Transcription
Unit 11OXIDATION REDUCTION TITRATIONSubjectsObjectivesAt the end of this unit , the student is expected to be able to :1- Understand the concept of the oxidation reduction titration .2- Calculate the potential of the titrated solution at any point during the titration .3- Select the suitable indicator for a certain titration .4- Understand the factors affecting the redox titration .5- Comprehend the pretreatment of the sample process prior to its redox titration .6- realize the wide applications of the redox reactions an titrations .
Unit 11Last update : 1/1/2014OXIDATION REDUCTION TITRATIONPage.NoSubjectsIntroductionAnother type of titration is the oxidation-reduction titration which is also called Redoxtitration , and is used to determine the oxidizing agent (oxidant ) or reducing agent (reductant ) in a solution. When performing redox titrations, either the reducing oroxidizing agent will be used as the titrant against the other agent. The purpose of thistitration is to determine the transfer of electrons from one substance to the other,similar to that of a redox reactions , in order to determine the reductant or oxidant. Theend point of such titrations can be determined by either a color changing indicator as inthis unit or a potentiometer .There are numerous applications for the redox titration inchemistry , pharmaceutical preparations , environmental analysis , agriculture andmany more .
Unit 11Last update : 1/1/2014OXIDATION REDUCTION TITRATIONPage.NoSubjectsRedox Titration CurvesTo evaluate a redox titration we need to know the shape of its titrationcurve. In an acid–base titration or a complexation titration, the titrationcurve shows how the concentration of H3O (as pH) or Mn (as pM)changes as we add titrant . Because in acid-base titration the indicator issensitive for pH changes while in complexation titration the indicator issensitive for changes in pM . For a redox titration it is convenient tomonitor the titration reaction’s potential instead of the concentration ofone species because the indicator is sensitive for changes in potential aswe will see later.
OXIDATION REDUCTION TITRATIONUnit 11Last update : 1/1/2014Page.NoSubjectsRedox titration curvesYou may recall from unit 10 that the Nernst equation relates a solution’spotential to the concentrations of reactants and products participating in theredox reaction. Consider, for example, a titration in which an analyte in areduced state, Ared, reacts with a titrant in an oxidized state, Box.nA ( BOX nB BRED ) ,nB ( Ared Aox nA ) ,E0BE0AnB Ared nA Box nB AOX nA Bred) titrant ()analyte (
Unit 11Last update : 1/1/2014OXIDATION REDUCTION TITRATIONPage.NoSubjectsRedox titration curveswhere Aox is the analyte’s oxidized form, and Bred is the titrant’s reducedform. The reaction’s potential, Ecell0 , is the difference between the standardpotentials for each half-reaction.Ecell0 EB0 – EA0After each addition of titrant the reaction between the analyte (titrand) and thetitrant reaches a state of equilibrium. Because the potential at equilibrium is zero,the analyte’s and the titrant’s reduction potentials are identical :
Unit 11Last update : 1/1/2014OXIDATION REDUCTION TITRATIONPage.NoSubjectsRedox titration curvesAt equilibrium and at any point during titration :Ecll EA – EB 0.0EA EBThis is an important observation because we can use either half-reaction to monitorthe changes of potential during titration.Before the equivalence point the titration mixture consists of appreciable quantitiesof the analyte’s oxidized and reduced forms. The concentration of unreacted titrant,however, is very small. The potential, therefore, is easier to calculate if we apply theNernst equation for the analyte’s half-reaction
AnA[ ARED ]OXIDATION REDUCTION TITRATIONUnit 11Last update : 1/1/2014Page.NoSubjectsRedox titration curves(1)Note that at the middle of the titration where half of [AOX] is converted to[ARED ] which means [AOX ] [[ARED ] and if the half reaction of the analyteis symmetrical , the potential of the titration solution ( conical flask solution )equal to the standard potential of the analyteE EA00.059[ AOX ]0.05900 log EA log 1 E AnA[ ARED ]nA
AnA[ ARED ]Unit 11Last update : 1/1/2014OXIDATION REDUCTION TITRATIONPage.NoSubjectsRedox titration curvesAfter the equivalence point it is easier to calculate the potential using the Nernstequation for the titrant’s half-reaction.(2)If the titrant half reaction is symmetrical , the potential of the titration solution will beequal to the standard potential of the titrant after adding double its equivalent amount i.e[BOX ] [BRED ] , then ,E EB 0At equivalent point : From the balanced redox reaction equation we can say that at theequivalent point , nA moles of Box have been added to nB moles of Ared ( see unit 3 ) so wecan write the following equation :
Unit 11Last update : 1/1/2014OXIDATION REDUCTION TITRATIONPage.NoSubjectsRedox titration curvesFrom the above equation we also write the following equations :The potential at equivalent point Eeq can be calculated either by using equation ( 1 )or equation ( 2 ) . Multiplying equation ( 1 ) by nA and equation ( 2 ) by nB andadding them together[ taking in consideration equation ( 3 )] we obtain :
Unit 11Last update : 1/1/2014OXIDATION REDUCTION TITRATIONPage.NoSubjectsRedox titration curvesEquation ( 5 ) can be used for the calculation of Eeq for any redox titration except inthe following two cases we should use equation ( 4 ) :Case one : If one of the participants of the redox reaction does not change itsoxidation state during the reaction e.g. H in the titration of Fe2 with MnO4- .
Unit 11Last update : 1/1/2014OXIDATION REDUCTION TITRATIONPage.NoSubjectsRedox titration curvesIn this case we should derive equation ( 4 ) thus :Multiplying equation ( 6 ) by nFe and equation ( 7 ) by nMn and adding the twoequations together we obtain :
Unit 11Last update : 1/1/2014OXIDATION REDUCTION TITRATIONRedox titration curvesFrom the above balanced equation we can write :Substituting in equation ( 8 ) and canceling we obtain :Page.NoSubjects
OXIDATION REDUCTION TITRATIONUnit 11Last update : 1/1/2014Page.NoSubjectsRedox titration curvesNote that equation ( 9 ) turns to equation ( 5 ) if [ H ] 1.0 M .Case two : If one of the half reactions is unsymmetrical . When one mole produceone mole or two moles produce two moles etc we call the half reactionsymmetrical otherwise it is unsymmetrical . For example , in the titration of Fe2 by Cr2O72- , we can see that the Cr2O72- half reaction is unsymmetrical :Cr2O72- 6 Fe2 14 H 2 Cr3 6 Fe3 7 H2ONote , one mole Cr2o72- produce two moles Cr3
Unit 11Last update : 1/1/2014OXIDATION REDUCTION TITRATIONRedox titration curvesMultiplying and adding as before we obtain :At equivalent point and from the balancedequation we obtain :Substituting in equation ( 10 ) and canceling we obtain :Page.NoSubjects
Unit 11Last update : 1/1/2014OXIDATION REDUCTION TITRATIONRedox titration curvesThe last equation indicates that Eeq in this titration depends on theconcentration of both H and Cr3 .Example: In the titration of 10 mL of 0.1 M Sn2 by 0.2 M Ce4 ,calculate the potential of the titration solution in the conical flask afterthe addition of the following volumes of thePage.NoSubjects
Unit 11Last update : 1/1/2014OXIDATION REDUCTION TITRATIONPage.NoSubjectsRedox titration curvestitrant Ce4 solution : (1) 5 mL , (2) 10 mL , (3) 15 mL ? And also calculate theconcentration of all ions at the equivalent point ?Solution :2 ( Ce4 e Ce3 )Sn2 Sn4 2 eECe0 1.44 VESn0 0.15 V2 Ce4 Sn2 2 Ce3 Sn4 First we calculate the volume of titrant at equivalent point Veq thus :
OXIDATION REDUCTION TITRATIONUnit 11Last update : 1/1/2014Page.NoSubjectsRedox titration curvesmmoles Ce4 mmoles Sn2 X 2 10 X 0.1 X 2 2no. mmoles2M Ce 0.2 Veq (mL) 10 mLVeq (mL)Veq (mL)(1) : After addition of 5 mL of Ce4 solution ( before equivalent point ) , weapply the Nernst equation to Sn half reaction thus :E ESn 0.15 0.059log21(5 X 0.2) X2(10 5)1[(10 X 0.1) ( 5 X 0.2 ) ]2(10 5) 0.15 V
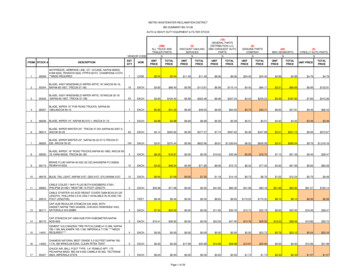
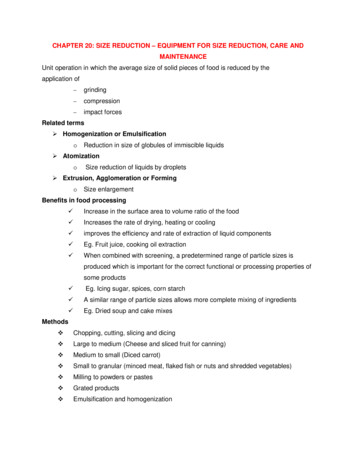
Unit 11Last update : 1/1/2014OXIDATION REDUCTION TITRATIONPage.NoSubjectsRedox titration curves(2) : After adding 10 mL i.e. at equivalentpoint we apply equation (5) thus :Eeq. p. 1 X 1.44 2 X 0.15 0.58 V(1 2)To calculate the concentration of the ions atequivalent point we apply Nernst equation toSn half reaction thus :4 Eeq. p. 0.58 ESn 0.15 0.059[ Sn ]log 2 2[ Sn ]From this equation we can calculate thefollowing :Titration curve for the titration of Fe2 withCe4 . eq.p is at middle of the curve .
OXIDATION REDUCTION TITRATIONUnit 11Last update : 1/1/2014Redox titration curves[ Sn 4 ] 3.8 X 10142 [ Sn ]10 X 0.1[Ce 3 ][ Sn ] 0.05 M 10 1024 [ Ce 3 ] 0.1 M[ Sn 4 ]0.0514 3.8X10[ Sn 2 ] [ Sn 2 ]2 [ Sn ] 1.3 X 10 16[ Ce 4 ] 2.6 X 10 16[ Ce 4 ]M 2M(3) : After adding 15 mL i.e. after equivalent point we apply Nernstequation to titrant half reaction thus :Page.NoSubjects
OXIDATION REDUCTION TITRATIONUnit 11Last update : 1/1/2014Page.NoSubjectsRedox titration curves2[ (15 X 0.2 ) (10 X 0.1) ]10.059(10 15 )E ECe 1.44 log 1.42 V21(10 X 0.1) x1(10 15)Example : In the titration of 10 mL 0.2 M of Fe2 by 0.01 M of MnO4- ,Calculate the potential of the conical flask solution after adding the followingvolumes of MnO4- titrant solution : (1) 10 mL , (2) Veq.p , (3) 50 mL ?
OXIDATION REDUCTION TITRATIONUnit 11Last update : 1/1/2014Redox titration curvesSolution :MnO4- 8H 5 e5 Fe2 Mn2 4H2O, EMn0 1.51 V5 Fe3 5 e , EFe0 0.77 VMnO4- 8 H 5 Fe2 Mn2 5 Fe3 4 H2Ommoles MnO4- mmoles Fe2 X 1/5 10 X 0.2 X 1/5 0. 4M MnO 0.01 4no. mmoles0.4 V. eq.p ( ml ) Veq. p ( ml ) Veq. p ( ml ) 40 mlPage.NoSubjects
OXIDATION REDUCTION TITRATIONUnit 11Last update : 1/1/2014Page.NoSubjectsRedox titration curves(1) : After adding 10 mL of titrant solution i.e. before equivalent point we applyNernst equation on analyte :(10 X 0.01)E E Fe 0.77 0.059log1(10 10 )515[ (10 X 0.2 ) (10 X 0.01) ]1(10 10 ) 0.74 V(2) At equivalent point i.e after adding 40 mL of titrant solution we can applyequation (5) since [H ] 1.0 MEeq 5 X 1.51 1 X 0.77 1.39 V(5 1)
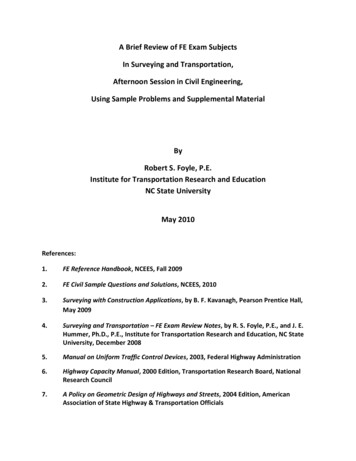
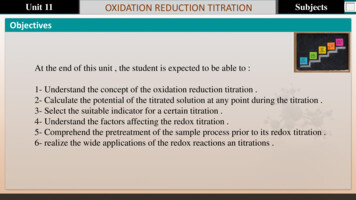
OXIDATION REDUCTION TITRATIONUnit 11Last update : 1/1/2014Page.NoSubjectsRedox titration curves(3) : After adding 50 mL i.e. after equivalentpoint we apply Nernst equation on the titrant ,thus :1[(50 X 0.01) (10 X 0.2 ) ]5 X (1)8(10 50 )E E 1.51 0.059 logMn51(10 X 0.2)5( 10 50 ) 1.50 VYou may have noticed that the potential in thetitration conical flask solution increasesduring titration in both previous examplesbecause we are titrating a reducing analyte byoxidizing titrant .When we reverse thea typical titration curve for titration ofFe2 with MnO4–. Note that the titration’sequivalence point is asymmetrical so theeq.p. is not at the middle of the curve .
Unit 11Last update : 1/1/2014OXIDATION REDUCTION TITRATIONPage.NoSubjectsFactors affecting redox titration curvetitration , the potential will decrease .1- Looking to the Nernst equation :we can see that the ratio : [ OX] / [RED] Is concentration independent becauseincreasing of [OX] will lead to increasing of [RED] so that the ratio and then thepotential will not be affected . Consequently , titration curves for redox reactionsare usually independent of analyte and titrant concentrations . This behavior is indistinct contrast to that observed in other types of titration .
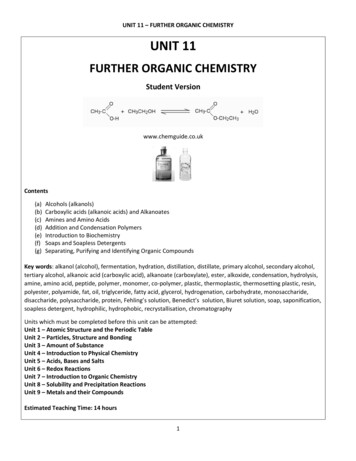
Unit 11Last update : 1/1/2014OXIDATION REDUCTION TITRATIONFactors affecting redox titration curve2- Completeness of the reaction : The higherthe value of Keq the more complete will be thereaction . The value of Keq depends on thedifference between the standard potential ofanalyte and titrant ( go back to unit 10 ) :log K eqN E 0 0.059Keq is also directly proportional to the numberof electrons transferred during the redoxreaction ( N ). The graph shows the effect of E0 on the shape of the titration curve . Note ifin the graph (N 1 ), the change in potential atequivalent point will be less .Page.NoSubjects
Unit 11Last update : 1/1/2014OXIDATION REDUCTION TITRATIONFactors affecting redox titration curve3- If nOx nRed the titration curve will beSymmetric and the equivalent point matchthe center point of the curve ( see theprevious titration curve for Fe2 with Ce4 ). But if nOx nRed , the curve is asymmetricand the two point do not match ( see theprevious curve for the titration of Fe2 withMnO4- ). The larger and the sharper thepotential change at the equivalent pointregion the more successful the titration why ? ( see unit 8 ) .Page.NoSubjects
Unit 11Last update : 1/1/2014OXIDATION REDUCTION TITRATIONTitration of a mixtureIt is possible to titrate simultaneously tworeducing forms with standard solution ofoxidizing form if there is a sufficientdifference in their standard potentials . Forexample Fe2 ( E0 0.77 ) and Sn2 ( E0 0.15 ) can be titrated with MnO4- , whereSn2 will react first because it is stronger asa reducing agent than Fe2 .The result istwo well separated equivalent points .Page.NoSubjects
Unit 11Last update : 1/1/2014OXIDATION REDUCTION TITRATIONTitration of a mixtureLikewise , two oxidants e.g. Ag (E0 0.8 )and Ce4 ( E0 1.44 ) can be titrated with astandard solution of a reducing agent e.g.Sn2 (E0 0.15) . Note that if the differencebetween the standard potential of themixture substances is not sufficient thenthe two equivalent point will overlapgiving one equivalent point .Page.NoSubjects
Unit 11Last update : 1/1/2014OXIDATION REDUCTION TITRATIONPage.NoSubjectsEquivalent point DetectionA redox titration’s equivalence point occurs when we react stoichiometricallyequivalent amounts of analyte and titrant. As is the case with acid–base andcomplexatio
Last update : 1/1/2014 OXIDATION REDUCTION TITRATION Page.No Introduction Another type of titration is the oxidation-reduction titration which is also called Redox titration , and is used to determine the oxidizing agent (oxidant ) or reducing agent ( reductant ) in a solution. When performing redox titrations, either the reducing or