Transcription
Number 347 October 27, 2004Mean Body Weight, Height, and Body Mass Index,United States 1960–2002by Cynthia L. Ogden, Ph.D.; Cheryl D. Fryar, M.S.P.H.; Margaret D. Carroll, M.S.P.H.; and Katherine M. Flegal, Ph.D.,Division of Health and Nutrition Examination SurveysAbstractThis report presents trends in national estimates of mean weight, height, andbody mass index (BMI) from the National Health Examination and the NationalHealth and Nutrition Examination Surveys between 1960 and 2002. The tablesincluded in this report present data for adults by sex, race/ethnicity, and age groupand for children by sex and year of age. Mean weight and BMI have increased forboth sexes, all race/ethnic groups, and all ages. Among adults, mean weightincreased more than 24 pounds. Although not as dramatically, mean height has alsoincreased for most ages and for both males and females.Keywords: body weight c height c National Health and Nutrition ExaminationSurvey (NHANES)IntroductionDuring the last 2 decades theprevalence of obesity and overweighthas increased in the United States (1–3).This is in part due to a shift in thedistribution of BMI (BMI, weight inkilograms divided by height in meterssquared) of the entire population (4).This report presents the changes inmean body weight, height, and BMI forthe entire U.S. population from 1960 to2002.MethodsThe National Health and NutritionExamination Survey (NHANES)program of the National Center forHealth Statistics, Centers for DiseaseControl and Prevention, includes a seriesof cross-sectional nationallyrepresentative health examinationsurveys beginning in 1960. In eachsurvey a nationally representativesample of the U.S. civiliannoninstitutionalized population wasselected using a complex, stratified,multistage probability cluster samplingdesign. A home interview was followedby a physical examination in a mobileexamination center.Beginning in 1999, NHANESbecame a continuous survey. Theprocedures followed to select the sampleand conduct the interview andexamination were similar to those forU.S. DEPARTMENT OF HEALTH AND HUMAN SERVICESCenters for Disease Control and PreventionNational Center for Health Statisticsprevious surveys. Public-use data fromthe continuous NHANES are released in2-year groupings; however, the moststable and reliable estimates areobtained from more than 2 years ofdata. Previous national surveys includethe first, second, and third NationalHealth Examination Surveys (NHES I,1960–62; NHES II, 1963–65; NHES III,1966–70) and the first, second, and thirdNational Health and NutritionExamination Surveys (NHANES I,1971–74; NHANES II, 1976–80;NHANES III, 1988–94). A special studyof Hispanic populations (the HispanicHealth and Nutrition ExaminationSurvey (HHANES)) in three regions ofthe United States was conducted from1982 to 1984. The Mexican-Americansubpopulation sampled in HHANES waslocated entirely in the southwesternUnited States (5).Population means and standarderrors of the mean are weighted toproduce national estimates. The sampleweights adjust for oversampling ofcertain populations, noncoverage, andnonresponse. Standard errors wereestimated using SUDAAN by TaylorSeries Linearization (6). A relativestandard error (RSE) greater than30 percent has been recommended to
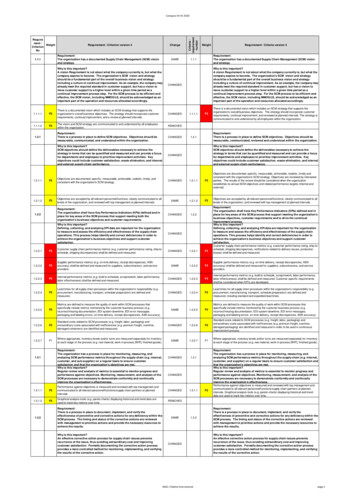
2Advance Data No. 347 October 27, 2004define estimates that are not reliable. Inthese tables, all of the RSEs met thisreliability criterion. Pregnant femaleswere excluded from all the analyses.Statistical tests on trends weremodeled using PROC REGRESS. Allmodels included interaction terms forage and survey because mean age withinan age group (e.g., 20–29 years) mayhave varied by survey. Significance wasdetermined using the WALD F test (7).Tests for trends on the total groups ofadults (20–74 years of age) were doneon age-adjusted values; consequently, nointeraction terms were included. Whenonly two surveys were available (i.e., 20years and over, etc.), differences wereevaluated using t-tests. Significance wasdetermined at the 0.05 level.ResultsTables 1 and 2 show the meanweights for children over time inEnglish and Metric units. Among6–11-year-old children, mean weightincreased from approximately 65 poundsin 1963–5 to almost 74 pounds in1999–2002. This represents almost a 9pound increase for both boys and girls6–11 years of age. Among 12–17-yearold teens, the mean weight of boysincreased more than 15 pounds from125 to 141 pounds and the mean weightof girls increased approximately 12pounds from 118 to 130 pounds betweenthe 1960s and 2002. Mean heights forchildren are found in tables 3 and 4.Mean heights also increased between the1960s and 2002 with the mean height ofboys 6–11 years of age increasing 0.8inches and the mean height of girls 6–11years of age increasing 0.6 inches.Among 12–17-year-old teens, the meanheight of boys increased 0.7 incheswhile that of girls increased 0.3 inches,although these findings were notstatistically significant. Mean BMIs forchildren are found in table 5. Amongboth boys and girls 12–17 years of agemean BMI increased by more than 4units between 1963–5 and 1999–2002.Changes in adult weight and heightare shown in tables 6–9 in both Englishand Metric units. On average, both menand women gained more than 24 poundsbetween the early 1960s and 2002.During the same time period, meanheight increased approximately 1 inch.In 1999–2002 mean weight of men 20years and over was almost 190 poundswhile among women the mean weightwas approximately 163 pounds. Meanheight for men in 1999–2002 wasapproximately 69 inches and for womenwas approximately 64 inches. Changesin mean BMI (table 10) have alsooccurred. Between the early 1960s and1999–2002 mean BMI for men 20–74years of age increased from just over 25to almost 28. Similarly, for womenmean BMI increased from almost 25 tojust over 28.Changes in average weight byrace/ethnicity are shown in tables 11 and12. Between NHANES III andNHANES 1999–2002 mean weight ofnon-Hispanic white adults increasedapproximately 10 pounds. Amongnon-Hispanic black or African Americanmen the increase was approximately 8pounds, but among black or AfricanAmerican men 60 years and over theincrease was over 13 pounds. Theaverage weight of non-Hispanic black orAfrican American women increasedapproximately 13 pounds with thelargest increase in the 20–39 year agegroup (more than 16 pounds). AmongMexican Americans the increase was4–5 pounds. However, the increase inaverage weight among MexicanAmerican men 60–74 years of agebetween HHANES in the early 1980sand NHANES 1999–2002 was over 19pounds. Between NHANES III andNHANES 1999–2002 average heightincreased less than one-half an inch fornon-Hispanic white persons, nonHispanic black or African Americanpersons, and Mexican American persons(tables 13 and 14). Table 15 shows meanBMIs by race/ethnicity. Amongnon-Hispanic white persons, nonHispanic black or African American, andMexican Americans mean BMI hasincreased. Among Mexican Americans20–74 years of age mean BMI increasedapproximately 2 units for both men andwomen between 1982–4 and 1999–2002. Non-Hispanic black or AfricanAmerican women 20 years and overhave seen a similar increase between1988–94 and 1999–2002.ConclusionsAverage weight has increaseddramatically in the last 40 years withthe greatest increases seen in adults.Mean BMI has also increased. Althoughheight has also increased this increasehas been much more modest.References1. Flegal KM, Carroll MD, Ogden CL,Johnson CL. Prevalence and trendsin obesity among U.S. adults,1999–2000. JAMA 288:1723–7.2002.2. Ogden CL, Flegal KM, Carroll MD,Johnson CL. Prevalence and trendsin overweight among U.S. childrenand adolescents, 1999–2000. JAMA288:1728–32. 2002.3. Hedley AA, Ogden CL, Johnson CL,Carroll, MD, Curtin LR, Flegal KM.Prevalence of overweight and obesityamong U.S. children, adolescents,and adults, 1999–2002. JAMA291:2847–50. 2004.4. Flegal KM, Troiano RP. Changes inthe distribution of body mass indexof adults and children in the U.S.population. Int J Obes Relat MetabDisord 24(7):807–18. 2000.5. More information on the NHANESsurvey design and data collectionmethods, as well as public-usemicrodata files, can be found at theNHANES Web site: http://www.cdc.gov/nchs/nhanes.htm.6. Wolter KM. Introduction to varianceestimation, New York: SpringerVerlag. 1990.7. Skinner CJ, Holt D, Smith TMF.Analysis of complex surveys,Chichester: John Wiley & Sons.1989.
Table 1. Mean weight (pounds) by survey, sex, and age; children: United StatesNHES II, 1963–65Sex and ageSamplesizeNHES III, 1966–70MeanStandarderror ofthe meanSamplesizeNHANES I, 1971–74MeanStandarderror ofthe meanSamplesizeNHANES II, 1976–80MeanStandarderror ofthe meanSamplesizeNHANES III, 1988–94MeanStandarderror ofthe meanSamplesizeNHANES 1999–2002MeanStandarderror ofthe meanSamplesizeMeanStandarderror ofthe .72.62.73.32.7Female2 years1 .3 years1 .4 years1 .5 years . .6 years . .7 years1 .8 years1 .9 years1 .10 years111 years1 .12 years113 years114 years115 years116 years117 years118 years119 years1.Advance Data No. 347 October 27, 20042 years .3 years . .4 years1 .5 years1 .6 years1 .7 years1 .8 years1 .9 years1 .10 years111 years1 .12 years113 years114 years115 years116 years117 years118 years119 years1– – – Data not available.1Statistically significant trend or difference p 0.05 for all years available.NOTE: NHES II: National Health Examination Survey, Cycle II, ages 6–11 years; NHES III: National Health Examination Survey, Cycle III, ages 12–17 years; and NHANES: National Health and Nutrition Examination Survey.3
NHES II, 1963–65Sex and ageMeanStandarderror ofthe meanSamplesizeNHANES I, 1971–74MeanStandarderror ofthe meanSamplesizeNHANES II, 1976–80MeanStandarderror ofthe meanSamplesizeNHANES III, 1988–94MeanStandarderror ofthe meanSamplesizeNHANES 1999–2002MeanStandarderror ofthe meanSamplesizeMeanStandarderror ofthe 1.20.71.01.31.11.41.01.71.21.21.51.2Female2 years1 .3 years1 .4 years1 .5 years . .6 years . .7 years1 .8 years1 .9 years1 .10 years111 years1 .12 years113 years114 years115 years116 years117 years118 years119 years1.- - - Data not available.1Statistically significant trend or difference p 0.05 for all years available.NOTE: NHES II: National Health Examination Survey, Cycle II, ages 6–11 years; NHES III: National Health Examination Survey, Cycle III, ages 12–17 years; and NHANES: National Health and Nutrition Examination Survey.Advance Data No. 347 October 27, 2004Male2 years . . . .3 years . . . . .4 years1 . . . .5 years1 . . . .6 years1 . . . .7 years1 . . . .8 years1 . . . .9 years1 . . . .10 years1 . . .11 years1 . . . .12 years1 . . .13 years1 . . .14 years1 . . .15 years1 . . .16 years1 . . .17 years1 . . .18 years1 . . .19 years1 . . .SamplesizeNHES III, 1966–704Table 2. Mean weight (kilograms) by survey, sex, and age; children: United States
Table 3. Mean height (inches) by survey, sex, and age; children: United StatesNHES II, 1963–65Sex and ageMeanStandarderror ofthe meanSamplesizeNHANES I, 1971–74MeanStandarderror ofthe meanSamplesizeNHANES II, 1976–80MeanStandarderror ofthe meanSamplesizeNHANES III, 1988–94MeanStandarderror ofthe meanSamplesizeNHANES 1999–2002MeanStandarderror ofthe meanSamplesizeMeanStandarderror ofthe male2 years .3 years1 .4 years1 .5 years . .6 years . .7 years . .8 years1 .9 years1 .10 years111 years1 .12 years .13 years .14 years .15 years .16 years .17 years .18 years119 years .Advance Data No. 347 October 27, 2004Male2 years . . . .3 years1 . . . .4 years1 . . . .5 years . . . . .6 years . . . . .7 years . . . . .8 years1 . . . .9 years1 . . . .10 years1 . . .11 years1 . . . .12 years . . . .13 years . . . .14 years . . . .15 years . . . .16 years . . . .17 years . . . .18 years1 . . .19 years . . . .SamplesizeNHES III, 1966–70- - - Data not available.1Statistically significant trend or difference p 0.05 for all years available.NOTE: NHES II: National Health Examination Survey, Cycle II, ages 6–11 years; NHES III: National Health Examination Survey, Cycle III, ages 12–17 years; and NHANES: National Health and Nutrition Examination Survey.5
NHES II, 1963–65Sex and ageMeanStandarderror ofthe meanSamplesizeNHANES I, 1971–74MeanStandarderror ofthe meanSamplesizeNHANES II, 1976–80MeanStandarderror ofthe meanSamplesizeNHANES III, 1988–94MeanStandarderror ofthe meanSamplesizeNHANES 1999–2002MeanStandarderror ofthe meanSamplesizeMeanStandarderror ofthe .50.60.70.90.70.70.60.60.60.50.60.50.7Female2 years .3 years1 .4 years1 .5 years . .6 years . .7 years . .8 years1 .9 years1 .10 years111 years1 .12 years .13 years .14 years .15 years .16 years .17 years .18 years119 years .- - - Data not available.1Statistically significant trend or difference p 0.05 for all years available.NOTE: NHES II: National Health Examination Survey, Cycle II, ages 6–11 years; NHES III: National Health Examination Survey, Cycle III, ages 12–17 years; and NHANES: National Health and Nutrition Examination Survey.Advance Data No. 347 October 27, 2004Male2 years . . . . .3 years1 . . . .4 years1 . . . .5 years . . . . .6 years . . . . .7 years . . . . .8 years1 . . . .9 years1 . . . .10 years1 . . .11 years1 . . . .12 years . . . .13 years . . . .14 years . . . .15 years . . . .16 years . . . .17 years . . . .18 years1 . . .19 years . . . .SamplesizeNHES III, 1966–706Table 4. Mean height (centimeters) by survey, sex, and age; children: United States
Table 5. Mean body mass index (BMI) by survey, sex, and age; children: United StatesNHES II, 1963–65Sex and ageMeanStandarderror ofthe meanSamplesizeNHANES I, 1971–74MeanStandarderror ofthe meanSamplesizeNHANES II, 1976–80MeanStandarderror ofthe meanSamplesizeNHANES III, 1988–94MeanStandarderror ofthe meanSamplesizeNHANES 1999–2002MeanStandarderror ofthe meanSamplesizeMeanStandarderror ofthe 0.50.30.30.40.40.40.40.50.40.40.50.4Female2 years1 .3 years . .4 years1 .5 years . .6 years1 .7 years1 .8 years1 .9 years1 .10 years111 years1 .12 years113 years114 years115 years116 years117 years118 years119 years1.Advance Data No. 347 October 27, 2004Male2 years1 . . . .3 years . . . . .4 years1 . . . .5 years1 . . . .6 years1 . . . .7 years1 . . . .8 years1 . . . .9 years1 . . . .10 years1 . . .11 years1 . . . .12 years1 . . .13 years1 . . .14 years1 . . .15 years1 . . .16 years1 . . .17 years1 . . .18 years1 . . .19 years1 . . .SamplesizeNHES III, 1966–70- - - Data not available.1Statistically significant trend or difference p 0.05 for all years available.NOTES: BMI is calculated as weight in kilograms divided by square of height in meters. NHES II: National Health Examination Survey, Cycle II, ages 6–11 years; NHES III: National Health Examination Survey, Cycle III, ages 12–17 years; NHANES:National Health and Nutrition Examination Survey.7
NHES I, 1960–62Sex and ageSamplesizeNHANES I, 1971–74MeanStandarderror ofthe meanSamplesize8Table 6. Mean weight (pounds) by survey, sex, and age group; adults: United StatesNHANES II, 1976–80MeanStandarderror ofthe meanSamplesizeNHANES III, 1988–94MeanStandarderror ofthe meanSamplesizeNHANES 1999–2002MeanStandarderror ofthe meanSamplesizeMeanStandarderror ofthe meanMale120 years and over20–74 years . . . .20–29 years . .30–39 years . .40–49 years . .50–59 years . .60–74 years . .75 years and 2.42.51.22.1Female120 years and over20–74 years . . . .20–29 years . .30–39 years . .40–49 years . .50–59 years . .60–74 years . .75 years and over.- - - Data not available.1Statistically significant trend or difference p 0.05 for all years available.NOTE: NHES I: National Health Examination Survey, Cycle I, ages 20–74 years; and NHANES: National Health and Nutrition Examination Survey.Advance Data No. 347 October 27, 2004.
Table 7. Mean weight (kilograms) by survey, sex, and age group; adults: United StatesNHES I, 1960–62Sex and ageSamplesizeNHANES I, 1971–74MeanStandarderror ofthe meanSamplesizeNHANES II, 1976–80MeanStandarderror ofthe meanSamplesizeNHANES III, 1988–94MeanStandarderror ofthe meanSamplesizeNHANES 1999–2002MeanStandarderror ofthe meanSamplesizeMeanStandarderror ofthe meanMale120 years and over20–74 years . . . .20–29 years . .30–39 years . .40–49 years . .50–59 years . .60–74 years . .75 years and 120 years and over20–74 years . . . .20–29 years . .30–39 years . .40–49 years . .50–59 years . .60–74 years . .75 years and over.- - - Data not available.1Statistically significant trend or difference p 0.05 for all years available.NOTE: NHES I: National Health Examination Survey, Cycle I, ages 20–74 years; and NHANES: National Health and Nutrition Examination Survey.Advance Data No. 347 October 27, 2004.9
NHES I, 1960–62Sex and ageSamplesize10Table 8. Mean height (inches)
African American women increased approximately 13 pounds with the largest increase in the 20–39 year age group (more than 16 pounds). Among Mexican Americans the increase was 4–5 pounds. However, the increase in average weight among Mexican American men 60–74 years of age between HH
