Transcription
Introduction to Python:NumPy, Pandas and PlottingBioinformatics and Research Computing (BaRC)http://barc.wi.mit.edu/hot topics/
NumPy Numerical Python Efficient multidimensional array processingand operations– Linear algebra (matrix operations)– Mathematical functions Array (objects) must be of the same type2
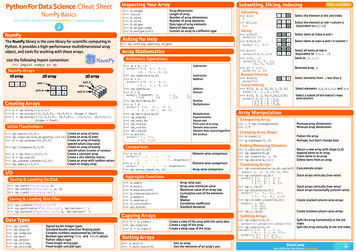
NumPy: SlicingMcKinney, W., Python for Data Analysis, 2nd Ed. (2017)3
Pandas Efficient for processing tabular, or panel, data Built on top of NumPy Data structures: Series and DataFrame (DF)– Series: one-dimensional , same data type– DataFrame: two-dimensional, columns of different data types– index can be integer (0,1, ) or non-integer ('GeneA','GeneB', 113FAM138A4OR4G4P0005OR4F5000axis 10.1158 0.0210411.0316.75axis 00.1602 0.06433 0.046740.050450 0.029454
What can you do with aPandas DataFrame? Filter– Select rows/columns Sort Numerical or Mathematical operations (e.g.mean) Group by column(s) Many e/5
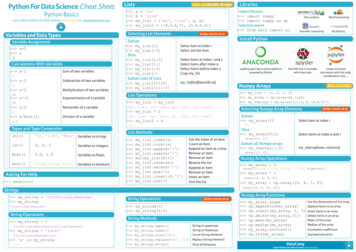
DataFrame Slicing:Selecting DataEnsembl IDGeneGTEX1117FGTEX111CUENSG00000223972 DDX11L10.1082ENSG00000227232 WASH7P21.4ENSG00000243485 MIR1302-11ENSG00000237613 FAM138A loc by row or column namese.g. "Gene", "GTEX-117F"GTEX111FC0.1158 0.0210411.0316.750.16020.06433 0.046740.050450 0.02945ENSG00000268020 OR4G4P000ENSG00000186092 OR4F5000 iloc by integer location,i.e. column or row numbere.g. 1,2,36
"Tidy" Datahttps://pandas.pydata.org/Pandas Cheat Sheet.pdf7
"Tidy" Data ExampleGeneGeneAdipose Adipose 0FAM138AHeart0.1158 0.05103 0.03214 0.0483311.62Heart0.1449.95310.350 .6200.048339.9530.090180.14410.350.1448
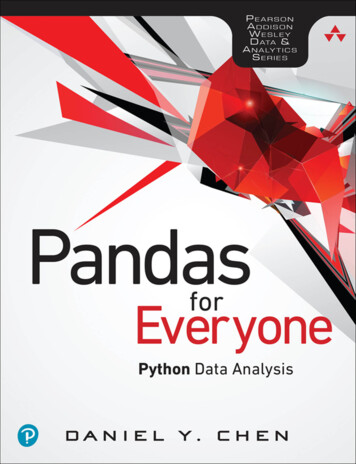
Pandas - groupby Split, Apply and Combine9
Plotting Matplotlib Seaborn Plotly10
Introduction to Python: NumPy, Pandas and Plotting Bioinformatics and Research Computing (BaRC) . Python for Data Analysis, 2 nd Ed. (2017) 3 . Ex 1. Pandas Efficient for processing tabular, or panel, data Built on top of NumPy Data structures: Series and DataFrame (DF) – S