Transcription
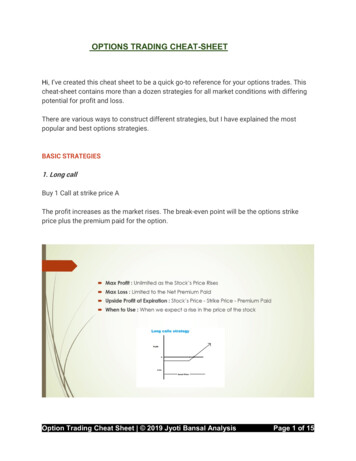
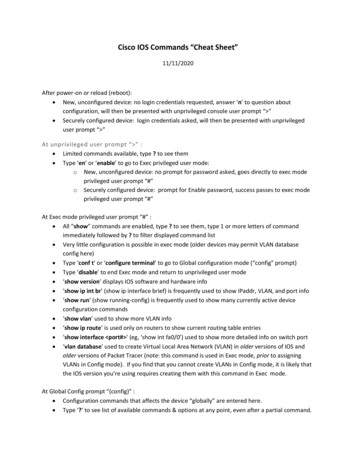
Python For Data Science Cheat SheetNumPy BasicsLearn Python for Data Science Interactively at www.DataCamp.comNumPy2The NumPy library is the core library for scientific computing inPython. It provides a high-performance multidimensional arrayobject, and tools for working with these arrays. import numpy as npNumPy Arrays1232D array3D arrayaxis 1axis 01.523456axis 2axis 1axis 0 a np.array([1,2,3]) b np.array([(1.5,2,3), (4,5,6)], dtype float) c np.array([[(1.5,2,3), (4,5,6)], [(3,2,1), (4,5,6)]],dtype float)Initial Placeholders np.zeros((3,4))Create an array of zeros np.ones((2,3,4),dtype np.int16) Create an array of ones d np.arange(10,25,5)Create an array of evenlyspaced values (step value) np.linspace(0,2,9)Create an array of evenlyspaced values (number of samples) e np.full((2,2),7)Create a constant array f np.eye(2)Create a 2X2 identity matrix np.random.random((2,2))Create an array with random values np.empty((3,2))Create an empty arrayI/OSaving & Loading On Disk np.save('my array', a) np.savez('array.npz', a, b) np.load('my array.npy')Saving & Loading Text Files np.loadtxt("myfile.txt") np.genfromtxt("my file.csv", delimiter ',') np.savetxt("myarray.txt", a, delimiter " ")Data b.dtype.nameb.astype(int)Subsetting, Slicing, IndexingArray dimensionsLength of arrayNumber of array dimensionsNumber of array elementsData type of array elementsName of data typeConvert an array to a different typeSigned 64-bit integer typesStandard double-precision floating pointComplex numbers represented by 128 floatsBoolean type storing TRUE and FALSE valuesPython object typeFixed-length string typeFixed-length unicode typeSubsettingAsking For Help123Select the element at the 2nd index b[1,2]6.01.523456Select the element at row 1 column 2(equivalent to b[1][2]) a[0:2]123Select items at index 0 and 11.523Select items at rows 0 and 1 in column 14561.5234563Slicing b[0:2,1] np.info(np.ndarray.dtype)array([ 2.,Array MathematicsAlso see Lists a[2]array([1, 2])5.]) b[:1] c[1,.]Select all items at row 0(equivalent to b[0:1, :])Same as [1,:,:] a[ : :-1]Reversed array aarray([[1.5, 2., 3.]])array([[[ 3., 2., 1.],[ 4., 5., 6.]]]) g a - bSubtraction np.subtract(a,b) b aSubtractionAddition a[a 2] np.add(b,a) a / bAdditionDivision b[[1, 0, 1, 0],[0, 1, 2, 0]]Select elements (1,0),(0,1),(1,2) and (0,0) b[[1, 0, 1, 0]][:,[0,1,2,0]]Select a subset of the matrix’s rowsand columnsarray([[-0.5, 0. , 0. ],[-3. , -3. , -3. ]])array([[ 2.5,[ 5. ,4. ,7. ,array([[ 0.66666667, 1.[ 0.25, 0.4array([[[ 1.5,4. ,4. ,10. s(b)np.log(a)e.dot(f)array([[ 7.,[ 7.,array([3, 2, 1])6. ],9. ]]) np.divide(a,b) a * bCreating Arrays Arithmetic OperationsUse the following import convention:1D arrayInspecting Your Array, 1., 0.5],]])9. ],18. ionSquare rootPrint sines of an arrayElement-wise cosineElement-wise natural logarithmDot product7.],7.]]) a bElement-wise comparison a 2Element-wise comparison np.array equal(a, b)Array-wise comparisonarray([[False, True, True],[False, False, False]], dtype bool)array([True, False, False], dtype bool)Aggregate Functionsa.sum()a.min()b.max(axis 0)b.cumsum(axis e sumArray-wise minimum valueMaximum value of an array rowCumulative sum of the elementsMeanMedianCorrelation coefficientStandard deviationCopying Arrays h a.view() np.copy(a) h a.copy()23Fancy Indexingarray([ 4. , 2. , 6. , 1.5])array([[ 4. ,5.[ 1.5, 2.[ 4. , 5.[ 1.5, 2.,,,,6.3.6.3.,,,,4. ],1.5],4. ],1.5]])Create a view of the array with the same dataCreate a copy of the arrayCreate a deep copy of the arraySort an arraySort the elements of an array's axisSelect elements from a less than 2Array ManipulationTransposing Array i np.transpose(b) i.TPermute array dimensionsPermute array dimensions b.ravel() g.reshape(3,-2)Flatten the arrayReshape, but don’t change data Return a new array with shape (2,6)Append items to an arrayInsert items in an arrayDelete items from an arrayChanging Array Shapeh.resize((2,6))np.append(h,g)np.insert(a, 1, 5)np.delete(a,[1])Combining Arrays np.concatenate((a,d),axis 0) Concatenate arraysarray([ 1,2,3, 10, 15, 20]) np.vstack((a,b))Stack arrays vertically (row-wise) np.r [e,f] np.hstack((e,f))Stack arrays vertically (row-wise)Stack arrays horizontally (column-wise)array([[ 1. ,[ 1.5,[ 4. ,array([[ 7.,[ 7.,2. ,2. ,5. ,7.,7.,3. ],3. ],6. ]])1.,0.,0.],1.]]) np.column stack((a,d))Create stacked column-wise arrays np.c [a,d]Create stacked column-wise arrays np.hsplit(a,3)Split the array horizontally at the 3rdindexSplit the array vertically at the 2nd indexarray([[ 1, 10],[ 2, 15],[ 3, 20]])Splitting ArraysSorting Arrays a.sort() c.sort(axis 0)1array([1])Adding/Removing ElementsComparison Boolean Indexing[array([1]),array([2]),array([3])] np.vsplit(c,2)[array([[[ 1.5,[ 4. ,array([[[ 3.,[ 4.,2. , 1. ],5. , 6. ]]]),2., 3.],5., 6.]]])]DataCampLearn Python for Data Science Interactively
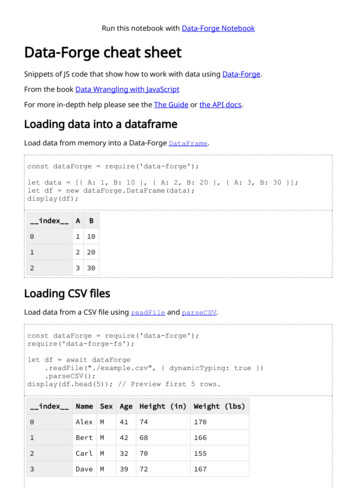
Data Wranglingwith pandasCheat Sheethttp://pandas.pydata.orgTidy Data – A foundation for wrangling in pandasFMAIn a tidydata set:&Each variable is savedin its own columnSyntax – Creating dy data complements pandas’s vectorizedoperations. pandas will automatically preserveobservations as you manipulate variables. Noother format works as intuitively with pandas.Each observation issaved in its own rowM*AM*AFdf.sort values('mpg')Order rows by values of a column (low to high).df.sort values('mpg',ascending False)Order rows by values of a column (high to low).pd.melt(df)Gather columns into rows.df.pivot(columns 'var', values 'val')Spread rows into columns.df.rename(columns {'y':'year'})Rename the columns of a DataFramedf.sort index()Sort the index of a DataFramedf.reset index()Reset index of DataFrame to row numbers, movingindex to columns.df pd.DataFrame([[4, 7, 10],[5, 8, 11],[6, 9, 12]],index [1, 2, 3],columns ['a', 'b', 'c'])Specify values for each row.aMReshaping Data – Change the layout of a data setdf pd.DataFrame({"a" : [4 ,5, 6],"b" : [7, 8, 9],"c" : [10, 11, 12]},index [1, 2, 3])Specify values for each column.nFpd.concat([df1,df2], axis 1)Append columns of DataFramespd.concat([df1,df2])Append rows of DataFramesSubset Observations (Rows)df.drop(columns ['Length','Height'])Drop columns from DataFrameSubset Variables (Columns)vdf pd.DataFrame({"a" : [4 ,5, 6],"b" : [7, 8, 9],"c" : [10, 11, 12]},index pd.MultiIndex.from tuples([('d',1),('d',2),('e',2)],names ['n','v'])))Create DataFrame with a MultiIndexMethod ChainingMost pandas methods return a DataFrame so thatanother pandas method can be applied to theresult. This improves readability of code.df (pd.melt(df).rename(columns {'variable' : 'var','value' : 'val'}).query('val 200'))df[df.Length 7]Extract rows that meet logicalcriteria.df.drop duplicates()Remove duplicate rows (onlyconsiders columns).df.head(n)Select first n rows.df.tail(n)Select last n rows.df.sample(frac 0.5)Randomly select fraction of rows.df.sample(n 10)Randomly select n rows.df.iloc[10:20]Select rows by position.df.nlargest(n, 'value')Select and order top n entries.df.nsmallest(n, 'value')Select and order bottom n entries.Logic in Python (and pandas) Less than! Not equal to Greater thandf.column.isin(values)Group membership Equalspd.isnull(obj)Is NaN Less than or equalspd.notnull(obj)Is not NaN Greater than or equals&, , , ,df.any(),df.all()Logical and, or, not, xor, any, alldf[['width','length','species']]Select multiple columns with specific names.df['width'] or df.widthSelect single column with specific name.df.filter(regex 'regex')Select columns whose name matches regular expression regex.regex (Regular Expressions) Examples'\.'Matches strings containing a period '.''Length 'Matches strings ending with word 'Length'' Sepal'Matches strings beginning with the word 'Sepal'' x[1-5] 'Matches strings beginning with 'x' and ending with 1,2,3,4,5'' (?!Species ).*'Matches strings except the string 'Species'df.loc[:,'x2':'x4']Select all columns between x2 and x4 (inclusive).df.iloc[:,[1,2,5]]Select columns in positions 1, 2 and 5 (first column is 0).df.loc[df['a'] 10, ['a','c']]Select rows meeting logical condition, and only the specific columns .http://pandas.pydata.org/ This cheat sheet inspired by Rstudio Data Wrangling Cheatsheet 2/data-wrangling-cheatsheet.pdf) Written by Irv Lustig, Princeton Consultants
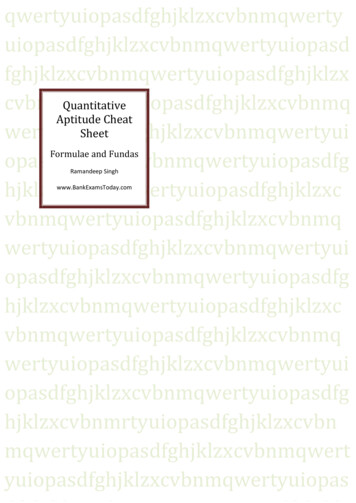
Summarize Datadf['w'].value counts()Count number of rows with each unique value of variablelen(df)# of rows in DataFrame.df['w'].nunique()# of distinct values in a column.df.describe()Basic descriptive statistics for each column (or GroupBy)pandas provides a large set of summary functions that operate ondifferent kinds of pandas objects (DataFrame columns, Series,GroupBy, Expanding and Rolling (see below)) and produce singlevalues for each of the groups. When applied to a DataFrame, theresult is returned as a pandas Series for each column. Examples:sum()Sum values of each object.count()Count non-NA/null values ofeach object.median()Median value of each object.quantile([0.25,0.75])Quantiles of each object.apply(function)Apply function to each object.min()Minimum value in each object.max()Maximum value in each object.mean()Mean value of each object.var()Variance of each object.std()Standard deviation of eachobject.Group Datadf.groupby(by "col")Return a GroupBy object,grouped by values in columnnamed "col".df.groupby(level "ind")Return a GroupBy object,grouped by values in indexlevel named "ind".All of the summary functions listed above can be applied to a group.Additional GroupBy functions:size()agg(function)Size of each group.Aggregate group using function.Windowsdf.expanding()Return an Expanding object allowing summary functions to beapplied cumulatively.df.rolling(n)Return a Rolling object allowing summary functions to beapplied to windows of length n.Combine Data SetsHandling Missing Datadf.dropna()Drop rows with any column having NA/null data.df.fillna(value)Replace all NA/null data with value.Make New Columnsdf.assign(Area lambda df: df.Length*df.Height)Compute and append one or more new columns.df['Volume'] df.Length*df.Height*df.DepthAdd single column.pd.qcut(df.col, n, labels False)Bin column into n buckets.VectorfunctionVectorfunctionpandas provides a large set of vector functions that operate on allcolumns of a DataFrame or a single selected column (a pandasSeries). These functions produce vectors of values for each of thecolumns, or a single Series for the individual Series. Examples:min(axis 1)max(axis 1)Element-wise min.Element-wise max.clip(lower -10,upper 10) abs()Trim values at input thresholds Absolute value.The examples below can also be applied to groups. In this case, thefunction is applied on a per-group basis, and the returned vectorsare of the length of the original DataFrame.shift(1)Copy with values shifted by 1.rank(method 'dense')Ranks with no gaps.rank(method 'min')Ranks. Ties get min rank.rank(pct True)Ranks rescaled to interval [0, 1].rank(method 'first')Ranks. Ties go to first value.shift(-1)Copy with values lagged by 1.cumsum()Cumulative sum.cummax()Cumulative max.cummin()Cumulative min.cumprod()Cumulative product.Plottingdf.plot.hist()Histogram for each columndf.plot.scatter(x 'w',y 'h')Scatter chart using pairs of pointshttp://pandas.pydata.org/ This cheat sheet inspired by Rstudio Data Wrangling Cheatsheet 2/data-wrangling-cheatsheet.pdf) Written by Irv Lustig, Princeton Consultantsadfbdfx1ABCx1ABDx2123x3TFTStandard Joinsx1ABCx2 x3 pd.merge(adf, bdf,1Thow 'left', on 'x1')2FJoin matching rows from bdf to adf.3 NaNx1 x2A 1.0B 2.0D NaNx3TFTx1ABx3 pd.merge(adf, bdf,Thow 'inner', on 'x1')FJoin data. Retain only rows in both sets.x212pd.merge(adf, bdf,how 'right', on 'x1')Join matching rows from adf to bdf.x1 x2 x3 pd.merge(adf, bdf,A 1Thow 'outer', on 'x1')B2FJoin data. Retain all values, all rows.C3 NaND NaN TFiltering Joinsadf[adf.x1.isin(bdf.x1)]x1 x2All rows in adf that have a match in bdf.A 1B 2x1 x2C 3adf[ adf.x1.isin(bdf.x1)]All rows in adf that do not have a match in bdf.ydfzdfx1ABCx1BCDx2123x2234Set-like Operationsx1 x2B 2C 3pd.merge(ydf, zdf)Rows that appear in both ydf and zdf(Intersection).x1ABCDpd.merge(ydf, zdf, how 'outer')Rows that appear in either or both ydf and zdf(Union).x21234x1 x2A 1pd.merge(ydf, zdf, how 'outer',indicator True).query(' merge "left only"').drop(columns [' merge'])Rows that appear in ydf but not zdf (Setdiff).
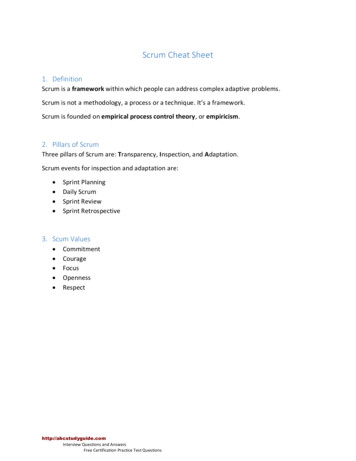
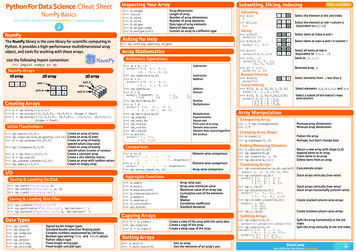
Python For Data Science Cheat SheetMatplotlibPlot Anatomy & WorkflowPlot AnatomyAxes/SubplotLearn Python Interactively at www.DataCamp.comMatplotlibY-axisMatplotlib is a Python 2D plotting library which producespublication-quality figures in a variety of hardcopy formatsand interactive environments acrossplatforms.1Prepare The DataAlso see Lists & NumPy1D Data import numpy as npx np.linspace(0, 10, 100)y np.cos(x)z np.sin(x)2D Data or Images 2data 2 * np.random.random((10, 10))data2 3 * np.random.random((10, 10))Y, X np.mgrid[-3:3:100j, -3:3:100j]U -1 - X**2 YV 1 X - Y**2from matplotlib.cbook import get sample dataimg np.load(get sample data('axes grid/bivariate normal.npy')) import matplotlib.pyplot as pltFigure fig plt.figure() fig2 plt.figure(figsize plt.figaspect(2.0))AxesAll plotting is done with respect to an Axes. In most cases, asubplot will fit your needs. A subplot is an axes on a grid system.3
Python For Data Science Cheat Sheet NumPy Basics Learn Python for Data Science Interactively at www.DataCamp.com NumPy DataCamp Learn Python for Data Science Interactively The NumPy library is the core library for scientific computing in Python. It provides a high-performance multidimensional array object, and tools for working with these arrays. import numpy as np Use the following import .