Transcription
PYTHON II: INTRODUCTION TODATA ANALYSIS WITH PYTHONDartmouth College Research Computing
OVERVIEW What is Python? Why Python for data analysis? Development Environments Hands-on: Basic Data Structures in Python, Looping Defining a function in Python Importing a dataset in to a Python data structure, usingmodules Python scripts and parameters Questions, Resources & Links
RC.DARTMOUTH.EDUSoftwareHardwareConsultingTraining
WHAT IS PYTHON? Python is an open-source programming language It is relatively easy to learn It is a powerful tool with many modules (libraries) that can beimported in to extend its functionality Python can be used to automate tasks and process largeamounts of data Python can be used on Mac’s, PC’s, Linux, as well as in a highperformance computing environment (Polaris, Andes, Discoverymachines here at Dartmouth)
WHY PYTHON FOR DATA ANALYSIS? Python can be used to import datasets quicklyPython’s importable libraries make it an attractive language for data analysis NumPy SciPy Statsmodels Pandas Matplotlib Natural Language Toolkit (NLTK)Python can import and export common data formats such as CSV filesReference: Python for Data Analytics, Wes McKinney, 2012, O’Reilly Publishing
DEVELOPMENT ENVIRONMENTS(I) Python can be run in a variety of environments with various tools From the command line (most Mac’s have Python installed by default)From a windows terminalFrom a Linux terminalUsing an Integrated Development Environment such as Eclipse or PyCharm IDEUsing a web-hosted “sandbox” environment
DEVELOPMENT ENVIRONMENTS (II) Browser-based sandbox
DEVELOPMENT ENVIRONMENTS (III) Mac Terminal
DEVELOPMENT ENVIRONMENTS (IV)Entering Python code:Command line or Optional IDEPython Integrated Development Environment
PYTHON SOFTWARE FOUNDATION ANDMATERIALS FOR THIS TUTORIAL Materials download: www.dartgo.org/pyii Material reference and basis, Python Software Foundation at Python.org:https://docs.python.org/3/tutorial/ Note about Python 2.x and Python 3.x: There are a variety of differences between the versions.Some include:Print “hi world” in 2.x is now print(“hi world”) in 3.x Division with integers can now yield a floating point number In 2.x, 11/2 5, whereas in 3.x, 11/2 5.5More at https://wiki.python.org/moin/Python2orPython3
HANDS ON PRACTICE:GETTING STARTED Preliminary Steps Download data from Dartgo link (www.dartgo.org/pyii)Get the dataset to either:A familiar location on your desktop (e.g.g desktop/python-noviceinflammation/data) Or uploaded in to the sandstorm sandbox web environment Opening Python Open your browser to https://oasis.sandstorm.io/ (Create an account orsign in with existing accountOr, open a terminal on your Mac or PC
HANDS ON PRACTICE:GETTING STARTED Open a web browser Navigate to oasis.sandstorm.io
HANDS ON: DIVING INUsing a Python interpreter or IDE:# this a comment#Using a Python sandbox, interpreter or IDE:Note: after typeA line, click Alt EnterTo run the line and go to next linetextvar 'hello world!'print(textvar)# This creates our first variable. It is a string or text variable.#Next, we’ll define a variable that contains a numerical value:numbervar 5print(numbervar)Materials reference: https://docs.python.org/3/tutorial/
BASIC DATA STRUCTURES IN PYTHON: LISTS# Create a list# A list in Python a basic sequence typesquares [1, 4, 9, 16, 25]print(squares[2])# Basic list functions: retrieve a value, append, insertprint(squares[1])squares.append(35) # add a value to end of listprint(squares)squares[5] 36 # . and then fix our error, 6*6 36!print(squares)
BASIC DATA STRUCTURES IN PYTHON: LISTSWITH CONDITIONALSThis is where the sandbox environment, or an IDE, becomes very useful# a basic conditional structureif 0 0:print(“true”)# used with a list elementif squares[1] es[:] []# clear out the list
LOOPING OVER A BASIC DATA STRUCTURE#Loop over a data structureberries ['raspberry','blueberry','strawberry’]#Loop over a data structureberries ['raspberry','blueberry','strawberry']for i in berries:print("Today's pies: " i)# sort the structure and then loop over itfor i in sorted(berries):print("Today's pies(alphabetical): " i)
BASIC DATA STRUCTURES: TUPLES AND SETSA “Tuple” is a type of sequence that can contain a variety of datatypes# Create a tuplemytuple ('Bill', 'Jackson', 'id', 5)Print(mytuple)# Use indexing to access a tuple element. Note: tuple elementsstart counting at 0, not 1mytuple[3]
BASIC DATA STRUCTURES: DICTIONARIES# Create a Dictionary or look-up table# The leading elements are known as “keys” and thetrailing elements are known as “values”lookuptable {'Dave': 4076, 'Jen': 4327, 'Joanne':4211}lookuptable['Dave']# show the keyslookuptable.keys()lookuptable.values()# check to see if an element exists'Jen' in lookuptable# output: true
BASIC DATA STRUCTURES: DICTIONARIESCreate a Dictionary or look-up tableUse the key for error-checking to see if a value existsleading elements are known as “keys” and the trailing # check to see if anelement existsif 'Jen' in lookuptable:print("Jen's extension is: " str(lookuptable['Jen’]))else:print("No telephone number listed")
DATA STRUCTURES: LOOPING# Loop over a dictionary data structure# print the whole dictionaryfor i,j in lookuptable.iteritems():print i,j
WHILE LOOPS AND LOOP COUNTERS Use a “while” loop to generate a Fibonacci seriesa, b 0, 1i 0fibonacci '1'while i 7:print(b)fibonacci fibonacci ', ' str(b)a bb a bi i 1 # increment the loop counterprint(fibonacci)
IMPORTING AND USING MODULESModules greatly extend the power and functionality of Python,much like libraries in R, JavaScript and other languagesimport sys# check the version of Python that is installedsys.version'3.4.2 (default, Oct 8 2014, 10:45:20) \n[GCC 4.9.1]’ in thissandbox!# check the working directoryimport osos.getcwd()'/var/home’ – this is less applicable in the sandbox – onlaptop or a linux server it is essential to know the workingdirectory
IMPORTING AND USING MODULES# multiply some consecutive numbers1*2*3*4*5*6*75040# save time and labor by using modules effectivelyimport mathmath.factorial(7)
MODULES# Modulesfrom math import piprint(pi)round(pi)round(pi,5)
DEFINING A FUNCTION IN PYTHONFunctions save time by storing repeatable processesDefining a function is easy:use the ‘def’ function in Pythondef xsquared( x ):# find the square of xx2 x * x;# the ‘return’ statement returns the functionvaluereturn x2# call the functiony xsquared(5)print str(y)# Output: 25
WITH AND FOR COMMANDSWe’ll use the WITH and FOR commands to help us read in andloop over the rows in a CSV file; here’s some pseudo-code ofwhat we’d like to do:WITH open (file.extension) as fileobject:{get data in file}FOR rows in file:{do something with data elements in the rows}
UPLOAD DATA To upload data in to the hosted pythoninstance, click the “jupyter” title to goback to upload screen Use the “Files” tab to upload Upload Browse The hosted environment supports theupload of reasonably-sized csv files
DATA ANALYSIS – INFLAMMATIONDATASET Next, let’s examine a dataset of patients (rows) and forty days ofinflammation values (columns)import osos.listdir()# load with numpyimport numpyf open('inflammation-01.csv’)filecontent f.read()numpy.loadtxt(fname 'inflammation-01.csv',delimiter ',') # load csvprint(filecontent)# load in to a variabledata numpy.loadtxt(fname 'inflammation01.csv', delimiter ',') # load csv to pe)print(data.shape)
DATA ANALYSIS – INFLAMMATIONDATASET View data elements with matrix addressingprint('first value in data:', data [0,0])print(data[30,20])maxval numpy.max(data)print('maximum inflammation: ', maxval)stdval numpy.std(data)print( 'standard deviation: ', stdval)
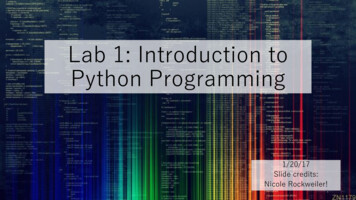
DATA ANALYSIS – INFLAMMATIONDATASET Next, let’s examine a datasetof patients (rows) and fortydays of inflammation valuesimport matplotlib.pyplot%matplotlib inlineimage matplotlib.pyplot.imshow(data)
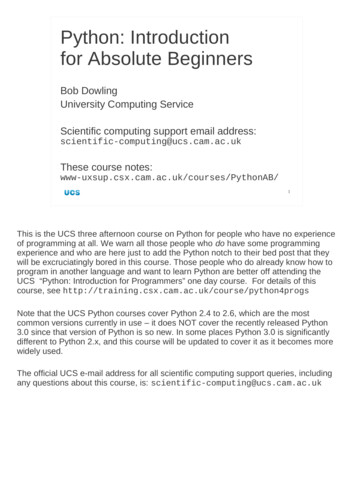
DATA ANALYSIS – INFLAMMATIONDATASET Next, let’s examine a datasetof patients (rows) and fortydays of inflammation valuesave inflammation numpy.mean(data, axis 0)ave plot matplotlib.pyplot.plot(ave inflammation)matplotlib.pyplot.show()
SCRIPTS AND PARAMETERS Use an IDE or friendly ----------# my first script!import sysprint('My first script!')print('Number of arguments:', len(sys.argv), 'arguments.')print('Argument List:', str(sys.argv))#--------------------------------
READING MULTIPLE FILES Programming for speed, reusability Data analysis over many filesstrfiles ['inflammation-01.csv','inflammation-02.csv’]for f in strfiles:print(f)#data numpy.loadtxt(fname f, delimiter ',’)#print('mean ',f, numpy.mean(data, axis 0))Got lots of files?This is where RC systems like Polaris orDiscovery can be very useful
WRITE TO CSV!import csvwith open('names.csv', 'w', newline '') as csvfile:fieldnames ['first name', 'last name']writer csv.DictWriter(csvfile, fieldnames irst name': 'Baked', 'last name': 'Beans'})writer.writerow({'first name': 'Lovely', 'last name': 'Spam'})writer.writerow({'first name': 'Wonderful', 'last name': 'Spam'})
CSV HEADER ROW AND FIRST DATAROW Read first rows:with open('inflammation-01.csv') as f:reader2 csv.reader(f)row1 next(reader2) # gets the first linerow2 next(reader2)print ("CSV column headers:" str(row1))print ("CSV first line: " str(row2))
SCRIPTS AND PARAMETERS Use an IDE or friendly ----------# program name: python add parameters.pyimport sysi 0total 0while i len(sys.argv):total total int(sys.argv[1])i i 1print('sum: ' str(total))print('Number of arguments:',len(sys.argv), 'arguments.')print('Argument List:', str(sys.argv))#--------------------------------
CSV LIBRARY Csv library built-in to Pythonimport csvwith open('inflammation-01.csv') as f:reader2 csv.reader(f)row1 next(reader2)print(str(row1)) Output: ['0', '0', '1', '3', '1', '2', '4', '7', '8', '3', '3', ‘3’ .
IMPORTING A DATASET IN TO PYTHON:USING THE OS AND CSV MODULESFind out where you are in the directory structure, import the operating system library (OS)# Reference: https://docs.python.org/2/library/csv.html section 13.1import oscwd os.getcwd()print "Working Directory is: " cwdOs.chdir(‘c:\\temp’)Os.getcwd()Import the CSV file in to a reader function# Download the CSV and copy it to the working directory# Note: the CSV module’s reader and writer objects read and write sequenceswith open('HawaiiEmergencyShelters.csv') as csvfile:reader csv.DictReader(csvfile)for row in reader:print(row['NAME'], row['ADDRESS'])
STATISTICS FROM CSV COLUMNS# Loop through column, find averagewith open('HawaiiEmergencyShelters.csv') as csvfile:reader csv.DictReader(csvfile)x sum 0x length 0for row in reader:try:x row['NUMCOTS']x sum int(x)x length 1except ValueError:print("Error converting: {0:s}".format(x))x average x sum / x lengthprint ('Average: ')print(x average)
NUMERICAL FUNCTIONS# Float and Intx 3.453xint int(x)yfloat float(2)Xround round(x)
INSTALLING NUMPY FOR PYTHON 2.7“Numpy” is a helper module in Python for numerical processingTo get the NUMPY installerMac /downloadPc - /1.8.0/Click on the dmg file. You may need to change Mac securitypreference (Sys Pref Security ) to allow the DMG installer torun
STATISTICAL OPERATIONSNUMPY FOR PYTHON 2.7# d.var.corrcoef (Pearson product-moment correlation).correlate.cov (estimate of covariance matrix).histogram.amin.amax.percentile
SAVING PYTHON SCRIPTS Python files can be writtenin a simple text editor, orusing an IDE editor. The file extension is .py
A MODULE FOR BASIC STATISTICAL ANALYSIS:USING THE NUMPY LIBRARY# importing the library# running basic functions import numpy numpy.mean(3,6,9)6.0 numpy.std([2,4,6,8])2.2360679774997898# Reference: ed/numpy.mean.html ines.statistics.html
THE OS MODULE: SOME USEFUL OSCOMMANDS More OS library tasks: os.path.realpath(path) canonical path os.path.dirname(path) directory os.getcwd() get working directory (as string) os.chdir(path) change the working directory
PYTHON ON DARTMOUTH RESEARCHCOMPUTING MACHINES Research Computing shared Linux resources include Polaris and Andes, aswell as the high-performance computing platform Discovery. These machines have several versions of Python installed, and commonlyused modules. Additional modules can be installed upon request Polaris currently has Python 2.6.6 as the default, and Numpy and Scipylibraries are installed. Andes currently has Python 2.7.5 as the default, with Numpy, Scipy and thePandas modules installed. Pandas is another commonly used data analysislibrary.
PYTHON SOFTWARE FOUNDATION ANDMATERIALS FOR THIS TUTORIAL Materials download: www.dartgo.org/workshopsg and downloadIntroDataAnalysisPython Material reference and basis, Python Software Foundation at Python.org:https://docs.python.org/2/tutorial/
RESOURCES & LINKS Research Computing Research.computing@dartmouth.edu http://rc.dartmouth.edu Python Foundation Online tutorials Web forums Stack /python
LEARNING MORE Python TutorialsPython 2.7.13 https://docs.python.org/2/tutorial/ Python 3.6 https://docs.python.org/3.6/tutorial/ Numpy, Scipy /quickstart.html http://cs231n.github.io/python-numpy-tutorial/ Python CSV library tutorial https://docs.python.org/2/library/csv.htmlLynda, Youtube Online tutorials Lynda, log in with Dartmouth credentials:www.lynda.com/portal/dartmouth Search for Python Programming, Numpy, Scipy
QUESTIONS?
Apr 12, 2018 · Python is an open-source programming language It is relatively easy to learn It is a powerful tool with many modules (libraries) that can be imported in to extend its functionality Python can be used to automate tasks and process large amounts of data Python can be used on Mac’s, PC’s, Linux, as well as in a high- performance computing environment (Polaris,