Transcription
Pandas forEveryone
The Pearson Addison-WesleyData and Analytics SeriesVisit informit.com/awdataseries for a complete list of available publications.T h e Pearson Addison-Wesley Data and Analytics Series provides readers withpractical knowledge for solving problems and answering questions with data.Titles in this series primarily focus on three areas:1. Infrastructure: how to store, move, and manage data2. Algorithms: how to mine intelligence or make predictions based on data3. V isualizations: how to represent data and insights in a meaningful andcompelling wayThe series aims to tie all three of these areas together to help the reader buildend-to-end systems for fighting spam; making recommendations; buildingpersonalization; detecting trends, patterns, or problems; and gaining insightfrom the data exhaust of systems and user interactions.Make sure to connect with us!informit.com/socialconnect
Pandas forEveryonePython Data AnalysisDaniel Y. ChenBoston Columbus Indianapolis New York San Francisco Amsterdam Cape TownDubai London Madrid Milan Munich Paris Montreal Toronto Delhi Mexico CitySão Paulo Sydney Hong Kong Seoul Singapore Taipei Tokyo
Many of the designations used by manufacturers and sellers to distinguish theirproducts are claimed as trademarks. Where those designations appear in this book,and the publisher was aware of a trademark claim, the designations have been printedwith initial capital letters or in all capitals.The author and publisher have taken care in the preparation of this book, but makeno expressed or implied warranty of any kind and assume no responsibility for errorsor omissions. No liability is assumed for incidental or consequential damages inconnection with or arising out of the use of the information or programs containedherein.For information about buying this title in bulk quantities, or for special salesopportunities (which may include electronic versions; custom cover designs; andcontent particular to your business, training goals, marketing focus, or brandinginterests), please contact our corporate sales department at corpsales@pearsoned.comor (800) 382-3419.For government sales inquiries, please contact governmentsales@pearsoned.com.For questions about sales outside the U.S., please contact intlcs@pearson.com.Visit us on the Web: informit.com/awLibrary of Congress Control Number: 2017956175Copyright 2018 Pearson Education, Inc.All rights reserved. Printed in the United States of America. This publication isprotected by copyright, and permission must be obtained from the publisher prior toany prohibited reproduction, storage in a retrieval system, or transmission in anyform or by any means, electronic, mechanical, photocopying, recording, or likewise.For information regarding permissions, request forms and the appropriate contactswithin the Pearson Education Global Rights & Permissions Department, please visitwww.pearsoned.com/permissions/.ISBN-13: 978-0-13-454693-3ISBN-10: 0-13-454693-81 17
To my family: Mom, Dad, Eric, and Julia
This page intentionally left blank
ContentsForewordPrefacexixxxiAcknowledgments xxviiAbout the Author xxxiIIntroduction11Pandas DataFrame Basics31.1Introduction31.2Loading Your First Data Set41.3Looking at Columns, Rows,and Cells71.3.1Subsetting Columns71.3.2Subsetting Rows81.3.3Mixing It Up 121.4Grouped and AggregatedCalculations 181.4.1Grouped Means 191.4.2Grouped FrequencyCounts 231.5Basic Plot 231.6Conclusion 242Pandas Data Structures 252.1Introduction 252.2Creating Your Own Data 262.2.1Creating a Series 262.2.2Creating a DataFrame 272.3The Series 282.3.1The Series Isndarray-like 302.3.2Boolean Subsetting:Series 302.3.3Operations AreAutomaticallyAligned and Vectorized(Broadcasting) 33
viiiContents2.42.52.62.73The DataFrame 362.4.1Boolean Subsetting:DataFrames 362.4.2Operations Are AutomaticallyAligned and Vectorized(Broadcasting) 37Making Changes to Series andDataFrames 382.5.1Add Additional Columns 382.5.2Directly Change a Column 392.5.3Dropping Values 43Exporting and Importing Data 432.6.1pickle 432.6.2CSV 452.6.3Excel 462.6.4Feather Format to InterfaceWith R 472.6.5Other Data Output Types 47Conclusion 47Introduction to Plotting 493.1Introduction 493.2Matplotlib 513.3Statistical Graphics Usingmatplotlib 563.3.1Univariate 573.3.2Bivariate 583.3.3Multivariate Data 593.4Seaborn 613.4.1Univariate 623.4.2Bivariate Data 653.4.3Multivariate Data 733.5Pandas Objects 833.5.1Histograms 843.5.2Density Plot 853.5.3Scatterplot 853.5.4Hexbin Plot 863.5.5Boxplot 863.6Seaborn Themes and Styles 863.7Conclusion 90
ContentsIIData Manipulation914Data Assembly 934.1Introduction 934.2Tidy Data 934.2.1Combining Data Sets 944.3Concatenation 944.3.1Adding Rows 944.3.2Adding Columns 984.3.3Concatenation WithDifferent Indices 994.4Merging Multiple Data Sets 1024.4.1One-to-One Merge 1044.4.2Many-to-One Merge 1054.4.3Many-to-ManyMerge 1054.5Conclusion 1075Missing Data 1095.1Introduction 1095.2What Is a NaN Value? 1095.3Where Do Missing ValuesCome From? 1115.3.1Load Data 1115.3.2Merged Data 1125.3.3User Input Values 1145.3.4Re-indexing 1145.4Working With Missing Data 1165.4.1Find and Count missingData 1165.4.2Cleaning Missing Data 1185.4.3Calculations With MissingData 1205.5Conclusion 1216Tidy Data 1236.1Introduction 1236.2Columns Contain Values,Not Variables 124ix
xContents6.2.16.36.46.56.66.7IIIKeep One ColumnFixed 1246.2.2Keep Multiple ColumnsFixed 126Columns Contain Multiple Variables 1286.3.1Split and Add ColumnsIndividually(Simple Method) 1296.3.2Split and Combine in a SingleStep (Simple Method) 1316.3.3Split and Combine in a SingleStep (More ComplicatedMethod) 132Variables in Both Rows andColumns 133Multiple Observational Units in a Table(Normalization) 134Observational Units Across MultipleTables 1376.6.1Load Multiple Files Usinga Loop 1396.6.2Load Multiple Files Using a ListComprehension 140Conclusion 141Data Munging 1437Data Types 1457.1Introduction 1457.2Data Types 1457.3Converting Types 1467.3.1Converting to StringObjects 1467.3.2Converting to NumericValues 1477.4Categorical Data 1527.4.1Convert to Category 1527.4.2Manipulating CategoricalData 1537.5Conclusion 153
Contents8Strings and Text Data 1558.1Introduction 1558.2Strings 1558.2.1Subsetting and SlicingStrings 1558.2.2Getting the Last Character ina String 1578.3String Methods 1588.4More String Methods 1608.4.1Join 1608.4.2Splitlines 1608.5String Formatting 1618.5.1Custom StringFormatting 1618.5.2Formatting CharacterStrings 1628.5.3Formatting Numbers 1628.5.4C printf StyleFormatting 1638.5.5Formatted Literal Strings inPython 3.6 1638.6Regular Expressions (RegEx) 1648.6.1Match a Pattern 1648.6.2Find a Pattern 1688.6.3Substituting a Pattern 1688.6.4Compiling a Pattern 1698.7The regex Library 1708.8Conclusion 1709Apply 1719.1Introduction 1719.2Functions 1719.3Apply (Basics) 1729.3.1Apply Over a Series 1739.3.2Apply Over aDataFrame 1749.4Apply (More Advanced) 1779.4.1Column-wiseOperations 1789.4.2Row-wise Operations 180xi
xiiContents9.59.69.7Vectorized Functions 1829.5.1Using numpy 1849.5.2Using numba 185Lambda Functions 185Conclusion 18710 Groupby Operations: Split–Apply–Combine 18910.1 Introduction 18910.2 Aggregate 19010.2.1 Basic One-Variable GroupedAggregation 19010.2.2 Built-in AggregationMethods 19110.2.3 Aggregation Functions 19210.2.4 Multiple FunctionsSimultaneously 19510.2.5 Using a dict inagg/aggregate 19510.3 Transform 19710.3.1 z-Score Example 19710.4 Filter 20110.5 The pandas.core.groupby.DataFrameGroupBy Object 20210.5.1 Groups 20210.5.2 Group Calculations InvolvingMultiple Variables 20310.5.3 Selecting a Group 20410.5.4 Iterating ThroughGroups 20410.5.5 Multiple Groups 20610.5.6 Flattening the Results 20610.6 Working With a MultiIndex 20710.7 Conclusion 21111 The datetime Data Type 21311.1 Introduction 21311.2 Python’s datetime Object 21311.3 Converting to datetime 21411.4 Loading Data That Include Dates 21711.5 Extracting Date Components 217
VDate Calculations andTimedeltas 220Datetime Methods 221Getting Stock Data 224Subsetting Data Based on Dates 22511.9.1 The DatetimeIndexObject 22511.9.2 The TimedeltaIndexObject 226Date Ranges 22711.10.1 Frequencies 22811.10.2 Offsets 229Shifting Values 230Resampling 237Time Zones 238Conclusion 240Data Modeling 24112 Linear Models 24312.1 Introduction 24312.2 Simple Linear Regression 24312.2.1 Using statsmodels 24312.2.2 Using sklearn 24512.3 Multiple Regression 24712.3.1 Using statsmodels 24712.3.2 Using statsmodels WithCategorical Variables 24812.3.3 Using sklearn 24912.3.4 Using sklearn WithCategorical Variables 25012.4 Keeping Index Labels Fromsklearn 25112.5 Conclusion 25213 Generalized Linear Models 25313.1 Introduction 25313.2 Logistic Regression 25313.2.1 Using Statsmodels 25513.2.2 Using Sklearn 256xiii
xivContents13.313.413.513.6Poisson Regression 25713.3.1 Using Statsmodels 25813.3.2 Negative Binomial Regressionfor Overdispersion 259More Generalized Linear Models 260Survival Analysis 26013.5.1 Testing the Cox ModelAssumptions 263Conclusion 26414 Model Diagnostics 26514.1 Introduction 26514.2 Residuals 26514.2.1 Q-Q Plots 26814.3 Comparing Multiple Models 27014.3.1 Working With LinearModels 27014.3.2 Working With GLM Models 27314.4 k-Fold Cross-Validation 27514.5 Conclusion 27815 Regularization 27915.1 Introduction 27915.2 Why Regularize? 27915.3 LASSO Regression 28115.4 Ridge Regression 28315.5 Elastic Net 28515.6 Cross-Validation 28715.7 Conclusion 28916 Clustering 29116.1 Introduction 29116.2 k-Means 29116.2.1 Dimension ReductionWith PCA 29416.3 Hierarchical Clustering 29716.3.1 Complete Clustering 29816.3.2 Single Clustering 29816.3.3 Average Clustering 299
Contents16.3.416.3.516.4VCentroid Clustering 299Manually Setting theThreshold 299Conclusion 301Conclusion 30317 Life Outside of Pandas 30517.1 The (Scientific) Computing Stack 30517.2 Performance 30617.2.1 Timing Your Code 30617.2.2 Profiling Your Code 30717.3 Going Bigger and Faster 30718 Toward a Self-Directed Learner 30918.1 It’s Dangerous to Go Alone! 30918.2 Local Meetups 30918.3 Conferences 30918.4 The Internet 31018.5 Podcasts 31018.6 Conclusion 311VIAppendixes 313A Installation 315A.1Installing Anaconda 315A.1.1Windows 315A.1.2Mac 316A.1.3Linux 316A.2Uninstall Anaconda 316B Command Line 317B.1Installation 317B.1.1Windows 317B.1.2Mac 317B.1.3Linux 318B.2Basics 318xv
xviContentsC Project Templates 319D Using Python 321D.1Command Line and Text Editor 321D.2Python and IPython 322D.3Jupyter 322D.4Integrated Development Environments(IDEs) 322EWorking Directories 325FEnvironments 327G Install Packages 329G.1Updating Packages 330H Importing Libraries 331ILists 333JTuples 335K Dictionaries 337LSlicing Values 339M Loops 341N Comprehensions 343O Functions 345O.1Default Parameters 347O.2Arbitrary Parameters 347O.2.1*args 347O.2.2**kwargs 348P Ranges and Generators 349
ContentsQ Multiple Assignment 351R numpy ndarray 353S Classes 355TOdo: The Shapeshifter 357Index 359xvii
This page intentionally left blank
ForewordWith each passing year data becomes more important to the world, as does the ability tocompute on this growing abundance of data. When deciding how to interact with data,most people make a decision between R and Python. This does not reflect a language warbut rather a luxury of choice where data scientists and engineers can work in the languagewith which they feel most comfortable. These tools make it possible for everyone to workwith data for machine learning and statistical analysis. That is why I am happy to see whatI started with R for Everyone extended to Python with Pandas for Everyone.I first met Dan Chen when he stumbled into the “Introduction to Data Science”course while working toward a master’s in public health at Columbia University’s MailmanSchool of Public Health. He was part of a cohort of MPH students who cross-registeredinto the graduate school course and quickly developed a knack for data science, embracingstatistical learning and reproducibility. By the end of the semester he was devoted to, andevangelizing, the merits of data science.This coincided with the rise of Pandas, improving Python’s use as a tool for data scienceand enabling engineers already familiar with the language to use it for data science as well.This fortuitous timing meant Dan developed into a true multilingual data scientist,mastering both R and Pandas. This puts him in a great position to reach differentaudiences, as shown by his frequent and popular talks at both R and Python conferencesand meetups. His enthusiasm and knowledge shine through and resonate in everything hedoes, from educating new users to building Python libraries. Along the way he fullyembraces the ethos of the open-source movement.As the name implies, this book is meant for everyone who wants to use Python for datascience, whether they are veteran Python users, experienced programmers, statisticians, orentirely new to the field. For people brand new to Python the book contains a collectionof appendixes for getting started with the language and for installing both Python andPandas, and it covers the whole analysis pipeline, including reading data, visualization, datamanipulation, modeling, and machine learning.Pandas for Everyone is a tour of data science through the lens of Python, and Dan Chenis perfectly suited to guide that tour. His mixture of academic and industry experiencelends valuable insights into the analytics process and how Pandas should be used to greatesteffect. All this combines to make for an enjoyable and informative read for everyone.–Jared Lander, series editor
This page intentionally left blank
PrefaceIn 2013, I didn’t even know the term “data science” existed. I was a master’s of publichealth (MPH) student in epidemiology at the time and was already captivated with thestatistical methods beyond the t-test, ANOVA, and linear regression from my psychologyand neuroscience undergraduate background. It was also in the fall of 2013 that I attendedmy first Software-Carpentry workshop and that I taught my first recitation section as ateaching assistant for my MPH program’s Quantitative Methods course (essentially acombination of a first-semester epidemiology and biostatistics course). I’ve been learningand teaching ever since.I’ve come a long way since taking my first Introduction to Data Science course, whichwas taught by Rachel Schutt, PhD; Kayur Patel, PhD; and Jared Lander. They opened myeyes to what was possible. Things that were inconceivable (to me) were actually commonpractices, and anything I could think of was possible (although I now know that “possible”doesn’t mean “performs well”). The technical details of data science—the codingaspects—were taught by Jared in R. Jared’s friends and colleagues know how much of anaficionado he is of the R language.At the time, I had been meaning to learn R, but the Python/R language war neverbreached my consciousness. On the one hand, I saw Python as just a programminglanguage; on the other hand, I had no idea Python had an analytics stack (I’ve come a longway since then). When I learned about the SciPy stack and Pandas, I saw it as a bridgebetween what I knew how to do in Python from my undergraduate and high school daysand what I had learned in my epidemiology studies and through my newly acquired datascience knowledge. As I became more proficient in R, I saw the similarities to Python. Ialso realized that a lot of the data cleaning tasks (and programming in general) involvethinking about how to get what you need—the rest is more or less syntax. It’s importantto try to imagine what the steps are and not get bogged down by the programming details.I’ve always been comfortable bouncing around the languages and never gave too muchthought to which language was “better.” Having said that, this book is geared toward anewcomer to the Python data analytics world.This book encapsulates all the people I’ve met, events I’ve attended, and skills I’velearned over the past few years. One of the more important things I’ve learned (outside ofknowing what things are called so Google can take me to the relevant StackOverflowpage) is that reading the documentation is essential. As someone who has worked oncollaborative lessons and written Python and R libraries, I can assure you that a lot of timeand effort go into writing documentation. That’s why I constantly refer to the relevantdocumentation page throughout this book. Some functions have so many parameters usedfor varying use cases that it’s impractical to go through each of them. If that were the focusof this book, it might as well be titled Loading Data Into Python. But, as you practiceworking with data and become more comfortable with the various data structures, you’lleventually be able to make “educated guesses” about what the output of something will
xxiiPrefacebe, even though you’ve never written that particular line of code before. I hope this bookgives you a solid foundation to explore on your own and be a self-guided learner.I met a lot of people and learned a lot from them during the time I was putting thisbook together. A lot of the things I learned dealt with best practices, writing vectorizedstatements instead of loops, formally testing code, organizing project folder structures, andso on. I also learned lot about teaching from actually teaching. Teaching really is the bestway to learn material. Many of the things I’ve learned in the past few years have come tome when I was trying to figure them out to teach others. Once you have a basicfoundation of knowledge, learning the next bit of information is relatively easy. Repeat theprocess enough times, and you’ll be surprised how much you actually know. That includesknowing the terms to use for Google and interpreting the StackOverflow answers. Thevery best of us all search for our questions. Whether this is your first language or yourfourth, I hope this book gives you a solid foundation to build upon and learn as well as abridge to other analytics languages.Breakdown of the BookThis book is organized into five parts plus a set of appendixes.Part IPart I aims to be an introduction to Pandas using a realistic data set.Chapter 1: Starts by using Pandas to load a data set and begin looking at variousrows and columns of the data. Here you will get a general sense of the syntax ofPython and Pandas. The chapter ends with a series of motivating examples thatillustrate what Pandas can do.Chapter 2: Dives deeper into what the Pandas DataFrame and Series objects are.This chapter also covers boolean subsetting, dropping values, and different ways toimport and export data.Chapter 3: Covers plotting methods using matplotlib, seaborn, and Pandas tocreate plots for exploratory data analysis.Part IIPart II focuses on what happens after you load data and need to combine data together. Italso introduces “tidy data”—a series of data manipulations aimed at “cleaning” data.Chapter 4: Focuses on combining data sets, either by concatenating them togetheror by merging disparate data.Chapter 5: Covers what happens when there is missing data, how data are created tofill in missing data, and how to work with missing data, especially what happenswhen certain calculations are performed on them.Chapter 6: Discusses Hadley Wickham’s “Tidy Data” paper, which deals withreshaping and cleaning common data problems.Part IIIPart III covers the topics needed to clean and munge data.
Preface.Chapter 7: Deals with data types and how to convert from different types withinDataFrame columns.Chapter 8: Introduces string manipulation, which is frequently needed as part of thedata cleaning task because data are often encoded as text.Chapter 9: Focuses on applying functions over data, an important skill thatencompasses many programming topics. Understanding how apply works will pavethe way for more parallel and distributed coding when your data manipulations needto scale.Chapter 10: Describes groupby operations. These powerful concepts, like apply, areoften needed to scale data. They are also great ways to efficiently aggregate,transform, or filter your data.Chapter 11: Explores Pandas’s powerful date and time capabilities.Part IVWith the data all cleaned and ready, the next step is to fit some models. Models can beused for exploratory purposes, not just for prediction, clustering, and inference. The goalof Part IV is not to teach statistics (there are plenty of books in that realm), but rather toshow you how these models are fit and how they interface with Pandas. Part IV can beused as a bridge to fitting models in other languages.Chapter 12: Linear models are the simpler models to fit. This chapter covers fittingthese models using the statsmodels and sklean libraries.Chapter 13: Generalized linear models, as the name suggests, are linear modelsspecified in a more general sense. They allow us to fit models with different responsevariables, such as binary data or count data. This chapter also covers survival models.Chapter 14: Since we have a core set of models that we can fit, the next step is toperform some model diagnostics to compare multiple models and pick the “best”one.Chapter 15: Regularization is a technique used when the models we are fitting aretoo complex or overfit our data.Chapter 16: Clustering is a technique we use when we don’t know the actual answerwithin our data, but we need a method to cluster or group “similar” data pointstogether.Part VThe book concludes with a few points about the larger Python ecosystem, and additionalreferences.Chapter 17: Quickly summarizes the computation stack in Python, and starts downthe path to code performance and scaling.Chapter 18: Provides some links and references on learning beyond the book.AppendixesThe appendixes can be thought as a primer to Python programming. While they are not acomplete introduction to Python, the various appendixes do supplement some of thetopics throughout the book.xxiii
xxivPreface.Appendixes A–G: These appendixes cover all the tasks related to running Pythoncode—from installing Python, to using the command line to execute your scripts,and to organizing your code. They also cover creating Python environments andinstalling libraries.Appendixes H–T: The appendixes cover general programming concepts that arerelevant to Python and Pandas. They are supplemental references to the main part ofthe book.How to Read This BookWhether you are a newcomer to Python or a fluent Python programmer, this book ismeant to be read from the beginning. Educators, or people who plan to use the book forteaching, may also find the order of the chapters to be suitable for a workshop or class.NewcomersAbsolute newcomers are encouraged to first look through Appendixes A–F, as they explainhow to install Python and get it working. After taking these steps, readers will be ready tojump into the main body of the book. The earlier chapters make references to the relevantappendixes as needed. The concept map and objectives found at the beginning of theearlier chapters help organize and prepare the reader for what will be covered in thechapter, as well as point to the relevant appendixes to be read before continuing.Fluent Python ProgrammersFluent Python programmers may find the first two chapters to be sufficient to get startedand grasp the syntax of Pandas; they can then use the rest of the book as a reference. Theobjectives at the beginning of the earlier chapters point out which topics are covered in thechapter. The chapter on “tidy data” in Part II, and the chapters in Part III, will beparticularly helpful in data manipulation.InstructorsInstructors who want to use the book as a teaching reference may teach each chapter inthe order presented. It should take approximately 45 minutes to 1 hour to teacheach chapter. I have sought to structure the book so that chapters do not reference futurechapters, so as to minimize the cognitive overload for students—but feel free to shufflethe chapters as needed.SetupEveryone will have a different setup, so the best way to get the most updated set ofinstructions on setting up an environment to code through the book would be on theaccompanying GitHub repository:https://github.com/chendaniely/pandas for everyoneOtherwise, see Appendix A for information on how to install Python on your computer.
PrefaceGetting the DataThe easiest way to get all the data to code along the book is to download the repositoryusing the following URL:https://github.com/chendaniely/pandas for everyone/archive/master.zipThis will download everything in the repository, as well as provide a folder in which youcan put your Python scripts or notebooks. You can also copy the data folder from therepository and put it in a folder of your choosing. The instructions on the GitHubrepository will be updated as necessary to facilitate downloading the data for the book.Setting up PythonAppendixes F and G cover environments and installing packages, respectively. Followingare the commands used to build the book and should be sufficient to help you get started. conda create -n book python 3.6 source activate book conda install pandas xlwt openpyxl feather -format seaborn numpy \ipython jupyter statsmodels scikit-learnregex \wget odo numba conda install -c conda-forge pweave pip install lifelines pip install pandas-datareaderFeedback, Please!Thank you for taking the time to go through this book. If you find any problems, issues,or mistakes within the book, please send me feedback! GitHub issues may be the best placeto provide this information, but you can also email me at chendaniely@gmail.com. Just besure to use the [PFE] tag in the beginning of the subject line so I can make sure your emailsdo not get flooded by various listserv emails. If there are topics that you feel should becovered in the book, please let me know. I will try my best to put up a notebook in theGitHub repository, and to get it incorporated in a later printing or edition of the book.Words of encouragement are appreciated.Register your copy of Pandas for Everyone on the InformIT site for convenient accessto updates and/or corrections as they become available. To start the registrationprocess, go to informit.com/register and log in or create an account. Enter theproduct ISBN (9780134546933) and click Submit. Look on the Registered Productstab for an Access Bonus Content link next to this product, and follow that link toaccess any available bonus materials. If you would like to be notified of exclusive offerson new editions and updates, please check the box to receive email from us.xxv
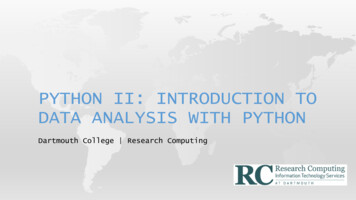
AcknowledgmentsIntroduction to Data Science: The three people who paved the way for this book weremy instructors in the “Introduction to Data Science” course at Columbia—Rachel Schutt,Kayur Patel, and Jared Lander. Without them, I wouldn’t even know what the term “datascience” means. I learned so much about the field through their lectures and labs;everything I know and do today can be traced back to this class. The instructors were onlypart of the learning process. The people in my study group, where we fumbled throughour homework assignments and applied our skills to the final project of summarizingscientific articles, made learning the material and passing the class possible. They wereNiels Bantilan, Thomas Vo, Vivian Peng, and Sabrina Cheng (depicted in the figure here).Perhaps unsurprisingly, they also got me through my master’s program (more on that later).One of the midnight doodles by Vivian Peng forour project group. We have Niels, our projectleader, at the top; Thomas, me, and Sabrina in themiddle row; and Vivian at the bottom.Software-Carpentry: As part of the “Introduction to Data Science” course, I attended aSoftware-Carpentry workshop, where I was first introduced to Pandas. My first instructorswere Justin Ely and David Warde-Farley. Since then I’ve been involved in the community,thanks to Greg Wilson, and still remember the first class I helped teach, led by AronAhmadia and Randal S. Olson. The many workshops that I’ve taught since then, and thefellow instructors whom I’ve met, gave me the opportunity to master the knowledge andskills I know and practice today, and to disseminate them to new learners, which hascumulated into this book.Software-Carpentry also introduced me to the NumFOCUS, PyData, and theScientific Python communities, where all my (Python) heroes can be found. There are toomany to list here. My connection to the R world is all thanks to Jared Lander.Columbia University Mailman School of Public Health: My undergraduate studygroup evolved into a set of lifelong friends during my master’s program. The members of
xxviiiAcknowledgmentsthis group got me through the first semester of the program in which epidemiology andbiostatistics were first taught. The knowledge I learned in this program later transferredinto my knowledge of machine learning. Thanks go to Karen Lin, Sally Cheung, GraceLee, Wai Yee (Krystal) Khine, Ashley Harper, and Jacquie Cheung. A second set of thanksto go to my old study group alumni: Niels Bantilan, Thomas Vo, and Sabrina Cheng.To my instructors, Katherine Keyes and Martina Pavlicova, thanks for being exemplaryteachers in epidemiology, and biostatistics, respectively. Thanks also to Dana MarchPalmer, for whom I was a TA and who gave me my first teaching experience. Mark Orrserved as my thesis advisor while I was at Mailman. The department of epidemiology had asubset of faculty who did computational and simulation modeling, under the leadership ofSandro Galea, the department chair at the time. After graduation, I got my first job as adata analyst with Jacqueline Merrill at the Columbia University School of Nursing.Getting to Mailman was a life-altering event. I never would have considered enteringan MPH program if it weren’t for Ting Ting Guo. As an advisor, Charlotte Glasser was atrem
The Pearson Addison-Wesley Data and Analytics Series provides readers with practical knowledge for solving problems and answering questions with data. Titles in this series primarily focus on three areas: 1. Infrastructure: how to store, move, and manage data 2. Algorithms: how to mine intellige