Transcription
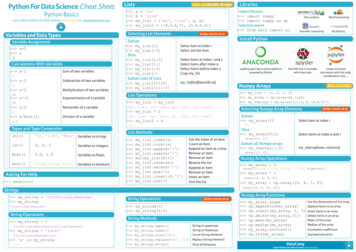
Python For Data Science Cheat SheetPython BasicsLearn More Python for Data Science Interactively at www.datacamp.comLists Also see NumPy Arraysa 'is'b 'nice'my list ['my', 'list', a, b]my list2 [[4,5,6,7], [3,4,5,6]]Selecting List ElementsVariables and Data TypesSubsetVariable Assignment x 5 x5 my list[1] my list[-3]Select item at index 1Select 3rd last item Select items at index 1 and 2Select items after index 0Select items before index 3Copy my listSliceCalculations With Variables x 2Sum of two variables x-2Subtraction of two variables x*2Multiplication of two variables x**2Exponentiation of a variable x%2Remainder of a variable x/float(2)Division of a variable7310251Index starts at 02.5my list[1:3]my list[1:]my list[:3]my list[:]Subset Lists of Lists my list2[1][0] my list2[1][:2]my list[list][itemOfList]str()'5', '3.45', 'True'Variables to stringsint()5, 3, 1Variables to integers my list my list['my', 'list', 'is', 'nice', 'my', 'list', 'is', 'nice'] my list * 2['my', 'list', 'is', 'nice', 'my', 'list', 'is', 'nice'] my list2 4float()5.0, 1.0Variables to floatsbool()True, True, TrueVariables to booleansAsking For Help help(str)my list.index(a)my list.count(a)my list.append('!')my list.remove('!')del(my list[0:1])my list.reverse()my list.extend('!')my list.pop(-1)my list.insert(0,'!')my list.sort()'thisStringIsAwesome'String Operations my string * 2'thisStringIsAwesomethisStringIsAwesome' my string 'Innit''thisStringIsAwesomeInnit' 'm' in my stringTrueMachine learningScientific computing2D plottingFree IDE that is includedwith AnacondaLeading open data science platformpowered by PythonCreate and sharedocuments with live code,visualizations, text, .Numpy ArraysAlso see ListsSelecting Numpy Array ElementsSubset my array[1]Get the index of an itemCount an itemAppend an item at a timeRemove an itemRemove an itemReverse the listAppend an itemRemove an itemInsert an itemSort the listIndex starts at 0Select item at index 1Slice my array[0:2]Select items at index 0 and 1array([1, 2])Subset 2D Numpy arrays my 2darray[:,0]my 2darray[rows, columns]array([1, 4])Numpy Array Operations my array 3array([False, False, False, my array * 2True], dtype bool)array([2, 4, 6, 8]) my array np.array([5, 6, 7, 8])array([6, 8, 10, 12])Strings my string 'thisStringIsAwesome' my stringData analysisInstall Python2List Methods Import libraries import numpy import numpy as npSelective import from math import pi my list [1, 2, 3, 4] my array np.array(my list) my 2darray np.array([[1,2,3],[4,5,6]])List OperationsTrueTypes and Type ConversionLibrariesString OperationsIndex starts at 0 my string[3] my string[4:9]String Methods String to uppercasemy string.upper()String to lowercasemy string.lower()Count String elementsmy string.count('w')my string.replace('e', 'i') Replace String elementsmy string.strip()Strip whitespacesNumpy Array Functions my array.shapenp.append(other array)np.insert(my array, 1, 5)np.delete(my array,[1])np.mean(my array)np.median(my array)my array.corrcoef()np.std(my array)DataCampGet the dimensions of the arrayAppend items to an arrayInsert items in an arrayDelete items in an arrayMean of the arrayMedian of the arrayCorrelation coefficientStandard deviationLearn Python for Data Science Interactively
Python For Data Science Cheat SheetJupyter NotebookWorking with Different Programming LanguagesWidgetsKernels provide computation and communication with front-end interfaceslike the notebooks. There are three main kernels:Notebook widgets provide the ability to visualize and control changesin your data, often as a control like a slider, textbox, etc.Learn More Python for Data Science Interactively at www.DataCamp.comIRkernelInstalling Jupyter Notebook will automatically install the IPython kernel.Saving/Loading NotebooksSave current notebookand record checkpointPreview of the printednotebookClose notebook & stoprunning any scriptsOpen an existingnotebookRename notebookRevert notebook to aprevious checkpointYou can use them to build interactive GUIs for your notebooks or tosynchronize stateful and stateless information between Python andJavaScript.Interrupt kernelRestart kernelCreate new notebookMake a copy of thecurrent notebookIJuliaInterrupt kernel &clear all outputRestart kernel & runall cellsConnect back to aremote notebookRestart kernel & runall cellsDownload serializedstate of all widgetmodels in useSave notebookwith interactivewidgetsEmbed currentwidgetsRun other installedkernelsCommand Mode:Download notebook as- IPython notebook- Python- HTML- Markdown- reST- LaTeX- PDF151312345678910111412Writing Code And TextCode and text are encapsulated by 3 basic cell types: markdown cells, codecells, and raw NBConvert cells.Edit CellsCut currently selected cellsto clipboardPaste cells fromclipboard abovecurrent cellPaste cells fromclipboard on topof current celRevert “Delete Cells”invocationCopy cells fromclipboard to currentcursor positionPaste cells fromclipboard belowcurrent cellDelete current cellsSplit up a cell fromcurrent cursorpositionMerge current cellwith the one aboveMerge current cellwith the one belowMove current cell upMove current celldownAdjust metadataunderlying thecurrent notebookRemove cellattachmentsPaste attachments ofcurrent cellFind and replacein selected cellsCopy attachments ofcurrent cellInsert image inselected cellsEdit Mode:Executing CellsRun selected cell(s)Run current cells downand create a new oneaboveAdd new cell below thecurrent oneRun all cellsRun all cells above thecurrent cellRun all cells belowthe current cellChange the cell type ofcurrent celltoggle, togglescrolling and clearcurrent outputstoggle, togglescrolling and clearall outputToggle display of Jupyterlogo and filenameToggle line numbersin cellsWalk through a UI tourList of built-in keyboardshortcutsEdit the built-inkeyboard shortcutsNotebook help topicsDescription ofmarkdown availablein notebookInformation onunofficial JupyterNotebook extensionsIPython help topicsNumPy help topicsToggle display of toolbarToggle display of cellaction icons:- None- Edit metadata- Raw cell format- Slideshow- Attachments- Tags9. Interrupt kernel10. Restart kernel11. Display characteristics12. Open command palette13. Current kernel14. Kernel status15. Log out from notebook serverAsking For HelpPython help topicsView CellsInsert CellsAdd new cell above thecurrent oneRun current cells downand create a new onebelow1. Save and checkpoint2. Insert cell below3. Cut cell4. Copy cell(s)5. Paste cell(s) below6. Move cell up7. Move cell down8. Run current cellSciPy help topicsMatplotlib help topicsSymPy help topicsPandas help topicsAbout Jupyter NotebookDataCampLearn Python for Data Science Interactively
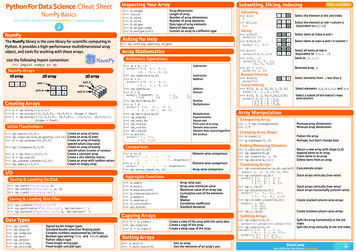
Python For Data Science Cheat SheetNumPy BasicsLearn Python for Data Science Interactively at www.DataCamp.comNumPy2The NumPy library is the core library for scientific computing inPython. It provides a high-performance multidimensional arrayobject, and tools for working with these arrays. import numpy as npNumPy Arrays1232D array3D arrayaxis 1axis 01.523456axis 2axis 1axis 0 a np.array([1,2,3]) b np.array([(1.5,2,3), (4,5,6)], dtype float) c np.array([[(1.5,2,3), (4,5,6)], [(3,2,1), (4,5,6)]],dtype float)Initial Placeholders np.zeros((3,4))Create an array of zeros np.ones((2,3,4),dtype np.int16) Create an array of ones d np.arange(10,25,5)Create an array of evenlyspaced values (step value) np.linspace(0,2,9)Create an array of evenlyspaced values (number of samples) e np.full((2,2),7)Create a constant array f np.eye(2)Create a 2X2 identity matrix np.random.random((2,2))Create an array with random values np.empty((3,2))Create an empty arrayI/OSaving & Loading On Disk np.save('my array', a) np.savez('array.npz', a, b) np.load('my array.npy')Saving & Loading Text Files np.loadtxt("myfile.txt") np.genfromtxt("my file.csv", delimiter ',') np.savetxt("myarray.txt", a, delimiter " ")Data b.dtype.nameb.astype(int)Subsetting, Slicing, IndexingArray dimensionsLength of arrayNumber of array dimensionsNumber of array elementsData type of array elementsName of data typeConvert an array to a different typeSigned 64-bit integer typesStandard double-precision floating pointComplex numbers represented by 128 floatsBoolean type storing TRUE and FALSE valuesPython object typeFixed-length string typeFixed-length unicode typeSubsettingAsking For Help123Select the element at the 2nd index b[1,2]6.01.523456Select the element at row 0 column 2(equivalent to b[1][2]) a[0:2]123Select items at index 0 and 11.523Select items at rows 0 and 1 in column 14561.5234563Slicing b[0:2,1] np.info(np.ndarray.dtype)array([ 2.,Array MathematicsAlso see Lists a[2]array([1, 2])5.]) b[:1] c[1,.]Select all items at row 0(equivalent to b[0:1, :])Same as [1,:,:] a[ : :-1]Reversed array aarray([[1.5, 2., 3.]])array([[[ 3., 2., 1.],[ 4., 5., 6.]]]) g a - bSubtraction np.subtract(a,b) b aSubtractionAddition a[a 2] np.add(b,a) a / bAdditionDivision b[[1, 0, 1, 0],[0, 1, 2, 0]]Select elements (1,0),(0,1),(1,2) and (0,0) b[[1, 0, 1, 0]][:,[0,1,2,0]]Select a subset of the matrix’s rowsand columnsarray([[-0.5, 0. , 0. ],[-3. , -3. , -3. ]])array([[ 2.5,[ 5. ,4. ,7. ,array([[ 0.66666667, 1.[ 0.25, 0.4array([[[ 1.5,4. ,4. ,10. s(b)np.log(a)e.dot(f)array([[ 7.,[ 7.,array([3, 2, 1])6. ],9. ]]) np.divide(a,b) a * bCreating Arrays Arithmetic OperationsUse the following import convention:1D arrayInspecting Your Array, 1., 0.5],]])9. ],18. ionSquare rootPrint sines of an arrayElement-wise cosineElement-wise natural logarithmDot product7.],7.]]) a bElement-wise comparison a 2Element-wise comparison np.array equal(a, b)Array-wise comparisonarray([[False, True, True],[False, False, False]], dtype bool)array([True, False, False], dtype bool)Aggregate Functionsa.sum()a.min()b.max(axis 0)b.cumsum(axis e sumArray-wise minimum valueMaximum value of an array rowCumulative sum of the elementsMeanMedianCorrelation coefficientStandard deviationCopying Arrays h a.view() np.copy(a) h a.copy()23Fancy Indexingarray([ 4. , 2. , 6. , 1.5])array([[ 4. ,5.[ 1.5, 2.[ 4. , 5.[ 1.5, 2.,,,,6.3.6.3.,,,,4. ],1.5],4. ],1.5]])Create a view of the array with the same dataCreate a copy of the arrayCreate a deep copy of the arraySort an arraySort the elements of an array's axisSelect elements from a less than 2Array ManipulationTransposing Array i np.transpose(b) i.TPermute array dimensionsPermute array dimensions b.ravel() g.reshape(3,-2)Flatten the arrayReshape, but don’t change data Return a new array with shape (2,6)Append items to an arrayInsert items in an arrayDelete items from an arrayChanging Array Shapeh.resize((2,6))np.append(h,g)np.insert(a, 1, 5)np.delete(a,[1])Combining Arrays np.concatenate((a,d),axis 0) Concatenate arraysarray([ 1,2,3, 10, 15, 20]) np.vstack((a,b))Stack arrays vertically (row-wise) np.r [e,f] np.hstack((e,f))Stack arrays vertically (row-wise)Stack arrays horizontally (column-wise)array([[ 1. ,[ 1.5,[ 4. ,array([[ 7.,[ 7.,2. ,2. ,5. ,7.,7.,3. ],3. ],6. ]])1.,0.,0.],1.]]) np.column stack((a,d))Create stacked column-wise arrays np.c [a,d]Create stacked column-wise arrays np.hsplit(a,3)Split the array horizontally at the 3rdindexSplit the array vertically at the 2nd indexarray([[ 1, 10],[ 2, 15],[ 3, 20]])Splitting ArraysSorting Arrays a.sort() c.sort(axis 0)1array([1])Adding/Removing ElementsComparison Boolean Indexing[array([1]),array([2]),array([3])] np.vsplit(c,2)[array([[[ 1.5,[ 4. ,array([[[ 3.,[ 4.,2. , 1. ],5. , 6. ]]]),2., 3.],5., 6.]]])]DataCampLearn Python for Data Science Interactively
Python For Data Science Cheat SheetSciPy - Linear AlgebraLearn More Python for Data Science Interactively at www.datacamp.comSciPyThe SciPy library is one of the core packages forscientific computing that provides mathematicalalgorithms and convenience functions built on theNumPy extension of Python.Interacting With NumPy Also see NumPyimport numpy as npa np.array([1,2,3])b np.array([(1 5j,2j,3j), (4j,5j,6j)])c np.array([[(1.5,2,3), (4,5,6)], [(3,2,1), (4,5,6)]])Index Tricks np.mgrid[0:5,0:5]np.ogrid[0:2,0:2]np.r [[3,[0]*5,-1:1:10j]np.c [b,c]Create a dense meshgridCreate an open meshgridStack arrays vertically (row-wise)Create stacked column-wise arraysShape Manipulation k((a,b))np.hsplit(c,2)np.vpslit(d,2)Permute array dimensionsFlatten the arrayStack arrays horizontally (column-wise)Stack arrays vertically (row-wise)Split the array horizontally at the 2nd indexSplit the array vertically at the 2nd indexPolynomials from numpy import poly1d p poly1d([3,4,5])Create a polynomial objectVectorizing Functions np.vectorize(myfunc)Vectorize functionsType Handling np.real(c)np.imag(c)np.real if close(c,tol 1000)np.cast['f'](np.pi)Return the real part of the array elementsReturn the imaginary part of the array elementsReturn a real array if complex parts close to 0Cast object to a data typeOther Useful Functions(number of samples) g [3:] np.pinp.unwrap(g)Unwrapnp.logspace(0,10,3)Create an array of evenly spaced values (log scale)np.select([c 4],[c*2]) Return values from a list of arrays depending on misc.factorial(a)misc.comb(10,3,exact True)misc.central diff weights(3)misc.derivative(myfunc,1.0) from scipy import linalg, sparseCreating Matrices ABCD Basic Matrix RoutinesInverse A.Ilinalg.inv(A)A.TA.Hnp.trace(A)Norm linalg.norm(A) linalg.norm(A,1) e N things taken at k timeWeights for Np-point central derivativeFind the n-th derivative of a function at a pointInverseInverseTranpose matrixConjugate transpositionTraceFrobenius normL1 norm (max column sum)L inf norm (max row sum)Matrix rank linalg.det(A)Determinant linalg.solve(A,b) E np.mat(a).T linalg.lstsq(D,E)Solver for dense matricesSolver for dense matricesLeast-squares solution to linear matrixequationSolving linear problemsGeneralized inverse linalg.pinv(C)Compute the pseudo-inverse of a matrix(least-squares solver)Compute the pseudo-inverse of a matrix(SVD)F np.eye(3, k 1)G np.mat(np.identity(2))C[C 0.5] 0H sparse.csr matrix(C)I sparse.csc matrix(D)J sparse.dok matrix(A)E.todense()sparse.isspmatrix csc(A)Create a 2X2 identity matrixCreate a 2x2 identity matrixCompressed Sparse Row matrixCompressed Sparse Column matrixDictionary Of Keys matrixSparse matrix to full matrixIdentify sparse matrixSparse Matrix RoutinesInverseInverse sparse.linalg.norm(I)Norm sparse.linalg.spsolve(H,I)Solver for sparse matricesSparse Matrix Functions sparse.linalg.expm(I)Asking For Help help(scipy.linalg.diagsvd) np.info(np.matrix) np.subtract(A,D)Subtraction np.divide(A,D)Division MultiplicationDot productVector dot productInner productOuter productTensor dot productKronecker kron(A,D)Exponential Functions linalg.expm(A) linalg.expm2(A) linalg.expm3(D)Matrix exponentialMatrix exponential (Taylor Series)Matrix exponential (eigenvaluedecomposition)Logarithm Function linalg.logm(A)Matrix logarithm linalg.sinm(D) linalg.cosm(D) linalg.tanm(A)Matrix sineMatrix cosineMatrix tangent linalg.sinhm(D) linalg.coshm(D) linalg.tanhm(A)Hypberbolic matrix sineHyperbolic matrix cosineHyperbolic matrix tangent np.sigm(A)Matrix sign function linalg.sqrtm(A)Matrix square root linalg.funm(A, lambda x: x*x)Evaluate matrix functionTrigonometric TunctionsHyperbolic Trigonometric FunctionsMatrix Sign FunctionMatrix Square RootDecompositionsEigenvalues and Eigenvectors la, v linalg.eig(A) l1, l2 lav[:,0]v[:,1]linalg.eigvals(A)Singular Value Decomposition sparse.linalg.inv(I)Solving linear problemsAdditionSubtractionArbitrary FunctionsCreating Sparse Matrices np.add(A,D)Multiplication np.linalg.matrix rank(C)DeterminantMatrix mat([[3,4], [5,6]])Norm np.angle(b,deg True)Return the angle of the complex argument g np.linspace(0,np.pi,num 5) Create an array of evenly spaced valuesAlso see NumPyYou’ll use the linalg and sparse modules. Note that scipy.linalg contains and expands on numpy.linalg. linalg.pinv2(C) def myfunc(a):if a 0:return a*2else:return a/2Linear AlgebraSparse matrix exponentialSolve ordinary or generalizedeigenvalue problem for square matrixUnpack eigenvaluesFirst eigenvectorSecond eigenvectorUnpack eigenvalues U,s,Vh linalg.svd(B)Singular Value Decomposition (SVD) M,N B.shape Sig linalg.diagsvd(s,M,N) Construct sigma matrix in SVDLU Decomposition P,L,U linalg.lu(C)LU DecompositionSparse Matrix Decompositions la, v sparse.linalg.eigs(F,1) sparse.linalg.svds(H, 2)DataCampEigenvalues and eigenvectorsSVDLearn Python for Data Science Interactively
Python For Data Science Cheat SheetPandas BasicsLearn Python for Data Science Interactively at www.DataCamp.comAsking For HelpSelectionAlso see NumPy ArraysGetting s['b']Get one element df[1:]Get subset of a DataFrame-5PandasThe Pandas library is built on NumPy and provides easy-to-usedata structures and data analysis tools for the Pythonprogramming language.Dropping help(pd.Series.loc)12CountryIndiaBrazilCapitalNew DelhiBrasíliaPopulation1303171035207847528By Position import pandas as pd df.iloc([0],[0])'Belgium'Pandas Data StructuresIndexa3b-5c7d4 s pd.Series([3, -5, 7, 4], index ['a', 'b', 'c', 'd'])DataFrameColumnsIndexSelect single value by row &column'Belgium'A one-dimensional labeled arraycapable of holding any data ulation11190846New Delhi 1303171035BrasíliaA two-dimensional labeleddata structure with columnsof potentially different types207847528 data {'Country': ['Belgium', 'India', 'Brazil'],'Capital': ['Brussels', 'New Delhi', 'Brasília'],'Population': [11190846, 1303171035, 207847528]} df pd.DataFrame(data,columns ['Country', 'Capital', 'Population'])'Belgium'Select single value by row &column labels df.at([0], ['Country'])'Belgium'By Label/Position df.ix[2]Select single row ofsubset of rows df.ix[:,'Capital']Select a single column ofsubset of columns df.ix[1,'Capital']Select rows and columnsCountryBrazilCapitalBrasíliaPopulation 207847528012BrusselsNew DelhiBrasíliaBoolean IndexingSettingSet index a of Series s to 6Read and Write to Excel pd.read excel('file.xlsx') pd.to excel('dir/myDataFrame.xlsx', sheet name 'Sheet1')Read multiple sheets from the same file xlsx pd.ExcelFile('file.xls') df pd.read excel(xlsx, 'Sheet1')(rows,columns)Describe indexDescribe DataFrame columnsInfo on DataFrameNumber of non-NA values .idxmax()df.describe()df.mean()df.median()Sum of valuesCummulative sum of valuesMinimum/maximum valuesMinimum/Maximum index valueSummary statisticsMean of valuesMedian of valuesApplying Functions f lambda x: x*2 df.apply(f) df.applymap(f)Apply functionApply function element-wiseInternal Data Alignment s3 pd.Series([7, -2, 3], index ['a', 'c', 'd']) s s3a10.0c5.0bdNaN7.0Arithmetic Operations with Fill MethodsI/O pd.read csv('file.csv', header None, nrows 5) df.to .info()df.count()NA values are introduced in the indices that don’t overlap: s[ (s 1)]Series s where value is not 1 s[(s -1) (s 2)]s where value is -1 or 2 df[df['Population'] 1200000000] Use filter to adjust DataFrameRead and Write to CSV Data Alignment'New Delhi' s['a'] 6 df.sort index()Sort by labels along an axis df.sort values(by 'Country') Sort by the values along an axis df.rank()Assign ranks to entriesSummaryBy Label df.loc([0], ['Country'])Sort & RankBasic Information df.iat([0],[0])SeriesDrop values from rows (axis 0) df.drop('Country', axis 1) Drop values from columns(axis 1)Retrieving Series/DataFrame InformationSelecting, Boolean Indexing & SettingUse the following import convention: s.drop(['a', 'c'])Read and Write to SQL Query or Database Table from sqlalchemy import create engineengine create engine('sqlite:///:memory:')pd.read sql("SELECT * FROM my table;", engine)pd.read sql table('my table', engine)pd.read sql query("SELECT * FROM my table;", engine)read sql()is a convenience wrapper around read sql table() andread sql query() pd.to sql('myDf', engine)You can also do the internal data alignment yourself withthe help of the fill methods: s.add(s3, fill value 0)abcd10.0-5.05.07.0 s.sub(s3, fill value 2) s.div(s3, fill value 4) s.mul(s3, fill value 3)DataCampLearn Python for Data Science Interactively
Python For Data Science Cheat SheetScikit-LearnNaive Bayes from sklearn.metrics import classification report Precision, recall, f1-score print(classification report(y test, y pred)) and supportClassification ReportKNNUnsupervised Learning EstimatorsK MeansSupervised learning lr.fit(X, y) knn.fit(X train, y train) svc.fit(X train, y train)Unsupervised Learning k means.fit(X train) pca model pca.fit transform(X train)Standardizationfrom sklearn.preprocessing import StandardScalerscaler StandardScaler().fit(X train)standardized X scaler.transform(X train)standardized X test scaler.transform(X test)Normalization from sklearn.preprocessing import Normalizerscaler Normalizer().fit(X train)normalized X scaler.transform(X train)normalized X test scaler.transform(X test)Binarization from sklearn.preprocessing import Binarizer binarizer Binarizer(threshold 0.0).fit(X) binary X binarizer.transform(X)Mean Squared ErrorR² Score from sklearn.metrics import r2 score r2 score(y true, y pred)Clustering MetricsAdjusted Rand IndexFit the model to the data from sklearn.metrics import adjusted rand score adjusted rand score(y true, y pred)HomogeneityFit the model to the dataFit to data, then transform itPredictionSupervised Estimators y pred svc.predict(np.random.random((2,5))) Predict labels y pred lr.predict(X test)Predict labels y pred knn.predict proba(X test)Estimate probability of a labelUnsupervised Estimators y pred k means.predict(X test) from sklearn.metrics import homogeneity score homogeneity score(y true, y pred)V-measure from sklearn.metrics import v measure score metrics.v measure score(y true, y pred)Cross-ValidationPredict labels in clustering algosPreprocessing The Data Mean Absolute Error from sklearn.metrics import mean squared error mean squared error(y test, y pred)Model Fittingimport numpy as npX np.random.random((10,5))y 'F'])X[X 0.7] 0Regression MetricsPrincipal Component Analysis (PCA) from sklearn.cluster import KMeans k means KMeans(n clusters 3, random state 0)Your data needs to be numeric and stored as NumPy arrays or SciPy sparsematrices. Other types that are convertible to numeric arrays, such as PandasDataFrame, are also acceptable.Confusion Matrix from sklearn.metrics import confusion matrix print(confusion matrix(y test, y pred)) from sklearn.metrics import mean absolute error y true [3, -0.5, 2] mean absolute error(y true, y pred) from sklearn.decomposition import PCA pca PCA(n components 0.95)Also see NumPy & Pandas from sklearn.model selection import train test split X train, X test, y train, y test train test split(X,y,random state 0)Support Vector Machines (SVM) from sklearn import neighbors knn neighbors.KNeighborsClassifier(n neighbors 5)from sklearn import neighbors, datasets, preprocessingfrom sklearn.model selection import train test splitfrom sklearn.metrics import accuracy scoreiris datasets.load iris()X, y iris.data[:, :2], iris.targetX train, X test, y train, y test train test split(X, y, random state 33)scaler preprocessing.StandardScaler().fit(X train)X train scaler.transform(X train)X test scaler.transform(X test)knn neighbors.KNeighborsClassifier(n neighbors 5)knn.fit(X train, y train)y pred knn.predict(X test)accuracy score(y test, y pred)Accuracy ScoreEstimator score method knn.score(X test, y test) from sklearn.metrics import accuracy score Metric scoring functions accuracy score(y test, y pred) from sklearn.naive bayes import GaussianNB gnb GaussianNB()A Basic ExampleTraining And Test DataClassification Metrics from sklearn.svm import SVC svc SVC(kernel 'linear')Scikit-learn is an open source Python library thatimplements a range of machine learning,preprocessing, cross-validation and visualizationalgorithms using a unified interface. Supervised Learning Estimators from sklearn.linear model import LinearRegression lr LinearRegression(normalize True)Scikit-learnLoading The DataEvaluate Your Model’s PerformanceLinear RegressionLearn Python for data science Interactively at www.DataCamp.com Create Your ModelEncoding Categorical Features from sklearn.preprocessing import LabelEncoder enc LabelEncoder() y enc.fit transform(y)Imputing Missing Values from sklearn.preprocessing import Imputer imp Imputer(missing values 0, strategy 'mean', axis 0) imp.fit transform(X train)Generating Polynomial Features from sklearn.preprocessing import PolynomialFeatures poly PolynomialFeatures(5) poly.fit transform(X) from sklearn.cross validation import cross val score print(cross val score(knn, X train, y train, cv 4)) print(cross val score(lr, X, y, cv 2))Tune Your ModelGrid Search from sklearn.grid search import GridSearchCV params {"n neighbors": np.arange(1,3),"metric": ["euclidean", "cityblock"]} grid GridSearchCV(estimator knn,param grid params) grid.fit(X train, y train) print(grid.best score ) print(grid.best estimator .n neighbors)Randomized Parameter Optimization from sklearn.grid search import RandomizedSearchCV params {"n neighbors": range(1,5),"weights": ["uniform", "distance"]} rsearch RandomizedSearchCV(estimator knn,param distributions params,cv 4,n iter 8,random state 5) rsearch.fit(X train, y train) print(rsearch.best score )DataCampLearn Python for Data Science Interactively
Python For Data Science Cheat SheetMatplotlibPlot Anatomy & WorkflowPlot AnatomyAxes/SubplotLearn Python Interactively at www.DataCamp.comMatplotlibY-axisMatplotlib is a Python 2D plotting library which producespublication-quality figures in a variety of hardcopy formatsand interactive environments acrossplatforms.1Prepare The DataAlso see Lists & NumPy1D Data import numpy as npx np.linspace(0, 10, 100)y np.cos(x)z np.sin(x)2D Data or Images 2data 2 * np.random.random((10, 10))data2 3 * np.random.random((10, 10))Y, X np.mgrid[-3:3:100j, -3:3:100j]U -1 - X**2 YV 1 X - Y**2from matplotlib.cbook import get sample dataimg np.load(get sample data('axes grid/bivariate normal.npy')) import matplotlib.pyplot as pltFigure fig plt.figure() fig2 plt.figure(figsize plt.figaspect(2.0))AxesAll plotting is done with respect to an Axes. In most cases, asubplot will fit your needs. A subplot is an axes on a grid system.3 import matplotlib.pyplot as pltx [1,2,3,4]Step 1y [10,20,25,30]fig plt.figure() Step 2ax fig.add subplot(111) Step 3ax.plot(x, y, color 'lightblue', linewidth 3) Step 3, 4ax.scatter([2,4,6],[5,15,25],color 'darkgreen',marker ' ') ax.set xlim(1, 6.5) plt.savefig('foo.png')Step 6 plt.show()FigureX-axis4Customize PlotColors, Color Bars & Color MapsMathtext plt.title(r' sigma i 15 ', fontsize 20)plt.plot(x, x, x, x**2, x, x**3)ax.plot(x, y, alpha 0.4)ax.plot(x, y, c 'k')fig.colorbar(im, orientation 'horizontal')im ax.imshow(img,cmap 'seismic')Limits, Legends & LayoutsLimits & Autoscaling Markers fig, ax plt.subplots() ax.scatter(x,y,marker ".") ax.plot(x,y,marker "o")fig.add axes()ax1 fig.add subplot(221) # row-col-numax3 fig.add subplot(212)fig3, axes plt.subplots(nrows 2,ncols 2)fig4, axes2 plt.subplots(ncols 3) ax.margins(x 0.0,y 0.1)ax.axis('equal')ax.set(xlim [0,10.5],ylim [-1.5,1.5])ax.set xlim(0,10.5) ax.set(title 'An Example Axes',ylabel 'Y-Axis',xlabel 'X-Axis') ax.legend(loc 'best')Set a title and x-and y-axis labels ax.xaxis.set(ticks range(1,5),ticklabels [3,100,-12,"foo"]) ax.tick params(axis 'y',direction 'inout',length 10)Manually set x-ticks fig3.subplots adjust(wspace 0.5,hspace 0.3,left 0.125,right 0.9,top 0.9,bottom 0.1) fig.tight layout()Adjust the spacing between subplotsText & Annotations ax.text(1,-2.1,'Example Graph',style 'italic') ax.annotate("Sine",xy (8, 0),xycoords 'data',xytext (10.5, 0),textcoords 'data',arrowprops dict(arrowstyle "- ",connectionstyle "arc3"),)Subplot Spacing axes[0,1].arrow(0,0,0.5,0.5) axes[1,1].quiver(y,z
Python For Data Science Cheat Sheet NumPy Basics Learn Python for Data Science Interactively at www.DataCamp.com NumPy DataCamp Learn Python for Data Science Interactively The NumPy library is the core library for scienti c computing in Python. It provides a high-performance multidimension
