Transcription
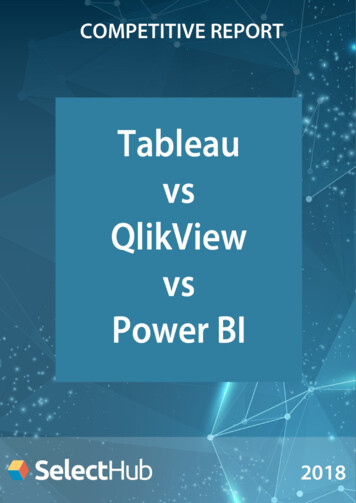
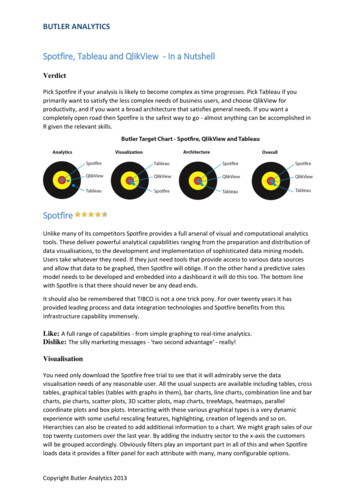
BUTLER ANALYTICSSpotfire, Tableau and QlikView - In a NutshellVerdictPick Spotfire if your analysis is likely to become complex as time progresses. Pick Tableau if youprimarily want to satisfy the less complex needs of business users, and choose QlikView forproductivity, and if you want a broad architecture that satisfies general needs. If you want acompletely open road then Spotfire is the safest way to go - almost anything can be accomplished inR given the relevant skills.SpotfireUnlike many of its competitors Spotfire provides a full arsenal of visual and computational analyticstools. These deliver powerful analytical capabilities ranging from the preparation and distribution ofdata visualisations, to the development and implementation of sophisticated data mining models.Users take whatever they need. If they just need tools that provide access to various data sourcesand allow that data to be graphed, then Spotfire will oblige. If on the other hand a predictive salesmodel needs to be developed and embedded into a dashboard it will do this too. The bottom linewith Spotfire is that there should never be any dead ends.It should also be remembered that TIBCO is not a one trick pony. For over twenty years it hasprovided leading process and data integration technologies and Spotfire benefits from thisinfrastructure capability immensely.Like: A full range of capabilities - from simple graphing to real-time analytics.Dislike: The silly marketing messages - 'two second advantage' - really!VisualisationYou need only download the Spotfire free trial to see that it will admirably serve the datavisualisation needs of any reasonable user. All the usual suspects are available including tables, crosstables, graphical tables (tables with graphs in them), bar charts, line charts, combination line and barcharts, pie charts, scatter plots, 3D scatter plots, map charts, treeMaps, heatmaps, parallelcoordinate plots and box plots. Interacting with these various graphical types is a very dynamicexperience with some useful rescaling features, highlighting, creation of legends and so on.Hierarchies can also be created to add additional information to a chart. We might graph sales of ourtop twenty customers over the last year. By adding the industry sector to the x-axis the customerswill be grouped accordingly. Obviously filters play an important part in all of this and when Spotfireloads data it provides a filter panel for each attribute with many, many configurable options.Copyright Butler Analytics 2013
BUTLER ANALYTICSAd-hoc analysis, interactive reporting and dashboards are all supported and Spotfire providesvarious mechanisms for collaboration - both free form and structured. Spotfire WebPlayer providesa zero footprint web based environment to access published documents, and effectively makes theenvironment scalable to the most demanding of needs.Data SourcesIf the data storage mechanisms you use are not some home-grown oddity then Spotfire will be ableto get at them. You have to remember that TIBCO has been in the data and process integrationgame a long time, and so they know how to access data. There is no point providing a list, it wouldbe two pages long.AnalysisSo, you have created some graphs, charts, tables and dashboards, but now you want to get a littlebit fancy. Maybe you want to do some correlation analysis or create some predictive models toembed into charts. This is where Spotfire really excels, and none of the newer generation ofBI/analysis tools equal it in this respect. There are several components including Spotfire StatisticalServices to execute R, S , SAS and MATLAB routines, and Spotfire Miner, a graphical environment fordata mining and creating predictive models. And as you may or may not know, R is a free, OpenSource statistics and analysis package that is very widely used, and so it makes sense to be able toembed R based analysis into your analytics environment.Copyright Butler Analytics 2013
BUTLER ANALYTICSPerformanceSpotfire employs a hybrid of in-database (processing carried out in the database systemenvironment) and in-memory (data held and processed in local memory - i.e. on your PC). In themain it works very well, although conducting analysis on 100GB of data will mean waiting a fewminutes for it to be loaded into memory (if you have that much). This is the reality of processinglarge data sets, and you certainly wouldn't want to load a central server with dozens of suchrequests - you might be waiting more than a few minutes.TIBCOTIBCO's roots go way back to 1985 and for many years it majored on it's middleware products sothat applications and data could be integrated. The actual name TIBCO (The Information BusCompany) was adopted in 1997.The company is headquartered in Palo Alto US and has offices around the world. It is a publiclyquoted company with revenues of around US 1 billion.TableauTableau is charting, graphing and data analysis with go-faster stripes. It has obvious appeal, withprolific amounts of eye-candy and a relatively easy to use interface. As with other products of thisnature its utility is firmly anchored in visual exploration of data using every format imaginable. It isnot a data mining tool or a text analytics tool, but sits in the traditional business intelligence camp,albeit with a rich visual interface. It is positioned as one of a new breed of BI tools designed todeliver pervasive BI capability throughout the organization, or at least to those who need such tools.Likes: Lots of eye candy and attractive visualisations.Dislikes: Not much in the way of computational analytics.Copyright Butler Analytics 2013
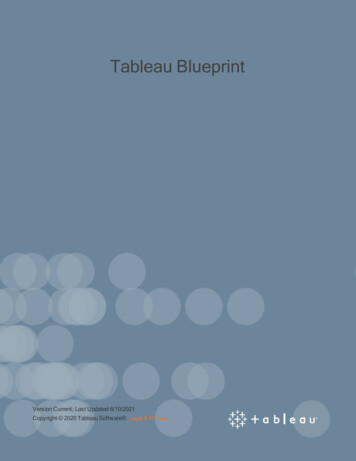
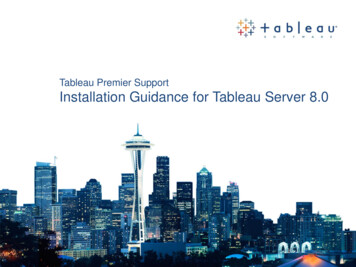
BUTLER ANALYTICSThe entry level product is Tableau Public, available as a throttled down free version, or in a Premiumversion with fewer restrictions. It is primarily targeted at the creation of graphics for web sites andoffers a 'paint-by-numbers' approach to the creation and publishing of such graphics. A rich set offormats are supported including bar and line charts, heat maps, bubble charts, geo maps and manyothers (you are spoiled for choice really). Graphics are updated automatically when the underlyingdata is modified and links can be made to other content on a web site. The Premium versionsupports larger data sets and the optional suppression of access to the underlying data set. Thereare numerous web services of this nature (Jolicharts for example), but Tableau Public is certainly oneof the best free offerings.Tableau Desktop supports the visualization of data on the desktop and connects to a bewilderingarray of data sources, either individually or in concert. The Tableau Data Engine sits on a PC and callsupon the relevant data sources when needed. It executes queries in-memory for speed and switchesdata in and out of memory automatically, although clearly some wisdom is needed when accessinglive data sources.VizQL is Tableau's Visual Query Language and is claimed to bypass the usualextraction, format, graphing process to build a direct link between data sources and visualrepresentations.Tableau Server supports browser based tools for data visualization and as such opens BI up to a verywide audience. It provides the very wide range of visualizations and dashboards supported byTableau, and also make them available on portable devices (iPad and Android).Tableau places great emphasis on the ability to create visualizations without the need for anytechnical skills (scripting). Provided Tableau always offers what you need this is fine, the momentyou want something different this could be problematical. For this reason I think it is wiser to haveboth options – scripting free visualizations for run-of-the mill tasks, but scripting capability for moreunusual needs. Other offerings are stronger in this respect.QlikViewLikes: Very clever structuring of data for analysis purposes.Dislikes: None really, but could have more computational analytics capability.QlikView has more than just a pretty face, there is some truly innovative, and very useful technologyon offer here. The company talks of maintaining associations between data, and this facilitates amuch more flexible approach to data exploration and visualization. In practice what this means isthat users can search available data resources with the knowledge that any relevant items will beretrieved, no matter how disjoint the origins of the various data items. In a way it is almost amerging of enterprise search with BI - something I talked about several years ago. The QlikViewBusiness Discovery Platform provides an enterprise wide solution to the need for information. Itembraces IT (instead of alienating it), business users and analysts. This is comprised of three maincomponents - the QlikView Server, QlikView Publisher and QlikView Desktop. QlikView Desktop is where the associations between data items are established and wherethe user interface is laid out for QlikView Apps. An SQL like scripting language is used tocreate associations for use by business users and analysts.Copyright Butler Analytics 2013
BUTLER ANALYTICS QlikView Server is the engine of the architecture where in-memory processing takes placeand where issues such as security are addressed. It also handles communication with clients(web browsers, mobile or desktop) and includes a web server, although Microsoft IIS canalso be used.QlikView Publisher loads data from the various defined data sources and distributesdocuments to the QlickView Server(s) for consumption by users.Because the users generate their own reports and visualizations IT is left to get on with addressingthe infrastructure issues associated with BI, including security, capacity, governance and systemsmanagement. The analyst typically uses QlikView Desktop to create the data models users will need.Meanwhile business users are presented with an environment where the data can be viewed as aunified whole, where a rich visualization environment is provided and where needed, QlikViewsupports extensive collaboration features.QlikView has clearly thought the whole thing out both conceptually and practically. The net result isthat every function in the organization should get what it wants. This is a different, and potentiallymuch more productive, approach to BI. The capability does not extend to data mining or other formsof analytics, and it doesn't pretend to. The scripting language provides ample means to create highlybespoke solutions to individual organization needs, and as a BI tool it should not run into any deadends. QlikView is certainly worthy of serious consideration.Copyright Butler Analytics 2013
BUTLER ANALYTICSThis is a completely independent, unsponsored review and comparison of Spotfire, Tableau andQlikView.Enquiries to info@butleranalytics.comCopyright Butler Analytics 2013
Spotfire, Tableau and QlikView - In a Nutshell Verdict Pick Spotfire if your analysis is likely to become complex as time progresses. Pick Tableau if you primarily want to satisfy the less complex needs of business users, and choose QlikView for productivity, and if you want a broad