Transcription
USTelecom Research BriefJuly 31, 2019U.S. BROADBAND INVESTMENT CONTINUED UPSWING IN 2018Patrick BroganVice President for Industry Analysis
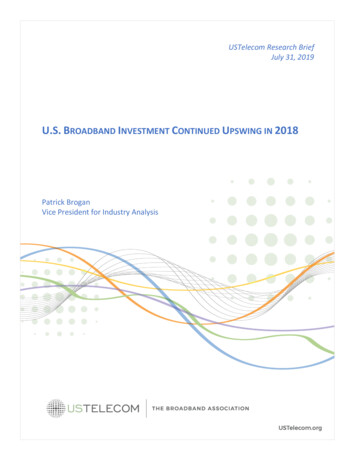
USTelecom Research BriefJuly 31, 2019SummaryU.S. broadband providers invested approximately 80.0 billion in network infrastructure in 2018, up morethan 3.1 billion from 76.9 billion in 2017 (see Chart 1). Broadband provider capital spending has nowsurpassed the recent peak of 78.0 billion reported in 2014 by 2.0 billion. From 1996 through 2018, thebroadband industry has made capital investments totaling more than 1.7 trillion (see Chart 2). USTelecomhas published its broadband provider capital expenditures data series annually for the last nine years. Thedata now cover 23 years of broadband provider capital investment and include minor historical revisions toincorporate new information.Chart 1U.S. Broadband Provider Capital Expenditures, 2008-2018 ( 132018Source: USTelecom. Figures are rounded.The growth in broadband provider capital expenditures in 2018 built on the momentum begun the year beforewhen industry reversed a two-year decline in annual capital spending levels. The decline started in 2015 whencapital spending fell, for the first time since the 2008-2009 recession, by approximately 0.5 billion. Thedecline then accelerated in 2016, when spending fell by another 2.7 billion. In all, by 2016, annual capitalspending by broadband providers was 3.2 billion lower than it was at the previous peak in 2014.By contrast, annual spending increased by approximately 2.0 billion in 2017 and 3.1 billion in 2018. In all,annual broadband provider capital spending was approximately 5.1 billion greater in 2018 than 2016. In thelast two years, industry has spent approximately 7.1 billion more than it would have at 2016 annual spendinglevels.1
USTelecom Research BriefJuly 31, 2019The start of the broadband capital investment decline in 2015 coincided with a Federal CommunicationsCommission (FCC) decision to reclassify broadband providers as common carriers under Title II of theCommunications Act. USTelecom has consistently stated that the relevant question with respect to the impactof Title II on investment is what investment would have been over the long term under different regulatoryscenarios, holding other factors constant. Relevant factors might include, for example, competition, financialmarkets, taxes, government mandates, product cycles, project timelines, regulation, and company-specificfactors. USTelecom does not attempt in this research brief to isolate and control for the various factors andtherefore does not draw conclusions about the extent to which the move to Title II may have caused thedecline in capital investment. However, the decline in the series in 2015 and 2016, followed by a return togrowth in 2017 and 2018 after the FCC had indicated its intention to repeal the Title II classification, suggeststhat expectations regarding common carrier regulation were likely a factor and warrants further investigationand analysis. USTelecom cited previous research efforts to isolate the impact of common-carrier regulation oninvestment in its October 31, 2017 research brief.Broadband investment remains critical to modernizing our nation’s network infrastructure, maintaininginternational leadership, expanding economic growth and job creation, and closing the broadband gaps thatexist in rural America. It will be necessary to maintain a policy environment that encourages greaterinvestment, given projected growth in demand for data usage as well as the need to expand networks furtherinto currently unserved areas.The Cisco Visual Networking Index projected U.S. Internet Protocol traffic to grow nearly three times in thefive years from 2017 to 2022. Traffic growth will be driven by consumer and business use of streaming media,faster 5G mobile networks, the growing Internet of Things, and cloud-based services. The internet connectionsand the mobile and data center infrastructures that deliver these services will require constant broadbandinvestment in capacity, speed, and reliability.While underlying broadband infrastructure, both fixed and wireless, is available to almost all Americans, thereremain gaps in portions of rural America. For example, an analysis of 2017 data from USTelecom and BPITelcodata indicate that 73 percent of rural areas have access to fixed terrestrial broadband at speeds of 25megabits per second download and 3 megabits per second upload, compared to 99 percent of non-rural areas.Policies that encourage more investment can help to close these gaps and bring the benefits of cutting-edgebroadband service to all American consumers and businesses.Chart 2Historical Capital Expenditures by U.S. Broadband Providers ( billion, 1996 -2018)1996 1997 1998 1999 2000 2001 2002 2003 2004 2005 2006 2007 2008 2009 2010 2011 2012 2013 2014 2015 2016 2017 2018Broadband Provider Capex55.1 65.0 71.8 91.8 118.1 111.5 72.0 57.0 57.5 62.1 70.1 70.4 71.1 64.5 67.9 68.1 69.6 76.0 78.0 77.5 74.8 76.9 80.0Source: USTelecom2
USTelecom Research BriefJuly 31, 2019MethodologyUSTelecom collects capital expenditures data for wireline telecommunications, wireless telecommunications,and cable broadband providers in order to approximate an industry aggregate. The data exclude otherproviders, such as satellite providers, telecommunications resellers, and electric utilities. The data arenominal; USTelecom does not adjust for inflation or quality. Figures are rounded. Previous years may includeminor revisions.The majority of telecommunications data come from company financial statements, taking into accountbusiness segment reporting, accounting changes, mergers, and spin-offs. The analysis is subject to thereporting practices of individual companies. Capital expenditures may include investment in property, plant,and equipment, capitalized software, capitalized interest during construction, corporate, directory, and othercapital expenditures, and intra-company eliminations. Reasonable efforts are made to eliminate doublecounting, non-U.S. investment, and non-capital spending. USTelecom makes estimates for non-reportingcompanies.USTelecom also consults additional market research and government sources for comparison, including theUnited States Census Annual Capital Expenditures Survey, the Yankee Group Global Capex Forecast 2010, theSkyline Marketing Capex Report 2010, data from the Cellular Telecommunications & Internet Association(CTIA), and New Paradigm Resources Group. Cable data are from NCTA – The Internet & TelevisionAssociation.Technical NotesIt has been necessary to adjust certain reported capital expenditures, particularly since 2014, to ensure thatthe data series remains consistent over time and reflects actual change in the capital stock of the U.S.economy. The data contain additional historical revisions based on new information. The discussion belowaddresses the adjustments to reported capex and historical revisions. See Chart 4 for a detailed listing ofadjustments since 2015. See also related discussions in previous USTelecom broadband provider capitalexpenditures research: December 14, 2016; October 31, 2017; and October 18, 2018.Capitalized Wireless PhonesUSTelecom excludes certain reported capital expenditures for wireless phones leased to customers. It wasnecessary to exclude capital expenditures for leased phones because otherwise total company-reportedcapital expenditures would not provide an apples-to-apples comparison over the course of our time series.Under accounting rules, Sprint reports wireless phones purchased for leasing to customers as capitalexpenditures. It breaks out capital expenditures for leased wireless phones from network and other capitalexpenditures. Sprint reports based on a fiscal year ending on March 31 each year. Therefore, USTelecom usesquarterly data mapped to the calendar year.3
USTelecom Research BriefJuly 31, 2019Sprint’s wireless phone leasing program began at the end of 2014 and ramped up at an extraordinary pace in2015. Reported amounts remained similar – in the 2 billion range from 2015 through 2017. Through 2017,Sprint only capitalized wireless phones leased through indirect channels. Starting in 2018, Sprint begancapitalizing all leased wireless phones, whether leased through indirect or direct channels. Sprint has reportedrevised historical data sufficient to calculate all capitalized wireless phones for the full calendar year back to2017.In order to maintain the consistency of the data series for all periods, USTelecom excludes the followingamounts that Sprint reports as capital expenditures for leased wireless phones: 143 million in 2014; 2.163billion in 2015; 2.098 billion in 2016; 6.613 billion in 2017 (revised from 2.182 billion with only devices soldvia indirect channels); and 7.667 billion in 2018. See Chart 3.Including such capital expenditures for leased phones would skew the data series and would have inflated theperception of growth by 2 billion from 2014 to 2015 and by 4.5 billion to 5.5 billion in either 2017 or 2018,after Sprint began reporting capitalized devices leased through direct channels. (For a detailed analysis ofthese changes and their impact on USTelecom’s capital expenditures data, see Chart 3 and Chart 4).Chart 3Impact of Sprint's Leased Device Program on Reported Capex and Growth2013Sprint Spending on Capitalized DevicesIndirect Channels OnlyDirect and Indirect ChannelsTotal Capex Total Capex Excluding Sprint Capitaleized Devices Total Capex Change Year over YearTotal Capex Change Year Over Year Excluding Sprint Capitalized Devices2014n/an/a 76,03676,036n/an/a 2015143n/a 78,14378,0002,1071,964 20162,163n/a 79,67177,5081,528(492) 201720182,098n/a 2,1826,613 n/a7,66776,94574,847(2,726)(2,661) 83,48976,8766,5442,029 87,71780,0504,2283,174Source: Company Financial Reports and USTelecom Analysis. In 2018, Sprint began capitalizing all leased hansets - those leased through direct and indirect channels.Previously Sprint only capitalized handsets leased through indirect channels. Sprint reports on the basis of a fiscal year ending on March 31 of each year. USTelecom usesquarterly data mapped to the calendar year. Sprint has publicly restated historical amounts to reflect both indirect and direct channel leasing; but due to the fiscal year period,the restated data go back only to the quarter ending June 30, 2016. This table shows restated data only since 2017 since full-year data are not available for prior years.Wireless Phone AccountingThe traditional business practice among wireless companies has been the subsidized phone sale model, inwhich the provider purchases phones and sells them to its customers along with a service contract. Typically,the provider sells the phone at a steep discount, say 200 for a 600 device, or a 400 subsidy. The providerand the customer enter into a contract for about two years, in which the customer agrees to pay a certainmonthly subscription rate. That rate includes an amount sufficient to cover the cost of service and to pay offthe subsidized cost of the phone over the term of the contract.From an accounting perspective, under the subsidized phone model, the devices purchased by providers gointo inventory and the company records them as a cost of equipment sold once the customer takes ownership4
USTelecom Research BriefJuly 31, 2019of the device. Under Sprint’s leasing program, since it purchases phones to lease rather than sell to thecustomer, the devices become an asset of the company, which it records as capital expenditures.Recently, wireless carriers have employed installment plans instead of either traditional subsidy plans orleasing programs. Under installment plans, consumers also own the devices and payback the cost ininstallments over time, similar to a loan. There are differences in accounting for subsidy plans and installmentplans. For example, under subsidy plans, companies recognize revenue in periodic increments over the term ofthe contract; under installment plans, companies recognize revenue for the full sale price of the phone upfront and collect “receivables” as consumers pay off their “loan.” Regardless, like subsidy plans, wirelessproviders do not report phones sold under installment plans as capital expenditures and therefore they do notaffect USTelecom’s capital expenditures data series.Excluding Capitalized Leased Phones Is Appropriate and NecessaryIncluding leased wireless phones as capital expenditures makes sense from an accounting perspective, but notfrom an economic perspective. From the perspective of USTelecom’s capital expenditures time series, inparticular, it is appropriate and necessary to exclude capital expenditures resulting from the shift to phoneleasing programs in 2014 and their acceleration in 2015 and thereafter.First, shifting phones from a cost of goods sold to a capital expenditure on financial statements reflects anaccounting change and has no impact on the capital stock of the U.S. economy. The phones appear as capitalexpenditures merely because leasing phones requires different accounting than selling phones. In any givenperiod, U.S. wireless consumers would have had approximately the same quantity and quality of wirelessphones regardless of whether they leased them or purchased them. The capital stock of the U.S. economyattributable to wireless phones in circulation is no different than it would be otherwise because Sprint choseto lease rather than sell some of its phones. This allows, of course, for potential marginal impacts on wirelessphone adoption and market share resulting from the availability of less expensive leased phones and shortercommitment periods. But the effects are likely minimal.Second, USTelecom’s capital expenditures series measures change over time and it is therefore essential tomeasure the same thing from one period to the next. It is improper to include the capitalized phones inUSTelecom’s time series because the capitalization of these phones does not reflect actual growth in thecapital stock of the economy, just a shift in where this capital is measured. From the standpoint of theeconomy as a whole, leased phones are a business asset and sold phones are a consumer asset. One couldmake a case for measuring all wireless phones, whether they are company assets or consumer durable goods;but that would require measuring all phones in all periods, not just a one-time shift of a subset of phones ontobusiness financial statements due to a new leasing business practice. Including such a subset of leased phoneswould artificially skew the change in capital expenditures reflected in USTelecom’s data and would create thefalse impression of growth in 2015 and then again in 2017 or 2018. In other words, including the phoneswould falsely imply that broadband providers’ contribution to the national capital stock grew by 2 billionmore than it actually did in 2015; and then again by 4.5 billion or 5.5 billion in 2017 or 2018, respectively,depending on which year the series included capitalized devices leased through direct channels.5
USTelecom Research BriefJuly 31, 2019Finally, the exclusion of Sprint’s leased phones from USTelecom’s capital expenditures data is not to single outSprint nor is it to criticize leasing phones as a business practice. Most other wireless providers do not leasephones. Those who lease phones do not report them as capital expenditures, e.g., T-Mobile’s JUMP! OnDemand. USTelecom’s only objective with excluding Sprint’s capitalized wireless phones is to develop a timeseries that accurately reflects change from one period to the next.AT&T Estimates and Historical RevisionsIn 2015, AT&T revised its financial reporting to reflect the acquisitions of DirecTV and its Mexican wirelessbusiness, which occurred near the middle of that year. In 2018, AT&T again revised financial reporting toreflect the acquisition of Time Warner, now known as Warner Media, near the middle of the year. To developa consistent time series with appropriate comparisons from year-to-year, USTelecom has excluded certaincapital expenditures for these acquired businesses. In some cases, it has been necessary to estimate nonreported capital expenditures. This section describes, by year in the data series, the various estimations forAT&T capital expenditures, and details how USTelecom made historical revisions as new information becameavailable.2015 AT&T EstimateFor the full year in 2015, AT&T reported capital expenditures, including capitalized interest, of 20.0 billion.Based on public information, DirecTV was investing approximately 3 billion per year at the time of theacquisition. Additionally, in 2015, AT&T stated that it would spend approximately 3 billion over four years toupgrade its Mexican cellular network. USTelecom estimated at that time that AT&T would spendapproximately 750 million per year on the Mexican wireless upgrades. USTelecom backed out approximately 2 billion for DirecTV and Mexican wireless operations, including estimated capitalized interest, reflecting ahalf year of operations since the business units were acquired mid-year. Therefore, USTelecom estimatedAT&T’s 2015 capital expenditures excluding the DirecTV and Mexican wireless units were 18.0 billion.USTelecom does not make any additional revisions to this estimate with this release of 2018 capitalexpenditures data.2016 AT&T EstimateFor the initial release of its 2016 broadband investment data on October 31, 2017, USTelecom estimated thatAT&T’s 2016 capital expenditures, excluding DirecTV and its Mexican cellular network, were 18.5 billion.AT&T reported total 2016 capital expenditures, including capitalized interest, of 22.4 billion. Since theDirecTV and Mexican wireless units were part of AT&T for the full year in 2016, it was necessary to back out afull year of capital expenditures for these business units plus capitalized interest. USTelecom backed outapproximately 4 billion for the DirecTV and Mexican wireless units.With the subsequent release of its 2017 capital expenditures data on October 18, 2018, USTelecom revised itsestimate for AT&T’s 2016 capital expenditures, excluding the DirecTV and Mexican wireless units. See Chart 4.In 2018, AT&T publicly reported that it had accelerated the timeframe for its upgrades to the Mexican wirelessnetwork, completing the vast majority of the project by 2017. Assuming that the overall capital spending6
USTelecom Research BriefJuly 31, 2019associated with the upgrades remained constant at 3 billion and that the acceleration occurred in 2016 and2017, USTelecom revised its estimate for Mexican cellular operations in 2016 to 1.2 billion and backed out anadditional 0.5 billion from AT&T’s total 2016 capital expenditures.As a result, USTelecom reduced its estimate for AT&T’s 2016 capital expenditures, excluding the DirecTV andMexican wireless units, from 18.5 billion to 18.0 billion. USTelecom does not make any additional revisionsto this estimate with this release of 2018 capital expenditures data.2017 AT&T EstimateFor 2017, AT&T reported approximately 21.6 billion in capital expenditures, including capitalized interest. Aswith 2016, USTelecom must back out a full year of DirecTV and Mexican wireless capital spending pluscapitalized interest. Due to subscriber trends affecting equipment purchases, partially offset by a satellitelaunch, USTelecom assumes DirecTV capital spending declined from approximately 3 billion per year in 2016to 2.5 billion in 2017. Meanwhile, as discussed above, USTelecom estimated that the Mexican wireless unitcontinued to invest at an annual rate of 1.2 billion in 2017. Therefore, in its October 18, 2018 release of 2017broadband providers’ capital expenditures data, USTelecom estimated AT&T capital expenditures, excludingDirecTV and Mexican wireless units, were 17.7 billion in 2017.With this release of 2018 broadband provider capital expenditures, USTelecom adjusts its estimate for AT&T’s2017 capital expenditures to reflect investments in FirstNet. FirstNet refers to a national public safetynetwork for which AT&T receives federal financial support through “reimbursements.” AT&T reports capitalexpenditures on its cash flow statement “net” of FirstNet capital reimbursements. To get total capitalexpenditures, USTelecom adds back FirstNet capital reimbursements. AT&T began reporting thereimbursements in mid-2018, including 279 million for 2017. After adding this amount, USTelecom’s estimatefor AT&T’s 2017 capital expenditures, excluding DirecTV and Mexican wireless units, increases from 17.7billion to 18.0 billion.2018 AT&T EstimateFor 2018, AT&T reported capital expenditures, including capitalized interest, of 21.3 billion, net of FirstNetreimbursements. It also reported 1.4 billion in FirstNet capital reimbursements, for a total of 22.7 billion.For consistency with historical periods, USTelecom excluded capital expenditures for newly acquired WarnerMedia, DirecTV, and the Mexican cellular unit.Pursuant to new reporting practices adopted after the Warner Media acquisition in mid-2018, AT&T broke out2018 capital expenditures for certain business segments. As a result, USTelecom needed to make fewerestimates. For 2018, it was possible to back out capital expenditures directly for Warner Media ( 581 million)and the International business segment ( 745 million, including DirecTV’s Latin American operations and theMexican cellular unit). USTelecom still had to make an estimate for DirecTV’s U.S. operations. DirecTV capitalspending had been trending down from 3 billion per year around the time of the acquisition to 2.5 billion in2017. Due to continued subscriber losses and migration to streaming services, USTelecom believes that thetrend continued downward in 2018. Based on this trend, historical analysis of DirecTV’s Latin American andU.S. operations, and the data AT&T provided for the International segment in 2018, USTelecom backed out an7
USTelecom Research BriefJuly 31, 2019estimated 1 billion of capital expenditures for DirecTV U.S. in 2018. In all, USTelecom backed out 2.4 billionin capital expenditures and capitalized interest from AT&T’s gross 2018 capital expenditures of 22.7 billion,yielding an estimated 20.3 billion in capital expenditures for 2018, excluding Warner Media, DirecTV, and theMexican wireless unit.Independent Competitive Provider Mergers and Historical RevisionsUSTelecom must estimate capital expenditures for the independent competitive provider industry becausemany of these providers are private companies that do not disclose financial data. USTelecom estimatedindependent competitive providers’ capital expenditures were 4.5 billion in 2018, down from 4.6 billion in2017 and 5.2 billion in 2016. For consistent historical comparisons in the years shown, these figures excludecapital expenditures for certain providers who were acquired and who are now included in line items for theacquiring companies. Specifically, the figures exclude Broadview and Earthlink (acquired by Windstream in2017), Level 3 (acquired by CenturyLink in 2017), and XO (acquired by Verizon in 2017).The competitive provider industry is changing rapidly and has undergone significant consolidation in the lastcouple of years. In addition to the mergers cited above, in 2017, Crown Castle acquired Lightower and Zayoacquired Electric Lightwave. In 2018, Fusion Connect acquired Birch and Megapath. Other independentcompetitive providers have gone private. For example, a private equity firm acquired previously public Lumosin 2017, then acquired privately held Spirit Communications in 2018 and merged the two. In 2019, Zayoannounced plans to go private. Meanwhile, TPx announced in early 2019 its plans to go public through abusiness combination with Pensare, but has since terminated the business combination.The independent competitive provider figures also exclude former cable over-builders such as WOW-Knologyand RCN-Grande, since USTelecom accounts for these companies in the cable line item. USTelecom removedthese companies from the independent competitive provider line item for current and historical periods in2016. See Chart 4.Miscellaneous Historical Revisions and Other Estimates.For cable, USTelecom reported 20 billion in 2017. USTelecom revises its cable capital expenditures estimatefor 2017 from 20.0 billion to 20.2 billion, due to availability of more detailed data. For 2018, USTelecomincludes estimated cable capital expenditures of 20.8 billion. The cable figures includes the former cableover-builders such as WOW-Knology and RCN-Grande.Sprint made minor historical revisions to its data, resulting in an increase in reported capital expenditures of 40 million for 2017.Starting with the 2017 series, USTelecom removed CyrusOne capital expenditures from the data series forcurrent and historical periods. There are no related changes in 2018. For a detailed discussion, seeUSTelecom’s October 18, 2018 research brief and Chart 4.In the 2018 data series, USTelecom revises historical data for TDS and US Cellular to include corporate capitalexpenditures and to correct historical errors. The changes are immaterial for all years except 1996-1998 and8
USTelecom Research BriefJuly 31, 2019therefore USTelecom does not show them in Chart 4. The impact in 1996-1998, ranging from 0.2 billion to 0.3 billion per year, does not materially affect the reported figures or trends since total capital expendituresin those years ranged from 55 billion to 72 billion.Discontinuance of Wireline and Wireless Breakout and Impact on Historical SeriesStarting with the release of 2016 broadband provider capital expenditures series, USTelecom discontinuedpublishing breakouts of wireline and wireless capital spending. There are several reasons it no longer makessense to report this breakout. First, the line between wireline and wireless investment is blurring as a growingportion of wireline investment supports either dedicated wireless backhaul or transport infrastructure sharedby wireline and wireless access networks. Meanwhile, devices increasingly shift between wireless and wirelinenetworks. Second, a major company, AT&T, stopped breaking out wireline and wireless capital expendituresas of the second half of 2015. USTelecom attempted to allocate AT&T’s capital expenditures to wireline andwireless for the full-year 2015; but such estimated allocations became increasingly imprecise, with potentialfor error. Third, another large company, Verizon, reports capital expenditures in categories for wireline,wireless, and “other.” USTelecom historically allocated “other” capex between wireline and wirelesscategories. As Verizon has acquired digital media and other services not fitting into wireless and wirelinecategories, the “other" category has grown quickly. Allocating Verizon’s “other” capital investment to wirelineand wireless categories adds to the growing imprecision in these categories. Starting with the 2017 capitalexpenditures series, USTelecom no longer allocates Verizon's "other" capital expenditures to wireless andwireline categories, but rather maintains a separate “other” category. USTelecom applies this changeretroactively to historical data reported by Verizon, but it has no impact on Verizon's total annual capitalexpenditures included in the series.Given the blurring of lines between wireline and wireless investment, as well as the disproportionate impactof AT&T and Verizon, which historically have represented approximately two-thirds of wireless capitalexpenditures and one-half or more of wireline telecom capital expenditures, USTelecom has discontinuedseparately reporting aggregates of wireless and wireline capital expenditures.Despite the imprecision, USTelecom does continue to track estimates for wireline and wireless capitalspending internally. USTelecom historically used these breakouts to estimate capital expenditures for nonreporting wireless providers and incumbent local exchange carriers (ILECs). While breakouts are imprecise,they continue to be the most practical means of estimating certain non-reporting providers’ capitalexpenditures. However, under this method, the removal of Verizon’s “other” spending from the wireless andwireline categories resulted in minor revisions to historical estimates for non-reporting wireless companies.See Chart 4. There was no impact on historical estimates for non-reporting ILECs.9
USTelecom Research BriefJuly 31, 2019Chart 4Adjustments to USTelecom Broadband Provider Capital Expenditure Estimates 2015-2018USTelecom Estimated Broadband Provider CapitalInvestment(Wireline, Wireless, and Cable, Billions)2010201120122013201420152015 SeriesSeries Before Handest AdjustmentLess Sprint Capitalized HandsetsFinal 2015 Series After Handset AdjustmentNew 2016 AdustmentsCable / CLECCable Data Series RevisionEliminiate Duplication in CLEC and Cable Line ItemsWindstreamARRA Stimulus ExpansionCAF I ExpansionData RevisionUniti (CS&L) REIT 740.04420102016 SeriesSeries Before Handest AdjustmentLess Sprint Capitalized HandsetsFinal 2016 Series After Handset AdjustmentNew 2017 AdustmentsAT&T Mexican Wireless Capex AccelerationOther Wireless AdjustmentCLEC Adjustments for New InformationLess .1)0.320102017 SeriesSeries Before Handset AdjustmentLess Sprint Capitalized HandsetsFinal 2017 2.1)74.8New 2018 AdjustmentsSprint Capital
Skyline Marketing Capex Report 2010, data from the Cellular Telecommunications & Internet Association (CTIA), and New Paradigm Resources Group. Cable data are from NCTA - The Internet & Television Association. Technical Notes It has been necessary to adjust certain reported capital expenditures, particularly since 2014, to ensure that