Transcription
T able au vsQlikVie w vs Powe r B I
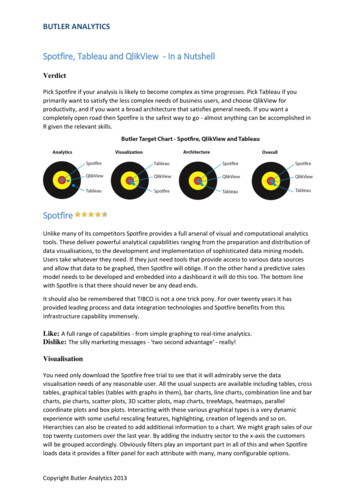
Tableau vs QlikView vs Power BIIf you’re evaluating Tableau vs QlikView vs MicrosoftPower BI, read on. We highlight the key pros and consof each and include a comprehensive businessintelligence software leaderboard showing how eachstacks up across 20 key business and functionalrequirements.Tableau SoftwareTableau Software leads the industry in datavisualization software, and in Version 10, the companyis investing heavily in advanced data federated,clustering, segmentation and more powerful analyticsfunctions. The user-friendly interface allows nontechnical users to quickly and easily createcustomized dashboards to provide insight to a broadspectrum of business information. Tableau canconnect to nearly any data repository, ranging fromMS Excel to Hadoop clusters.The drag-and-drop capabilities of the solution, pairedwith its extensive data source connections, makeTableau a front-runner in the realm of datavisualizations. And in the latest release, the company’scommitment to providing a roadmap to enterprisesthat reflect their urgent analytics requirements isevident in the enhancements to data federation,streamlined interfaces to advanced analytics routines,and improvements to mobile exploration andauthoring.Click to view reportSelectHub BI Software Comparison
Tableau vs QlikView vs Power BITableau Version 10 rst introduced in August 2016with the latest release (10.1.3) on December 28th,2016 re ects the requirements of large-scaleenterprises who have requested advanced featuresfound on Microsoft Power BI and other enterprisegrade analytics platforms. Tableau has added in datafederation that scales across their platform, enhancedmobility support including enhancements forresponsive mobile app design and development, andstreamlined workflows for advanced analytics.Tableau’s roadmap now re ects the needs oforganizations that want to move beyond the datavisualization aspects of their applications and getmore advanced analytics work done. Support for morecomplex data federation work ows, making datamashups more reusable and making improvements tomobile app development to support all mobile screensizes is now available in Version 10.Tableau has also provided a streamlined user interfacethat makes advanced analytics for segmentation anddata clustering possible. Tableau’s roadmap re ectsthe company’s e orts to move beyond datavisualization to more advanced analytics. Included aspart of this focus on broader analytics support areimprovements to self-service data preparation, morecontrol over data governance and metadatamanagement, additions to embedded advancedanalytics. Tableau has also included support forpublishing analytic content on a variety of publishingplatforms.Additional improvements in Tableau 10 includeimproved support for REST APIs and JavaScript, makingintegration across analytics platforms more e cientand less requiring of customized programming.Tableau is also adding new features to its interactivevisual exploration functions, in addition to opening updata source integration to a broad range of relationaldatabases, Hadoop distributions, NoSQL and supportfor IBM SPSS, SAS and open source R data les is alsonow included in the standard product. There is also aWeb Connector in Version 10 that supportsintegration to Marketo, SQL, and other enterprisesystems.Often, potential users wonder what the di erence isbetween Tableau Desktop, Tableau Online, andTableauServer.Simplyput, D e s k t o p isused for creating and formatting reports/charts andpublishing them into a dashboard. Server shares thedashboards. Tableau Online is their cloud-based BIsolution.Comparing Tableau vs QlikViewQlik’s reputation for developing enterprise-levelproducts that deliver excellent customer experiencesis accelerating as QlikView continues to attract newcustomers to the company and extend Qlik’s marketgrowth. Qlik Sense continues to be the company’s leadproduct, further strengthening their market positionin the data discovery, stand-alone and embeddedanalytics markets. Over the year, Qlik has also grownits global partner network, which is also acceleratingQlik’s overall market adoption.SelectHub BI Software Comparison
Tableau vs Qlikview vs Power BIQlik’s product strengths include an in-memory enginecapable of visualizing patterns and producingassociative analytics that isn’t achievable using SQLalone. The in-memory engine is scalable enough tointegrate with many di erent types of data sources,creating a uni ed dashboard show analytics, metricsand key performance indicators (KPIs) of interest.Many of Qlik’s enterprise customers say QlikView andQlik Sense are easy to use and their dashboards andintuitive and easy to understand. A few are usingNPrinting for reporting and have had good results.Enterprise Data Management Components – Qlik’sarchitecture has been designed to support selfcontained ETL and data storage, making this series offeatures a strength versus Tableau. Both Qlik andTableau are evenly matched on self-service datapreparation, an area both companies have publiclystated they are investing a signi cant amount of theirR&D budgets in this year. Both Qlik and Tableau arealso evenly matched on metadata management, anarea both have designed into the core components oftheir applications and data platforms.Tableau and Qlik are comparable and share many ofthe same strengths and weaknesses. The following isan analysis of how each compares:Features That Support Publishing Findings – Qlik ismore advanced than Tableau at embedding analyticcontent, while Tableau has the edge when it comes toembedding advanced analytics content across allplatforms. Qlik has a more streamlined approach topublishing, sharing and collaborating with data thanTableau. Qlik’s emphasis on delivering an excellentuser experience is what makes them a strongercontender in this area.Analysis and Content Creation – Tableau excels atadvanced embedded analytics, and is a solid leader inthe analytics and BI market on this feature. Qlik lagsbehind Tableau on this aspect of embedded analytics.Bot h Qlik and Tableau are evenly matched on theirsupport for SmartData Discovery as well. Overall,however, Tableau dominates the analysis and contentcreation feature set comparison of these twocompanies.Tableau’s depth of expertise and feature richness areevident in how advanced their interactive visualexploration, analytics dashboards and support formobile-based exploration and authoring are. Analyticssupported across visual exploration, dashboards andsupporting with mobile authoring all reside in thecloud, providing enterprises with exibility in reportingand analysis.Support For Infrastructure Components – regardingadministrative tasks, security, and architecture, Qlikhas the lead over Tableau. Qlik’s infrastructure isdesigned to scale in enterprises more e ciently byproviding IT with the needed support, tools and ifneeded, partner support, to get up and running fast.On infrastructure integration, Tableau has a slightedge given the popularity, stability and overallmaturity of its APIs. Qlik also has extensive integrationoptions and expertise, yet Tableau has been able tocapitalize on their market momentum and gain moreintegration partners and support. Cloud BI is also acomponent of infrastructure, and both Tableau andQlik are comparable on this feature.SelectHub BI Software Comparison
Tableau vs Qlikview vs Power BIBot t om line : Qlik and Tableau are well-matched onall aspects of analytics and BI, with Tableau having theedge on platform work integration and ease of use andvisual appeal.For enterprises that rely on a wide varietyof data integration points, Qlik has the edge given thedepth and breadth of its options in this area.Analysis and Content Creation – Tableau’s expertise inthese areas of analytics and BI applicationdevelopment are evident in how advanced theirembedded advanced analytics are relative to Power BI.Tableau is a generation ahead of many competitors inthe fields of advanced embedded analytics.ComparingTableauAlso, Tableau is superior to Microsoft Power BI when itcomes to creating and keeping real-time dashboardscurrent with real-time data integration. MicrosoftPower BI and Tableau are comparable on interactivevisualexploration and mobile exploration andauthoring.PowerBIvsWhen comparing Power BI vs. Tableau, Microsoftcontinues to emphasize ease of use and price whencompeting against Tableau. Conversations withenterprise buyers indicate Microsoft is pricing Power BIat nearly one-third the license cost of a typical threeyear BI license and is also o ering one of the lowestsubscription pricing programs in the market today.The Power BI Suite is delivered on the Microsoft AzureCloud platform, with the Power BI Desktop providedon-premise as a stand-alone option.Microsoft Power BI Desktop is also popular with powerusers who are creating complex data analyses thatinclude premise-based data sources and integrationpoints. Data Prep, data discovery, and interactivedashboards are all included in the Power BI Suite andPower BI Desktop.Tableau and Microsoft Power BI are both consideredsuperior at intuitive design and ease of use, withMicrosoft having an edge on infrastructure supportand components, and Tableau being the leader onease of use. The following is an analysis of how eachcompares:Enterprise Data Management Components – Tableauand Microsoft Power BI are comparable on the threecore areas of enterprise data management. Bothprovide above-average self-contained ETL and datastorage,andbothprovide self-service datapreparation. Microsoft Power BI’s strength in selfservice data preparation is evident in how the userexperience is designed to guide novice users yetprovide power users with the tools they need toc om pl e t e data presentation tasks quickly. BothTableau and Microsoft Power BI are evenly matched inthe area of metadata management as well.Features That Support Publishing Findings – MicrosoftPower BI’s ability to embed analytics content issuperior to Tableau and is used pervasively in businessanalytics and BI reporting work ows across enterprises.Tableau has more e ective features for publishing,sharing and collaborating with visualizations and dataanalysis completed.SelectHub BI Software Comparison
Tableau vs Qlikview vs Power BISupport For Infrastructure Components – MicrosoftPower BI is superior to Tableau when it comes to datasource connectivity given Microsoft’s API and WebService expertise on Azure Cloud and on-premisesintegration options. Based on conversations withenterprise users, Microsoft’s Power BI Azure instancesupport is exceptionally fast and also consideredbetter than Tableau’s cloud BI support.Microsoft’s extensive administration, security andinfrastructure support is also exceptional.OnlyOracle, SAP, SAS and Domo meet or exceed the depthof support Microsoft has on these infrastructurecomponents. Overall, Microsoft Power BI has a moredominant infrastructure platform than Tableau.Bot t om line: Tableau excels at providing a highlyinteractive, intuitive series of visualization tools anddashboard options that capitalize on the strong baseof data connectors the company has created over thelast two years. Microsoft’s leadership position oninfrastructure components including administration,security, and architecture is understandable givenMicrosoft Power BI being o ered on the Azure CloudPlatform and on-premise.QlikViewQlik relies on sophisticated analytics that enables datadiscovery using an in-memory engine to analyze datafor patterns not visible via SQL data structures orqueries. The company’s two most popular apps areQlikView and Qlik Sense. Both of these apps are oftenused in core business areas including sales, marketing,operations, service and the most common areas ofanalytics use in organizations, accounting, and finance.Qlik has one of the most advanced ApplicationProgramming Interface (API) command sets in theanalytics industry and has continually been improvingits functionality over the last several years. With manyenterprises requesting API support, Qlik has alsoprovided APIs to control functions previouslyaccessible only through the user interface. The resulthas been rapid adoption of the Qlik Analytics Platform(QAP), which is being used today by developers toembed analytics queries into reporting and analyticsapps.Qlik is looking to create a scalable, API-driven platformthat gives content developers and line-of-businessanalysts a more rapid approach to de ning, executingand saving queries.QlikView, QlikSense, and QAP have arding. Because of this, customers can getgreater use out of the in-memory engine that iscapable of handling complex data sources andapplications. In many respects, Qlik’s platform isstarting to evolve into a viable option for data martand data warehouse integration. Add to this theirextensive partner network of more than 1,700software companies across multiple geographies, andit’s clear Qlik is a viable enterprise analytics platform.In addition to the above strengths, the speed at whichQlikView can provide data insights using it’s powerfulin-memory analytics capabilities is gaining newenterprise accounts for the company. QlikView alsoo ers a powerful reporting engine, which o ers dataanalysis beyond visual dashboards. One additionalbene t is that QlikView can plug into almost any datasource, making it the most versatile of the modernintelligence tool offerings.SelectHub BI Software Comparison
Tableau vs Qlikview vs Power BIQlikView has a reputation for having a somewhat steeplearning curve the company has worked hard toaddress in the current release. The vast range ofQlikView’s BI tools can be learned quickly using theironline tutorials and learning systems. The productcomes bundled with numerous tutorials, how-toguides, and other self-help resources. If you want tocompare Qlikview vs Tableau, don’t forget our side-byside comparison report.Enterprise Data Management Components – Qlikdominates the market with its self-contained ETL anddata storage capabilities, outdistancing Microsoft onthis aspect of data management. Qlik is one of thebest vendors providing analytics and BI solutions todaywith SiSense being the only other vendor at this levelof performance.QlikView vs Power BIQlik and Microsoft are evenly matched on self-servicedata preparation and embedded advanced analytics.Microsoft has more expertise delivering embeddedadvanced analytics, but Qlik is gaining momentum inthis area due to its focus on usability and deliveringgreater customer experiences in their products.Qlik continues to invest heavily in intuitive, easy-touse product features and work ows, which is asigni cant competitive advantage versus MicrosoftPower BI. Qlik’s embedded analytics capability issuperior to Microsoft Power BI as well. QlikView andMicrosoft Power BI are comparable and share many ofthe same strengths and weaknesses. The following isan analysis of how each compares:Features That Support Publishing Findings – With thegoals of providing the best usability possible andexcelling at delivering intuitive, easy to useapplications, Qlik dominates this area of features. Qlikguides users through how to embed analytic contentand according to enterprise users are more intuitive touse compared to Microsoft.Analysis and Content Creation – Microsoft dominatesthis area of the comparison with their greateststrengths being interactive visual exploration andmobile exploration and authoring. Microsoft has acommanding lead from a feature perspective in eachof these two years. Both Qlik and Microsoft Power BIalso support embedded advanced analytics, withMicrosoft having delivered proven results toenterprises with this feature in use by businessanalysts globally.Microsoft Power BI also is more effective at SmartDataRecovery when compared with Qlik’s products. Qlikand Microsoft Power BI are evenly matched onsupport for advanced analytics dashboards.Qlik is also the superior solutions for publishing,sharing and collaborating using content as well. Basedon personal experiences using each and fromconversations with business analysts at enterpriseswho have adopted each, it’s clear that Qlik has acommanding lead in this area.Support For Infrastructure Components – WithMicrosoft generating a signi cant amount of revenuefrom infrastructure and platform platforms, it’s areasonable assumption that Microsoft Power BI woulddominate this highly competitive area of analytics andBI applications. In reality, many competitors have justas good if not better infrastructure applications andtools compared to Microsoft.SelectHub BI Software Comparison
Tableau vs Qlikview vs Power BIQlik is at a competitive parity with Microsoft in theareas of administration, security, and architecture.Microsoft has a slight lead over Qlik in the area of datasource connectivity, and Microsoft leads on the CloudBI feature set due to its depth of expertise onMicrosoft Azure to Power BI support to the platformlevel.Bottom line: Microsoft Power BI has greater platformwork ow integrations, more advanced platformsupport for Cloud BI due to its depth of expertise onAzxure, and has an easy to use interface. Due to thesethree factors, Microsoft Power BI is superior to Qlik.With a core competitive strength in usability andapplication design, Qlik needs to build out its platformstrategy while strengthening its SmartData Discoveryand Embedded Advanced Analytics feature sets.Microsoft Power BIMicrosoft Power BI o ers one of the lowest per-userpricing options to companies looking for cloud-basedanalytics and business intelligence (BI) apps.Companies selecting Microsoft Power BI do sobecause of the low Total Cost Of Ownership (TCO),ease of use, and availability of skilled resources.In addition to these advantages, the Microsoft PowerBI roadmap has made good on the promises toenterprise customers to deliver data preparation, datadiscovery and data dashboards in the most recentrelease. Microsoft also continues to support the rstExcel-based add-ons that were initially shipped inPower Query, Power Pivot, Power View and Power Map.Microsoft has said these Excel add-ons will stay in theproduct for the foreseeable future as they becomenative3 in O cer 2016. One of the more innovativefeatures of Microsoft Power BI is the ability to usebrowser- and desktop-based authoring with apps andplatforms that are both on-premise and in the cloud.This hybrid integration strategy is based on MicrosoftAzure Cloud APIs.Microsoft is very focused on being the leader inanalytics and BI from a TCO standpoint. Companiesinterested in licensing and using Microsoft Power BIcan access the platform for as little as 9.95 per userper month.As of January 2017, Microsoft is o ering a featurelimited version of Power BI to individuals for free thatincludes 1GB per user of data storage, daily scheduleddata refresh and 10K rows per hour streaming data. Asof today, Microsoft claims to have over 100,000organizations running Power BI today globally. If youwant to know how older components like Power View,PowerPivot compared to Power BI, here’s a usefulcomparison.In conjunction with other Microsoft o erings, includingAzure, SQL Server Analysis, real-time data streaming,and R-analytics, Power BI provides a broad analyticlandscape. As of early 2016 Power BI does not provideextensive analytics or visualizations, but the platformis rapidly being enhanced. So if you are in it for thelong-haul, Power BI may prove to be a goodinvestment.SelectHub BI Software Comparison
Tableau vs QlikView vs Power BISummaryTableau, QlikView, and Power BI are all solid businessintelligence tools. Which one is the best t for yourcompany depends on your analysis needs. If you’reconnecting to existing internal databases, datawarehouses and other data sources are critical to youroperations; you must individually analyze ti
Tableau Server. Simply put, Desktop is used for creating and formatting reports/charts and publishing them into a dashboard. Server shares the dashboards. Tableau Online is their cloud-based BI solution. Comparing Tableau vs QlikView Qlik’s reputation for developing enterprise-l
