Transcription
1996 National Heat Transfer ConferenceInstrumentation and Measurements SymposiumAugust 34,1996, Houston, TX SAND96-XxXXCPsrs-PRESSURE EFFECTS ON BUBBLE-COLUMN FLOWCHARACTERISTICSL-[.z m,D. R. Adkins, K. A Shollenberger, T. J. O'Hern, and J. R. Torczynski 'Engineering Sciences CenterSandia National LaboratoriesAlbuquerque, NM 87185 "'-';ABSTRACTBubble-column reactors are used in the chemical processing industry for two-phaseand three-phase chemical reactions. Hydrodynamic effects must be considered whenattempting to scde these reactors to sizes of industrial interest, and diagnostics are neededto acquire data for the validation of multiphase scaling predictions. This paper discussesthe use of differential pressure (DP) and gamma-densitometry tomography (GDT)measurements to ascertain the gas distribution in a two-phase bubble column reactor.Tests were performed on an industrial scale reactor (3-m tall, 0.48-m inside diameter)using a 5-Curie cesium-137 source with a sodium-iodide scintillation detector. GDTresults provide information on the time-averaged cross-sectional distribution of gas in theliquid, and DP measurements provide information on the time and volume averaged axialdistribution of gas. Close agreement was observed between the two methods of measuringthe gas distribution in the bubble column. The results clearly show that, for a fixedvolumetric flowrate through the reactor, increasing the system pressure leads to anincrease in the gas volume fiaction or "gas holdup" in the liquid. It is also shown fiom thiswork that GDT can provide useful diagnostic information on industrial scale bubblecolumn reactors.NOMENCLATUREa0 constant term of w(r,R) curve fit (nondimensional)al quadratic term of w(r,R) curve fit (nondimensional)bo constant term of W(x,R)curve fit (nondimensional)b, quadratic term of t, x,R) curve fit (nondimensional)g gravitational acceleration ( d s 2 )ug superficial gas velocity ( d s )r radial location (m)ui superficial liquid velocity ( d s )x cross-section location of gamma trace (m)z axial location (m)D column inner diameter, D 2R (m)I gamma intensity (photonds)I, incident intensity (photonds)', ,,,[ - - d
-aL length(m)N gamma photon count (nondimensional)P pressure (Pa)R column inner radius (m)dp liquid minus gas density (kg/m3) g gas volume fraction (m3/m3)p attenuation coefficient (m-')w normalized attenuation coefficient (nondimensional)p density (kg/m3)c liquid surface tension (N/m)T detector time constant (s)INTRODUCTIONBubble-column reactors are used in the synthesis of many important chemicalcompounds. In the Fischer-Tropsch process, for example, a mixture of H2 and C02 fromcoal gasification is bubbled up through a catalyst-laden liquid hydrocarbon for theproduction of liquid fuels. The distribution of gas and solids within the liquid has a majorimpact on the efficiency of the process. As gas flowrates are boosted to increaseproduction, the bouancy-driven hydrodynamics can cause a poor spatial distribution of gasbubbles and lower conversion rates.Most reactor systems are required to operate at high pressures, and the influenceof the pressure on the hydrodynamicsis of particular interest. In a study of bubbleformation from a single orifice, LaNauze and Harris [19741 found that for a given gasflowrate, an increase in system pressure causes smaller, but more frequent, bubbles to beformed. They attribute this behavior to the increased contribution of the momentum of thegas to the bubble-formation process. Gas momentum imparts a greater upward force onthe bubble at higher pressures and causes the bubble to depart from the orifice sooner. Theincreased fiequency of bubble formation was found to cause more coalescence andinteraction of the bubbles departing from the orifice. For a fixed volumetric gas flowrate(determined at the system pressure), the volume of individual bubbles decreased by at leasta factor of two as the pressure increased from one to ten atmospheres. Above tenatmospheres, LaNauze and Harris observed that the bubble volume remained relativelyconstant with fbrther pressure increases. They also found that increasing the flowrate at afixed pressure caused the bubble volume to increase. At atmospheric pressure, the bubblevolume increased linearly with gas flowrate, but as the system pressure increases, thevolume of individual bubbles was increasingly less influenced by the gas flowrate. Theoriesthat were developed by Davidson and Schuler [1960] and later extended by LaNauze andHarris demonstrated fairly good correlation with experimental results in these earlierworks.While studies on single-orifice systems provide some insights on the relationshipsbetween operating pressures, flowrates and bubble sizes, the bubble formationhydrodynamics become much more complicated in systems with multiple gas injectionpoints (such as spargers). The crossflow of liquid that develops during bubble formation at
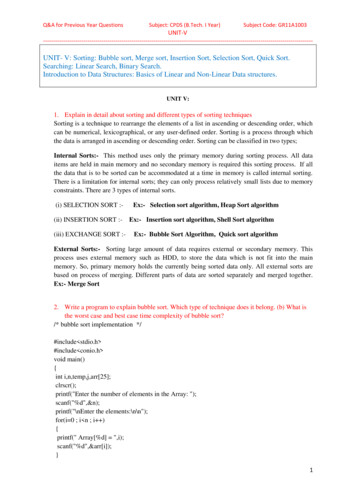
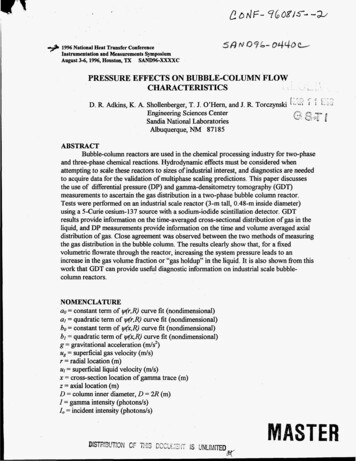
?one orifice can influence the departure of bubbles at adjacent orifices. In addition, bubbleinduced pressure fluctuations in the gas plenum of the sparger are coupled to theformation and departure of bubbles. This paper is focused on studying the bulkhydrodynamics of the system rather than on the development and subsequent evolution ofindividual bubbles.To understand the influence of operating and design parameters on thehydrodynamicsof the bubble column, it is necessary to have diagnostic capabilities tomeasure the spatial distribution of gas in the bubble-column reactors. Gammadensitometry tomography (GDT) is one method of measuring gas holdup (gas volumefraction) distributions in multiphase flows. Brown et al. [19931and Reda et al. [19811discuss applying GDT to liquid saturation of porous media, and Kumar et al. [19953recently published an extensive review of GDT applied to multiphase flow systems. Thebasic premise of GDT is that gamma photons are attenuated by scattering and absorptionas they pass thrqugh matter. The attenuation is a hnction only of the energy of thegamma photon and the attenuation coefficient, p, of the material. If the incident gammabeam has an intensity I, (in counts per second), then the intensity after passing through amaterial of length L will be I I, exp(-,uL). For a multiphase mixture, the attenuationcoefficient is the sum of the products of the volume fractions of the phases with theirattenuation coefficients. Thus, by measuring the ratio I/I, the average attenuationcoefficient along path L can be determined. A tomographic reconstruction of theattenuation coefficient, and therefore the phase distribution, can be made usinginformation from multiple scans through the test object. Photon emission from the gammasource fluctuates as a Poisson process and the uncertainty in the intensity measurement isrelated to (l/N)'" where N is the number of photons. To obtain a count that is highenough to give meaningful results, the attenuation will by necessity be a time-averagedresult along the path L. With this time-averaged attenuation coefficient, the gasdistribution within the column of liquid can be determined.SYSTEM DESCRIPTIONThe industrial-scale bubble column that was used in these experiments is shown inFigure 1. The stainless steel vessel is 3 m tall and has a 0.48-minside diameter with a wallthickness of 1.27 cm. Instrumentation and view ports were placed in six axial locations0.48 m apart. Differential pressure transducers were installed in each of these locations tomeasure pressures along the column. Air is injected into a liquid-filled column through asparger located near the bottom of the vessel. The sparger is a 15-cm diameter ringformed from 1.1-cm ID stainless steel tubing. Twelve holes, 3.18 mm in diameter, are inthe top surface of the sparger ring. To date, superficial gas velocities of up to 0.40 d shave been produced in the system with a corresponding gas volume fraction or "gasholdup" of 40 %. The flowrate of the gas is measured with an orifice-plate flowmeter toan accuracy of 1.7 %.A portable GDT system is used to measure the gas volume fraction within thecolumn. Gamma photons from a 5-Curie cesium-137 source are collimated through a6.35-mm ID tube, projected through the test object and onto a sodium-iodide
photomultiplier tube (PMT). The PMT gamma detector is located in a lead shield with a6.36-mm ID collimating tube that photons must pass through to reach the detector. Thesource and the detector are mounted on a heavy duty traverse system that can translate 60cm vertically (along the axis of the column) and 60 cm horizontally. Both the step size andthe dwell time of the traverse system can be selected to facilitate data acquisition.Signals fiom the PMT pass through a preamplier and are then relayed to aspectrum amplifier. The spectrum amplifier generates a pulse with a peak that isproportional to energy of each photon the PMT detects. The output fiom the spectrumamplifier goes to a single channel analyzer (SCA) that selects a narrow window of pulseamplitude centered about the 661.6 keV cesium-137 energy peak. It is possible with thesystem to count pulses fiom the SCA over a selected time period or, alternatively, tomeasure the time required for a selected number of pulses to be counted. This lastalternative was chosen for the current series of tests, so the number of detected countsremains constant for each source/detectorlocation. The GDT system is also equipped witha multichannel analyzer that measures the count rate for a series of differential energybands across the energy spectrum. For the series of tests reported here, the multichannelanalyzer was used to calibrate the window settings on the SCA.In addition to the GDT system, the column was also equipped with differentialpressure transducers at the six instrumentationports along the length of the bubblecolumn. Variable reluctance differential pressure transducers manufactured by Validyne(Model DP 15) were selected for this application. A pickup coil in the Validyne transducermeasures the displacement of a diaphragm to determine the pressure. Diaphragms areselected for the desired pressure range. One side of each differential pressure transducerwas connected to an instrumentationport along the column, and the other side wasplumbed through a manifold to the air space at the top of the bubble column. The gaugepressure at the top and upstream of the column were also measured with Validynedifferential pressure transducers. Differential pressure transducers along the column had amaximum span of 34 kPa (5 psi) with an accuracy of 0.65 H a . The gauge pressure at thetop of the column had a maximum span of 552 kPa (80 psi) with an accuracy of OX%of full scale.
regulatorN2 or airliquidrecirculationand heatertankorificeplatepneumaticflow controlvalve1preheaterIFigure 1. Configuration of the industrial-scale bubble column reactor. The column is 3 mtall and has a 0.48-mID.
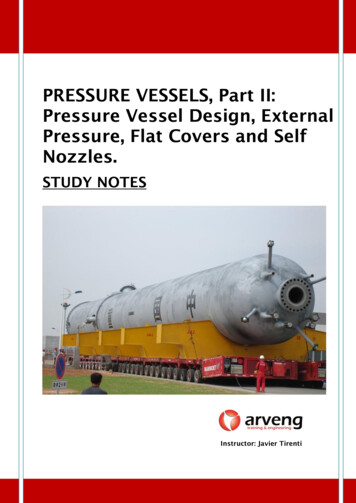
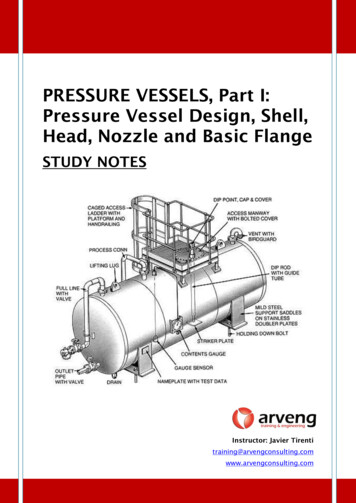
RECONSTRUCTION TECHNIQUESTomographic reconstruction techniques are discussed in detail elsewhere merman,1983, and Howard, 19851, and a more in-depth description of the algorithm used for oursystem is provided by Torczynski et al. [1996]. For the work presented here, it wasassumed that the time-averaged flow in the column is axisymmetric. This assumptionappears to be reasonable since the attenuation data from horizontal scans across thecolumn were found to be relatively symmetric. Figure 2 shows the measured intensity (orgamma count rate) as a fbnction of horizontal location for a fixed axial (vertical) locationalong the column. Results shown are for three cases; (1) an air-filled column, (2) a waterfilled column, and (3) a water-filled column with a superficial gas velocity of 0.086d s .When the tank is empty, the count rate is high enough that the system is unable to countall of the gamma photons intercepted by the detector. The true count rate is estimatedusing the correlationwhere zis the time constant inherent to the detector and the counting electronics m o l l ,19791. The time constant was estimated by measuring count rates for a set of rectangularcalibration water tanks of known length and then inverting the data to solve for a value ofzthat gave the best fit. It was found that zwas on the order of 10 ps (or less), but thecorrection made little difference in the final estimate of the gas volume fiaction. Thecorrection would be much more important for a thinner-walled vessel where count ratesare higher.Tomographic reconstruction entails transforming the beam attenuation data alonglines intersecting the column into a measure of the radial distribution of the attenuationcorresponding to the time-averaged gas distribution. The first step in the tomographicreconstruction to determine the radial gas distribution in the bubble column is to normalizethe attenuation data by the difference in the attenuation of the full and empty tanks. Thenormalized attenuation, w, at each position, x,, is defined asFigure 3 shows the normalized attenuation coefficient for the data provided in Figure 2.Since the average gas volume distribution is assumed to be axisymmetric, it is possible torepresent the attenuation data with an even powered polynomial. A fit of the data set {(xz,v) is perfbrmed to form a function Hx7R) bo bl( 4?) .Coefficients bo and bl are thenused to determine the coefficients a0 and a1 of the corresponding radial variation of thenormalized attenuation coefficient, &r7R) ao a&d?)2. The Abel transform is used todetermine the relationship between the polynomial coefficients of the fbnctions &R) andry(r,R)within the domain of R.Torczynski et al. [19961provide a generalized expressionof this transform for higher order polynomials. For a quadratic fit, however, the
*.transformation simplifies to a0 bp61/2 and a1 3b1/2. The normalized attenuationcoefficient Hr,R) ranges from zero for an empty tank to a value of one for a full tank. In atwo-phase system, &r,R) corresponds to the liquid volume fraction in the column. Figure3 shows the quadratic fit of the attenuation coefficient along with the reconstructedprediction of the liquid volume fraction. The radial gas volume fraction distribution,& ,I?), is simply 1-Hr,R).The GDT results provide measurement of the time averaged gas volumedistribution in horizontal slices of the bubble column. To complement these results, thepressure measurements can yield a measurement of the volume averaged gas volumefraction along the length of the column. If shear forces along the walls of the column areneglected, then the pressure gradient along the column is hydrostatic and given by theexpressionwhere the sign, of course, indicates that the pressure decreases up the column. Pressuremeasurements at discrete locations can be used to obtain an estimate of @/&, and theresult can then be used to determine the average gas volume fraction for the section.20000-II8000 -0-06000 4000yc!II1\ EMPNTANK0----012000 -00--00-8000 --06000 -04000 2000 00AIR FLOW IN LIQUID0-I0I10IIIIII--003z10000- - 22I-II 0 6 w * 9 0 0IIII20304050SCAN LOCATION ON TANK (CM)-I60Figure 2. Gamma count rate vs. location for full and empty tank, and tank with air flow.Measurements were made along a horizontal path at an axial location two diameters (1 m)above the sparger.
0.5;s'ril0*40wc.-*000.3l- (r,R) 0.308- 0.194 (r/R)*2LQ)E-30.290.1VJrb((x,,l-?,b& experimental,T l-?,b(x,R):quadratic fit00.0-24 -20 -16 -12-8-404810 ps121620Radial Position r or Horizontal Position x (cm)24Figure 3. Reconstructed average gas distribution for an assumed axisymmetric profile.RESULTSThe bubble column was filled with water to give an effective LID of 4 (asmeasured from the top of the sparger). Air was injected into the tank at superficialvelocities ranging up to 0.16 d s , and the gas flow at the top of the column was regulatedto pressurize the tank. A large pressure drop in the exhaust line leaving the tank oftendominated the discharge pressure and limited the minimum operating pressure of thesystem. The system pressure referred to in the following discussion is the pressure at thetop of the tank in the gas-filled head space.Figure 4 shows the gas holdup along the length of the bubble column based ondifferential pressure measurements. The reported gas holdup represents a volumeaveraged gas volume fraction for each of the five regions between the pressuretransducers. Pressure data was collected at 100 Hz and then averaged over 25 seconds toobtain the pressure used in the gas holdup calculations. Measurements in the lower three.
regions show that, as the superficial gas velocity increases, the holdup increases, asexpected. There is no clear explanation for the somewhat lower gas holdup near themiddle of the tank. The relatively high gas volume fkactions in the top two regionsindicate that pressure transducers at 4.6 and 5.5 m are in air during most of the dataaveraging time. At higher gas velocities, liquid is lofted higher into the column, and thepressure transducers at 4.6 and 5.5 m become submerged. Based on these measurements,the top two regions of the bubble column contain a fiothy mixture with about a 40% gasvolume fraction when the superficial gas velocity exceeds about 0.13 d s .Results in Figure 4, which were taken at a headspace pressure of 165 kPa (24psig), can be compared with the results in Figure 5 for a 345 Wa (50 psig) headspacepressure. In general, the results are similar, but a careful examination shows that the gasholdup does increase with pressure for a given superficial velocity. Zuber and Findlay[1965] found that for churn-turbulent flows, the gas volume fraction can be correlated tothe superficial velocity through the expressionU1(1:)”” ,A Co(ug u, 153. ogAp pE,where ug is the superficial gas velocity and UIis the superficial liquid velocity which equalszero when the bubble column is in steady operation. The term u Eg is actually theinterstitial velocity of the bubbles traveling through the liquid, and the last term of theright-hand side of this equation is an empirical expression for the terminal rise velocity ofbubbles in churn-turbulent flow [Cheremisinoffand Gupta, 19831. The factor COis ah c t i o n of the operating pressure of the system.Figure 6 shows the measured gas holdup in the bubble column as a function ofsuperficial gas velocity at pressures ranging from about 2 to 4 atmospheres. Results fromZuber and Findlay’s model are also shown Figure 6 (COwas chosen to give the best fit tothe data). Gas holdup estimates were based on the differential pressure measurementsmade in the three lower regions of the column. The increase in gas holdup with pressure atany given superficial gas velocity indicates that the interstitial velocity of the bubblesdecreases with pressure. The data correlate well with Zuber and Findlay’s model which isshown as solid lines in Figure 6. The general decline of COwith pressure implies that thesuperficial velocity has a decreasing influence on the interstitial velocity as the systempressure increases.The observation that the interstitial velocity decreases with pressure coincides withLaNauze and Harris’s [1974] finding that, for a fixed gas flowrate, the bubble sizedecreases with system pressure. Bouyancy forces scale with the cube of the bubblediameter, and drag forces on the bubble scale with the square of the diameter. Bybalancing forces on the bubble, it follows that the interstitial velocity scales with thebubble diameter. The decrease in the interstitial velocity with an increase in pressuretherefore implies that the bubble size also has decreased with an increase in pressure.The radial distribution of the gas volume fraction at a location 0.96 m (L.2 2)above the sparger is shown in Figure 7 for several operating pressures and superficialgas
velocities. Gamma attenuation measurementswere made at 2-cm intervals across thecolumn to provide data for these GDT reconstructions. 20,000 gamma photon countswere detec
pressure transducers at the six instrumentation ports along the length of the bubble column. Variable reluctance differential pressure transducers manufactured by Validyne (Model DP 15) were selected for this application. A pickup coil in the Validyne transducer measures the displacement of a diaphragm t