Transcription
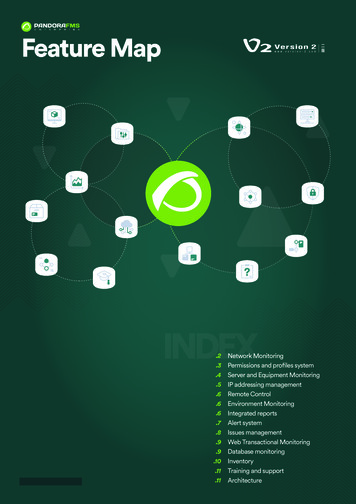
PA N D O R A F M S F E AT U R E S M A Ppandorafms.comFeature .9.10.11.11Network MonitoringPermissions and profiles systemServer and Equipment MonitoringIP addressing managementRemote ControlEnvironment MonitoringIntegrated reportsAlert systemIssues managementWeb Transactional MonitoringDatabase monitoringInventoryTraining and supportArchitecture
PA N D O R A F M S F E AT U R E S M A Ppandorafms.comNetwork monitoring featuresPAG2Download Free TrialTraffic monitoringThrough sFlow, NetFlow or JFlow method.Supports IPv4 and IPv6Supports IP versions IPv4 and IPv6.Discovered equipment featuresBrand, model and firmware are automatically specified.Equipment usageCPU, memory, disk and communication equipment bufferusage.Self-increase of test retries in case of failureIncreases checking attempts intervals in case of failure.Scheduled monitoringSchedules check-ups on specific dates and times.Use of physical and logical portsOpen and in-use physical and logical ports are shown forrouters and switches.Distribution of intermediate probes for informationcollectionAllows the use of intermediate probes to be able tomonitor the network in a distributed way.SSH Remote QueriesQueries Linux and Unix computers remotely, using remotecommands on SSH.Application server performanceVerifies OAS, JBoss, Tomcat, WebSphere, GlassFishservices and equivalents.Packet lossMonitors network interface packet loss.Possibility of high frequency pollingRates network monitoring times at intervals of minimumfrequency up to five seconds.Remote connection to network equipmentAllows remote connection to communications equipmentcentrally in the solution itself, through SSH or Telnet.Communication link performanceMonitoring network interfaces, bandwidth, consumption,maximum occupancy, availability, errors, discards, packetlosses, real speed, etc.Map and network diagram creationPresentations in active network diagrams. These networkdiagrams will be updated automatically with the newnetwork nodes, identifying new elements.Compatibility with SNMPCompatibility with the SNMP and ICMP standard forobtaining information from devices, for versions 1, 2, 2cand 3.WMI remote queriesChecks Windows computers remotely, using a WMIinterface to add your own WML statements.
PA N D O R A F M S F E AT U R E S M A PLog collection parallel to monitoring. No megabyte limit.Log collection via syslog (remote) and local agents (Linuxand Windows).Custom remote queriesAllows the tool administrator to define their own complex(multi-step) remote checks based on dialogue / responseover a TCP port.Relationship between network devices at networkand link levelIf the information is available, Pandora FMS is able toshow the relationships at network level and the link levelbetween the different ports of the routers / switches andthe connected equipment.Detection of active devices to monitorScans and generates monitoring information of physicaland virtual equipment, servers, workstations, routers,switches, firewalls, band- width administrators, loadbalancers, access point and printers.Traffic information detailThe information shows a history with a minimumgranularity of one minute and a history of several years.The graphics zoom in and keep the highest level of detail.Detection of active equipment for monitoringScan and generate monitoring information for physicaland virtual machines, servers, workstations, routers,switches, firewalls, bandwidth managers, load balancers,access points and printers.pandorafms.comLog and event collectionReal-time geographic maps (GIS)SNMP trap receivingShow the exact position of each device (GPS) and, if it isupdated, that movement is shown on the map. You cansave a movement history of each element and see it onthe map.Collects traps and alert assignments to these values.Collects numerical and / or alphanumeric values to enrichthe alerts with data obtained from traps: critical systemtemperature, name of the down interface, filesystem alert,critical-state memory / CPU, etc.Permissions and profiles systemPAG3Download Free TrialProfiling system according to groups and accessesDifferent users of the same group can perform differentfunctions.MultitenantWith the same solution you can give service to differentclients or groups without seeing each other.
PA N D O R A F M S F E AT U R E S M A PInternal auditIt reflects what operations each user has performed andwhen, including failed access attempts.Password Recovery SystemA solution is provided so that the user can recover aforgotten password.AuthenticationIt has its own system of users, profiles and roles, andsupports Active Directory, LDAP and SAML.Password PolicyAllows forcing a policy of password change, withpasswords of minimum length, special characters andhistory of old passwords.Dual authentication systemVia Google Auth or equivalent, uses a mobile or externalhardware device to perform a double authentication toenter the system.pandorafms.comServer and Equipment MonitoringPAG4Download Free TrialNetwork cardAvailability and charging by network card.Local corrective actionsThey run on agents, based on a given conditionOperation InformationFans and internal temperature.Operating System and general configurationDescribes operating systems and equipmentconfiguration.Screen monitoringAllows taking “screenshots” of the output of certaincommandsStorageAvailability, available space per partition and mountingpoints.Remote Agent ConfigurationIndividually or collectively for configuration bulk changes.New storage system hot detectionMonitoring new mounting points automatically.Execution of agents with users without privilegesSo that they cannot access inside information.Use of intermediate proxies to send informationIf agents cannot contact the central server.Service and Process WatchdogAllows restart in case of failure, and monitors itautomatically (Windows).Conditional monitoringAllows monitoring based on whether certain criteria aremet, evaluating it in each execution.
pandorafms.comPA N D O R A F M S F E AT U R E S M A PVirtual environmentsVMware, HypeErV, HPVM, RHEL VM, Nutanix,OpenNebula, IBM, HMC, LPAR, KVM and XenServermonitoring.Cluster monitoringValid for any manufacturer and any cluster model, A / P orA / A, and also for application or network clusters.Remote agent installationAllows distributing and installing agents unattended fromthe administration console; Windows and Linux systems.AgentsIt has the local and remote agent feature, so thatthe equipment can be monitored in both ways, asappropriate.Server hardware operationCPU, RAM, physical memory, virtual memory, ca- che andpaging are monitored. Open processes, zombies, swap,access to the environment, etc.Automatic agent provisionAgents are configured when contacting for the first timethe central server, and a configuration determined by aset of rules is applied.Support to different platformsIn 32-bit and 64-bit architectures, information is obtainedfrom Windows, Linux and Unix operating systems (Solaris,HP-UX, AIX), Mac OS X and BSD systems.Local data collection in case of disconnectionThe information will be stored locally if the networkfalls down, so that, when it can con- nect again with thecentral server, it sends the information for that period.IP addressing managementPAG5Download Free TrialAutomatic discoveryThe tool has IP detection in a subnet, checking theresponse of each IP, resolving hostname and operatingsystem.IP Administration (IPAM)The tool can configure, enable and disable each IPmanually, add events in the IP, comments for each IP,reserve IPs and monitor dynamically the use of networkIPs by network, subnet and supernet.Customizing IP viewsThe tool can filter and view different IP groups.Integrated IP with Microsoft DHCP ServermanagementThe IPAM system can be integrated with the Microsoftserver through local real-time data collection to refreshand update the status of IPs, including your reservation,lease and each IP lease time.
PA N D O R A F M S F E AT U R E S M A PSubnet calculator compatible with IPv4 and IPV6Remote ControlDownload Free TrialIntegrated into the software, without calling a third tool.Integrated in the interface. Compatible with Windows,Linux and Mac systems.Remote shellIntegrated in the tool Interactive access by shell to Linuxand Windows computers.Copy of bidirectional filesIntegrated in the main console of the tool, it allows theuser to access the remote filesystem to download, deleteand upload files from the PC.Process and service controlAllows starting, stopping and restarting remote processesand services of the managed machine.pandorafms.comComputer Remote DesktopEnvironment MonitoringDownload Free TrialUPSCompatibility with the main manufacturers.Air conditioningHistory of use and air conditioning sensors, generation ofreports and alarms.Access controlHistorical of access control to the computer center,generation of reports and alarms.IoT / SensorsPossibility of integration with different IoT systemsthrough direct connection (SNMP) or Rest API.Integrated reportsBAM monitoringPAG6It allows the following data: network (address andbit mask), network mask, network wildcard, networkaddress, broadcast address, first valid IP, last valid IP andnetwork IP number.Download Free TrialMonitors business processes in real time in a singleconsole (dashboard).
pandorafms.comPA N D O R A F M S F E AT U R E S M A PReportsReport scheduling allows filtering informa- tion in timeperiods, reporting equipment failures (falls), warnings,displaying descriptive problem statistics and simple orcombined graphs (multiseries).SLA ReportsDaily, weekly and monthly SLA reports, in addition toglobal reports (by time periods).Availability reportsIndicate, in a given period, the total number of testsperformed, the success and failure percentages in thattime for each test performed.Top-N type custom reportsThe operator can define a set of data that the applicationshows according to applied filters.Planned stops and exclusionExcludes from all types of reports the periods defined asmaintenance windows.Report templatesEnd users can easily create reports from templatesdefined by the administrator.Sending scheduled reportsThe administrator can define report scheduled sending byemail (in PDF).Graphic viewsThey allow the operator to create their own graphicpanels where to include monitoring data: graphics, statusicons and real-time values. These screens can relate toeach other.Real-time dataGraphs and reports show real-time data at all times, notpre-calculated data.Information availabilityPandora FMS is managed in real time from a webapplication for modern standard browsers (Edge, Firefox,Safari, Chrome).Information displayInformation is presented centrally in a single interface,using graphics, screens, dashboards and information listsin different views.Alert SystemAlarm generation and sendingPAG7Download Free TrialAlarm generation and sending are available as on-screenalerts and allow immediate sending by text message tomobile phones or email.
PA N D O R A F M S F E AT U R E S M A PFilters the alarm sending by maximum number ofrepetitions, minimum number of repetitions andconsecutive failure concurrency.Event auto-validationRecovered events will allow auto-validation when theproblem that triggered them is solved.Manual corrective actionsAllows performing manual actions on the events usingthe information available to launch diagnostic tools, openincidents, add notes or leave the event in work mode.Alarm correlationEstablishes sets of logical rules (AND, OR, NOT) thatallow to refine alarms based on the events collected in themonitored systems.Programmable alarm sending formatAlarm sending is user definable, so that it can beintegrated with new platforms, such as Telegram, via APIRest.Sound warning consoleAllows audible messages to be received by an operator,based on filters by origin and severity. This system iscomplementary to the others.Mobile application for receiving messagesEnables notice reception and their real-time checking forAndroid and iOS.pandorafms.comAlarm filtering and scalingIssues managementPAG8Download Free TrialManual ticket creation from an event or alertOn an active problem, create an incident associatedwith an event to perform an exhaustive follow-up of theproblem.Automatic ticket creation/updateAllows you to create tickets as an automatic response to aproblem detected by monitoring.Custom workflowAllows defining a life cycle for each ticket according tothe creator, dates, criticality, work group, etc. This lifecycle incorporates notification of changes in the flow byemail, automatic escalation and validation of the incidentclosure by external users.
PA N D O R A F M S F E AT U R E S M A Ppandorafms.comWeb Transactional MonitoringApplication and web server softwareScan and generate information on Java application(OAS-Oracle, JBoss-Redhat, WebLogic), IIS web serversand Apache monitoring.Transactional monitoring and user experienceVerifies the proper operation of each step of anapplication from the user’s point of view, being able toreplicate each one, measuring success and total time.Access via authenticationChecks application availability through user login andpassword.Application traceabilityChecks the availability of a request in the applicationfollowing a navigation flow (trace); each independentrequest is monitored indi- vidually, in addition to the entiretransaction.Application availabilityScans application services to evaluate operation by URLand IP.Transaction time breakdownBreaks down in time periods each of the key transactionsteps (server connection time, first iteration responsetime, application downloading time, etc).Navigation with distributed probesRemote web application monitoring is possible fromdifferent geographically distributed points, synchronizedby a central manager.ScreenshotsMakes screenshots to use them as informs in case offailure and thus to analyze the problem as it looks like fora real user.Database monitoringPAG9Download Free TrialDownload Free TrialCommercial relational database engines supportedSupports Oracle, Sybase, Informix, DB2, Microsoft SQLServer, MySQL and PostgreSQL.Commercial NoSQL database engines supportedSupports MongoDB, RavenDB, HBase and Cassandraengines.Storage system monitoringHard disk physical storage, disk groups, tablespace-datafiles-.
pandorafms.comPA N D O R A F M S F E AT U R E S M A PAvailabilityReports availability by opening and closing a connectionand services at operating system level.TransactionsReports database locks, number of open sessions,number of open cursors.Log relation of events and warningLogs errors, warnings, user and session status, checksreplication processes; updates data outside applications;generates and verifies backups.CPU usageIdentify the database usage percentage on the server thatcontains it.Cache usageShows cache usage by the database.Total number of connections and their statusShows connection real-time movement.Job failuresReports any errors in job execution.FragmentationIdentifies fragmentation level in data stores.Backup errorsGenerates manual and programmed alarms for failures inbackup.Custom SQL queriesMonitors the result of custom SQL (or equivalent) queries.Inventory is obtained both by remote network probes oragents.InventoryPAG10Download Free TrialObtaining the inventoryThe inventory is obtained by remote network probes or byagents, indistinctly.Inventory systemsNetwork equipment (routers,switches), as well as Linux orWindows servers.Network equipment remote configurationPeriodically collects remote configurations of networkequipment and stores their different versions over time.Detection of inventory changesAllows the operator to be notified in case of detectingchanges from one inventory review to another.Display of equipment configuration differencesVisually displays configuration changes on remotecomputers from which your configuration is collected aspart of the inventory.CPUCollects information about CPUs.
pandorafms.comPA N D O R A F M S F E AT U R E S M A PVídeoCollects information about PC-installed video cards.Hard drivesCollects information about computer-installed harddrives.PartitionsCollects information about each of the partitions on eachcomputer.NICCollects information about installed network cards anddrivers.PatchesCollects information about computer-installed patches.SoftwareCollects information about computer-installed software.ProcessesCollects information computer-running processes.RAMCollects information about computer-installed memorymodules.UsersCollects the number of administrator users or guests oneach computer.Training and supportOfficial trainingTraining in a standard way technicians on minimumindicated bases. Said training includes all usage levels andtool implementation.Official certificationsAccreditation, by means of an official certification,certifying the knowledge of the technicians.Online training platformTo make training easier, it has an online eLearningplatform to learn about the tool and certifications.ArchitecturePAG11Download Free TrialDownload Free TrialProblem scaling system and root cause analysisAllows analyzing the information based on the service asa whole, by grouping information. This makes the analysisof the problem root cause easier.Automatic provisioning systemDistributes the load in case of new node registrations onthe corresponding servers, or by load or custom rules.
pandorafms.comPA N D O R A F M S F E AT U R E S M A PLong-term data storageIt is able to keep all data history at full resolution for atleast three years.Communication via standard portsCommunication between the different components of thearchitecture is done through official ports, listed by theIANA.Isolated environment monitoringA system is provided by which an isolated network can bemonitored through a component that does not have directconnectivity to the central monitoring infrastructure.BackupIncludes an integrated backup systemPoliciesCreates monitoring, correlation and inventory policies.These policies can be applied by specific groups or users,so that similar machine sets can be managed easily,quickly and evenly.Single consoleA single console is available, regardless of the final scalingof the implementation. The same user will work for allthe tool features (network, applications, logs, reports)without logging in to different screens.Horizontal scalabilityThere is an unlimited chance of growth by adding newservers.High availabilityHA is integrated in the solution. All system componentssupport high availability without requiring externalelements.Distributed elementsAllows each element of the architecture to be in physicallocations (different servers).API/CLIProvides REST API and command line tools to manage thesolution.Open SQL DatabaseThe data model of the entire platform is open anddocumented, in order to use external queries to retrievedata.RebrandingAllows total product rebranding, hiding the name of themanufacturer, the name of the product and changingcolors and icons by the administrator.LicensingIt is licensed based on the total number of devices,regardless of the total number of metrics collected oneach device.Got any questions, suggestions or comments?PAG12¡Get in touch!
pandorafms.compandorafms.comPA N D O R A F M S F E AT U R E S M A P 3DQGRUD )06 //& OO ULJKWV UHVHUYHG 7KLV GRFXPHQW PD\ LQ QR HYHQW EH UHSURGXFHG RU PRGLӾHG GHFRPSLOHG GLVDVVHPEOHG SXEOLVKHG RU GLVWULEXWHG LQ ZKROH RU LQ SDUW RU WUDQVODWHG LQWR DQ\ HOHFWURQLF RU RWKHU PHGLD ZLWKRXW WKH SULRU ZULWWHQ FRQVHQW RI 3DQGRUD )06 OO ULJKW WLWOH DQG LQWHUHVW LQ DQG WR WKH VRIWZDUH VHUYLFHV DQG GRFXPHQWDWLRQ VKDOO UHPDLQ WKH H[FOXVLYH SURSHUW\ RI 3DQGRUD )06 LWV DԀOLDWHV DQG or respective licensors.3 1'25 )06 ',6&/ ,06 // : 55 17,(6 &21',7,216 25 27 (5 7(506 (;35(66 25 ,03/,(' 67 78725 25 27 (5:,6( 5(* 5',1* 7 ( '2&80(17 7,21 ,1&/8',1* :,7 287 /,0,7 7,21 7 ( 121 ,1)5,1*(0(17 &&85 & &203/(7(1(66 25 86()8/1(66 2) 1 ,1)250 7,21 &217 ,1(' (5(,1 ,1 12 (9(17 6 // 3 1'25 )06 ,76 6833/,(56 25 /,&(16256 %( /, %/( )25 1 ' 0 *(6 : (7 (5 5,6,1* ,1 &2175 &7 7257 25 81'(5 1 27 (5 /(* / 7 (25 (9(1 ,) 3 1'25 )06 6 %((1 '9,6(' 2) 7 ( 3266,%,/,7 2) 68& ' 0 *(6 OO 3DQGRUD )06 WUDGHPDUNV DUH WKH H[FOXVLYH SURSHUW\ RI 3DQGRUD )06 //& RU LWV DԀOLDWHV DUH UHJLVWHUHG ZLWK WKH 8 6 3DWHQW DQG 7UDGHPDUN 2ԀFH DQG PD\ EH UHJLVWHUHG RU SHQGLQJ UHJLVWUDWLRQ LQ RWKHU FRXQWULHV OO RWKHU 3DQGRUD )06 WUDGHPDUNV VHUYLFH PDUNV DQG ORJRV PD\ EH XQGHU FRPPRQ ODZ RU UHJLVWHUHG RU SHQGLQJ UHJLVWUDWLRQ OO RWKHU WUDGHPDUNV PHQWLRQHG KHUHLQ DUH XVHG IRU LGHQWLӾFDWLRQ SXUSRVHV RQO\ DQG DUH WUDGHPDUNV RI DQG PD\ EH UHJLVWHUHG WUDGHPDUNV RI WKHLU UHVSHFWLYH FRPSDQLHV PAG13
BAM monitoring Monitors business processes in real time in a single console (dashboard). PANDORA FMS FEATURES MAP PAN 7 pandorafms.com Reports SLA Reports Availability reports . using graphics, screens, dashboards and information lists in diˆerent views. Alert System Download Free Trial
