Transcription
Waste AuditingPracticesBest Practices Subcommittee—Zero Waste Dining20171
Table of Contents1. Introduction2. Waste Assessment ModelsWaste CharacterizationWaste Audit3. Waste Assessment Tools & ResourcesUC Irvine Waste Audit Calculator & Case Study (download here)UC Merced Waste Characterization Case StudyTyson MonagleUniversity of California, Irvinetmonagle@uci.edu3444569Sean MurrayUniversity of California, Mercedsmurray8@ucmerced.edu2
IntroductionZero Waste Dining is a critical component of the University’s goal to achieve Zero Waste1 by 2020. TheBest Practices Subcommittee on Zero Waste Dining seeks to support progress toward the goal of ZeroWaste by 2020 within campus dining operations, improving waste diversion2. The Subcommittee seeksto support progress toward this goal in two Phases. In Phase 1, the Subcommittee seeks to supportprogress in locations that rely entirely on Back-of-House (BOH) waste sorting. In Phase 2, theSubcommittee seeks to support progress in locations relying on both Back-of-House (BOH) and Front-ofHouse (FOH) waste sorting.In locations relying entirely on BOH waste sorting, dining staff are responsible for ensuring waste isplaced into the proper receptacles, as available – compost, recycling3, or landfill. Because all waste issorted by staff, only a limited number of people need to be educated and trained on proper sorting todivert 95% or more of solid waste from the location. Additionally, dining administration can usepreventative action (such as unambiguous bin labels) and corrective action (coaching and re-trainingemployees as needed, or when product changes occur that affect waste sorting) more effectively than inlocations relying on both BOH and FOH waste sorting, where potentially thousands of guests areresponsible for waste sorting.Waste Assessments allow a location to measure the successful waste sorting by staff or guests anddetermine a location’s waste diversion percentage – the percentage of waste not landfilled orincinerated. Multiple models of waste assessments exist to support locations based on their staffingcapacity and other limitations. This toolkit outlines different models of waste assessments and providesand explains how to use several available waste assessment tools developed by UC staff.1Zero Waste: For the purposes of measuring compliance with UC’s zero waste goal, locations needto meet or exceed 95% diversion of municipal solid waste. Ultimately, UC’s zero waste goal strivesfor the elimination of all materials sent to the landfill by 2020.2Waste Diversion: The process of diverting waste from landfills or incinerated, also calculated as apercentage of waste generated that is not sent to landfills or incinerated.3Some areas may require further separation of recyclables into waste streams, such as plastics,metals and glass, or even into different types of plastics.3
Waste Assessment ModelsThere are two principal models for conducting a waste assessment: the waste characterization or thewaste audit. Both models can be used to determine a location’s current waste diversion percentage.A Waste Characterization is a formal, hands-on waste assessment to characterize the specific types andquantities of the waste generated by a facility, determining both the location’s current waste diversionpercentage and its potential waste diversion percentage.During a waste characterization, the party conducting the assessment opens every bag and emptiesevery bin. Tarps are laid out, onto which the waste is emptied. The accurate waste diversion percentageis determined by cataloguing each bin’s weight using scales and records each bin’s municipal solid wastetype before it is emptied, then determining if it is below the acceptable threshold for contamination(subject to local program restrictions) by weighing misplaced items. Following this, the party conductingthe assessment then physically separates the types of waste, determining the maximum potential wastediversion percentage by identifying misplaced items that could have been recycled, composted, etc. andweighing again as needed. Where it is not possible to directly weigh using a scale, EPA volume-to-weighconversion factors (or other location-specific conversion factors) are used to determine the weight.A waste characterization may be particularly useful when first identifying what is being thrown away in afacility, what can or cannot be recycled, and determining if a facility has the potential to become a ZeroWaste facility based on its current waste generation and mix of municipal solid waste types andquantities.Conducting a waste characterization can also help to identify how best to educate staff and/or guests onhow they can improve their waste sorting. Because of the methods used in the waste characterization, awaste characterization may be more time- and labor-intensive and additionally require vehicles.Additional cleanup is also needed following a waste characterization.A Waste Audit is a waste assessment to determine the types and quantities of the waste generated by afacility, determining the location’s current waste diversion percentage but not directly determining thelocation’s potential waste diversion percentage.During a waste audit, the party conducting the waste assessment catalogues each bin’s weight usingscales and records each bin’s municipal solid waste type but does not empty the bins, and determines ifit is below the acceptable threshold for contamination (subject to local program restrictions) throughvisual inspection. Where it is not feasible to directly weigh using a scale, EPA volume-to-weightconversion factors (or other location-specific conversion factors) are used to determine the weight.4
Waste Assessment Tools and ResourcesThe following sections outline specific case studies from UC Irvine’s and UC Merced’s dining halls, wherewaste assessments have been conducted to identify need for product changes and new educationalstrategies and to designate locations as Zero Waste once they are operating on a daily basis with morethan 95% solid waste diversion.5
UC Irvine Waste Audit Calculator & Case StudyUnderstanding the UCI Waste Audit CalculatorThe UCI Waste Audit Calculator (download here) consists of three sections:Section 1: Location Information: This section is used to identify the facility for which the waste audit isbeing conducted, the party responsible for managing the facility, and the party responsible forconducting the waste audit.Section 2: Calculation: This section is used by the party conducting the waste audit to input each bin’sweight or volume.6
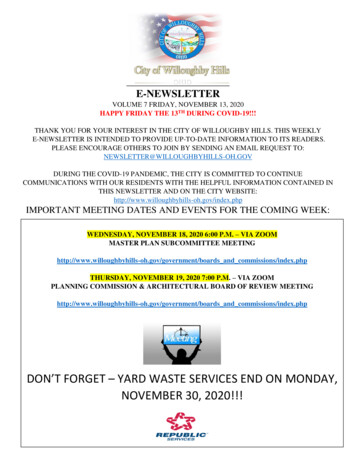
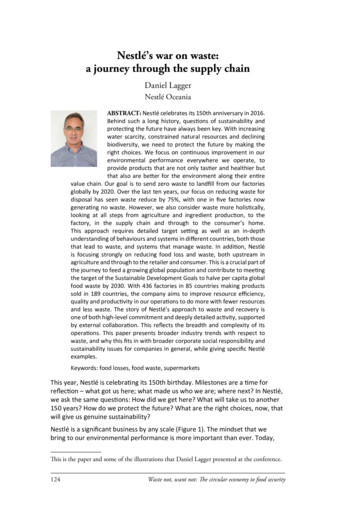
The UCI Waste Audit Calculator uses the following EPA volume-to-weight conversion factors.Municipal Solid Waste TypeCardboard (uncompacted)FoodOil/GreaseRecycle (Commingled)Trash/LandfillVolume1 yard31 gal1 gal1 yard31 galWeight (lbs.)1005.31257.45111.5Section 3: Results: This section displays the total waste generated in pounds, the total waste diverted inpounds, and the waste diversion percentage.Using This Tool to Conduct a Waste AuditThe steps below outline how to use this tool in practice.1. Planninga. Arrange with necessary stakeholders, including both the party responsible for managingthe facility and the party that will be conducting the waste audit, as well as any otherkey stakeholders to determine a date and time for the waste audit.b. Schedule your waste audit as close as possible prior to your date of bin pickup toaccurately account for all waste generated by the location.2. Setting Up the Tool For Your Facilities:a. It is recommended to download a separate copy of the UCI Waste Audit Calculator filefor each audit, as the calculator uses formulas that may be deleted in the process ofconducting a waste audit.b. The name of the facility being assessed is entered in cell L1.c. The name of the organization that manages the facility is entered in cell L2.d. The name of the party conducting the waste audit is entered in cell L3.e. The list of bins present is entered in columns B (Bin Type) and C (Bin Size), where B (BinType) is the unit of volume and C (Bin Size) is the number of units of volume the binholds. For example, a 22-gallon “Slim Jim” bin would be listed by entering “Gallon” inColumn B (Bin Type) and 22 in Column C (Bin Size).f. The location of bins throughout your facility can be designated in column A (BinLocation) to assist in identifying the proper corrective actions to take, if any, after thewaste audit.g. Additional rows can be added, as needed, through the following steps:i. Right-click the row label on the far left for any row from 10-27.ii. Select “Copy.”iii. Right-click the row label on the far left for any row from 10-27.7
iv. Select “Insert Copied Cells.”3. Conducting Your Waste Audita. For each bin in the location, the party conducting the audit must do the following:i. Determine the type of municipal solid waste the bin is used for and weigh thebin. Enter the type of municipal solid waste in column E (MSW Type) and enterthe weight in pounds in the appropriate column for the municipal solid wastetype (columns F through I).ii. If unable to weigh the bin directly, instead determine the type of municipal solidwaste the bin is used for and, to the nearest available approximation, how fullthe bin is. Enter the type of municipal solid waste in column E (MSW Type) andenter the approximation of how full the bin is in column D (% Full). In theexample, these fullness approximations are displayed in increments of 25%.iii. Determine if the bin exceeds the acceptable threshold for contamination(subject to local program restrictions). If it does, enter Landfill in column E(MSW Type) instead.4. Resultsa. The UCI Waste Audit Calculator will displays the total lbs. of waste generate, lbs. ofwaste diverted and the waste diversion percentage.Sample Case Study: UCI Pippin CommonsBackground: UCI has 25,256 undergraduate students, 6,295 graduate students and 11,053 faculty andstaff (excluding medical center staff at the UCI Medical Center in Orange, CA and student employeesalready counted as students). UCI’s Pippin Commons, operated by UCI Hospitality & Dining inpartnership with Aramark, serves approximately 19,000 meals a week.Using the UCI Waste Audit Calculator, UCI Facilities Management conducted a waste audit of PippinCommons. The UCI Facilities Management team entered the types and sizes of the bins in the Bin Sizeand Bin Type columns, and added which locations within Pippin those bins were placed in the BinLocation column. The types of municipal solid waste were noted in the MSW Type, using the Food,Recycle, Oil/Grease, Cardboard, and Trash/Landfill types. Because this waste audit was conducted aftera prior full-scale waste characterization, EPA volume-to-weight conversion factors were used,approximating the fullness of each bin to the nearest 25%.Based on the results, with minimal to no contamination in each bin, the location had a 97.8% diversionrate, sending less than 3% (48 pounds) of the 2,181.98 pounds of waste generated to landfill. Foodwaste and commingled recycling are hauled to the local Waste Management of Orange County (WMOC)site in Orange, CA. At the WMOC site, commingled recycling is sorted in a Materials Recovery Facility(MRF) using both machine-automated processes as well as manual processes. Fryer oil is picked up by athird party, which uses the oil to produce bio-diesel.8
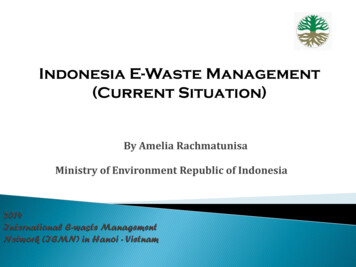
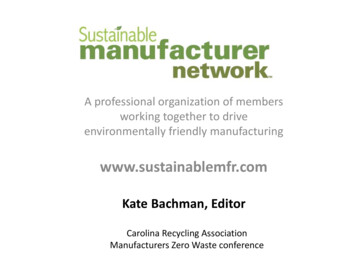
UC Merced Waste Characterization Case StudyUC Merced conducted a full-scale waste characterization of both Housing and Dining in February 2016.This study categorized waste into 13 types for Dining and 14 types for Housing.Through this waste characterization, each ban was emptied and re-sorted to identify the waste streamcomposition, shown in the tables below.9
In Dining, pre- and post-consumer food waste constituted the largest single type of waste, making up45.39% of the waste stream. Combined compostable materials, including pre- and post-consumer foodwaste and compostable food packaging made up 56.60% of all waste. Combined recyclables constitutedan additional 32.04%. Altogether, material that could be diverted from landfills made up 88.64% of thewaste stream.Given the UC goal of Zero Waste by 2020 requiring 95% or more of all solid waste to be diverted fromlandfills, this has prompted UC Merced Dining Services to examine product alternatives that wouldreduce food-soiled plastic packaging, as well as to consider bulk options that require no single-servepackaging.10
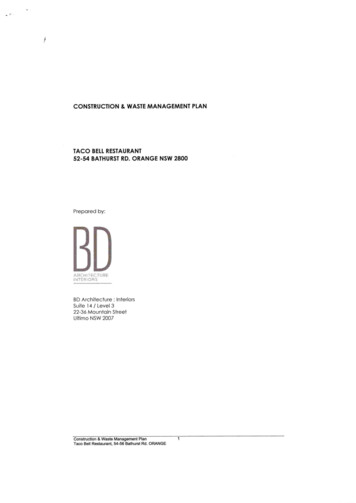
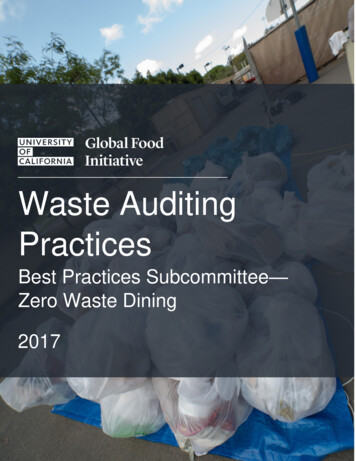
In Housing, food waste once again constituted the largest single type of waste, making up 29.90% of thewaste stream. Combined compostable materials, including food waste and compostable food packagingmade up 50.85% of all waste. Combined recyclables constituted an additional 32.04%. Altogether,material that could be diverted from landfills made up 80.74% of the waste stream.As a result, UC Merced Housing started a composting pilot in on-campus housing on October 1, 2016 todivert the 50% of the waste stream comprised of compostable items. The pilot will continue throughSpring 2017.11
University of CaliforniaGlobal Food tiative03/13/17
The UCI Facilities Management team entered the types and sizes of the bins in the Bin Size and Bin Type columns, and added which locations within Pippin those bins were placed in the Bin Location column. The types of municipa