Transcription
Using Automatic Workload Repository for Database Tuning: Tips forExpert DBAsKurt EngeleiterProduct Manager
The following is intended to outline our generalproduct direction. It is intended for informationpurposes only, and may not be incorporated into anycontract. It is not a commitment to deliver anymaterial, code, or functionality, and should not berelied upon in making purchasing decisions.The development, release, and timing of anyfeatures or functionality described for Oracle’sproducts remains at the sole discretion of Oracle.
Oracle Enterprise ManagerTop-Down, Integrated Application Management Complete, Open, Integrated Management forOracle Technologies– Deep, Optimized, Best of Breed– Database, Middleware, Packaged Applications,Physical and Virtual Infrastructure Business Centric, Top Down ApplicationManagement Complete Lifecycle Management Scalable Grid and Cloud Management– Manage many as one
Agenda Automatic Workload RepositoryInfrastructure Out of the box AWR reports Active Reports Insert Picture Here
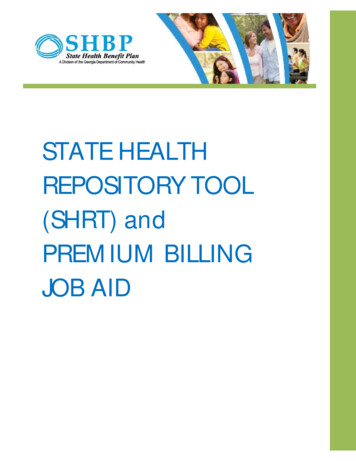
Automatic Workload Repository (AWR )Built-in,automaticperformancestatistics datawarehouseADDM findstop problemsMMONSYSAUXAWR DataBG BGFG FGIn-memorystatistics7:00 a.m.8:00 a.m.9:00 a.m.10:00 a.m.AWRASHStatisticsSnapshot 1Snapshot 2Snapshot 3Snapshot 4SGAV DBADBA HIST%Eightdays
Fundamental Concepts DB Time––––Total time in database calls by foreground sessionsIncludes CPU time, IO time and non-idle wait timeDB Time response timeTotal DB time sum of DB time for all active sessions Goal: To Reduce Total DB time Active Session– Session currently spending time in a database call, i.e., accruing DBtime Average Active Sessions DB TimeWall-Clock (Elapsed) Time Average Active Sessions is a key metric for measuring DB load
Multiple SessionsTotal DB Time Sum of DB Time Over All SessionsAvg. Active Sessions Sum of Avg. Activity Over All Sessions Total Database TimeWall-Clock (Elapsed) TimeAt time t we have 2 active sessionsUser 1User 2User 3User n time spent in databasetTIME
AWR Data Time Model– v sys time model dba hist sys time model– DB Time– Automatic Tracking of Operation Times Overall parse time (hard, soft, failed,.) SQL, PLSQL and Java overall execution timesCommitApplicationUser I/O Wait Model– v system event dba hist system event– Wait Events Categorized Based On Solution Area– More than 900 different wait events. 12 wait classes (Application,Concurrency.) SQL statement statistics– v sqlstats dba hist sqlstat– Resource Usage: Executions, Physical Reads, Physical Writes– Efficient Top SQL identification using deltas in the kernel OS Stats– v osstat dba hist osstat– CPU MemoryCPU
AWR Data Snapshots– DBA HIST SNAPSHOT Tracks Snapshots in the AWR When querying AWR, always join to other tables toconstrain the time frame
AWR Data
Active Session History (ASH) ASH is session level data Active sessions are sampled and persisted in-memory– Sampling interval 1 second– V ACTIVE SESSION HISTORY– Foreground and background sessions are sampled On-disk persistence– DBA HIST ACTIVE SESS HISTORY ASH is a system-wide trace of what happened ASH is a many-dimensional FACT table– Dimensions are V SESSION columns– Fact is that DB time was accumulating over these dimensions
Active Session History (ASH)Query forTom KyteBooksBrowse andReadReviewsAdditem tocartCheckoutusing‘one-click’DB TimeTimeSIDModule7:38:26213Book by author7:42:352137:50:597:52:33SQL IDStateEventqa324jffritcfWAITINGdb file sequentialreadGet review idaferv5desfzs5CPU213Add to carthk32pekfcbdfrWAITINGbuffer busy wait213One clickabngldf95f4deWAITINGlog file sync
ASHV SESSIONV ACTIVE SESSION HISTORYDBA HIST ACTIVE SESS HISTORYV SESSION WAITSessionStateEvery snapshotObjectsor out of spaceAWRMMON Lite(MMNL)Circular buffer in SGA
AWR and ASH in Enterprise Manager
Top Activity
SQL Details
Agenda Automatic Workload RepositoryInfrastructure Out of the box AWR reports Active Reports Insert Picture Here
AWR Reporting Resources Enterprise Manager is the preferred way toview and analyze AWR and ASH data In addition, predefined AWR html reports areprovided in each Oracle database release Each report has a specific function and usecase The following slides show the major reportsand their use cases
AWR Reporting Resources Available in– Enterprise Manager– ORACLE HOME/rdbms/adminREPORT NAMESQL ScriptAutomatic Workload Repository Reportawrrpt.sqlAutomatic Database Diagnostics Monitor Reportaddmrpt.sqlASH Reportashrpt.sqlAWR Diff Periods Reportawrddrpt.sqlAWR Single SQL Statement Reportawrsqrpt.sqlAWR Global Reportawrgrpt.sqlAWR Global Diff Reportawrgdrpt.sql11gR2
How do I read an AWR report?
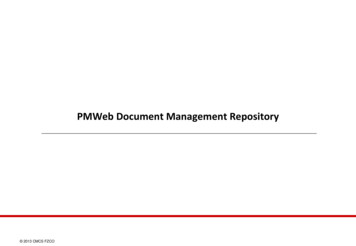
AWR Report The AWR report isthe most well knownperformance report. Oracle tuningprofessionalsfrequently start theiranalysis with thisreport. AWR report containsmuch data – butcontains no concreterecommendations foraction.
Tip: Check ADDM Report When Viewing AWRReport When viewing AWR report, always checkcorresponding ADDM report for actionablerecommendations ADDM is a self diagnostic engine designed fromthe experience of Oracle’s best tuning experts Analyzes AWR data automatically after an AWRsnapshot Makes specific performance recommendations Consistent – never has a ‘bad’ day ADDM also tells you what is NOT a problem
ADDM Report ADDM lists thetuning opportunitieswith the highestbenefit. ADDM makesspecific, actionablerecommendations. ADDM also listsareas of the systemthat are performingwell – that don’tneed tuning.
ADDM Impact Breakdown In Oracle Database11g Release 2,ADDM can breakdown the impact ofit’s findings byseveral dimensionsincluding service,and session.
AWR Global Report - RAC RAC AWR Report Report rewritten andrenamed in OracleDatabase 11.2.spawrrac.sql awrgrpt.sql All statistics fromAWR placed incomparative format,along with sums,averages andstandard deviations,making it easy tocompareperformance of RACnodes.
My database was running fineyesterday but it is really slow today?What has changed?
Tip: Use AWR Compare Periods Report to IdentifyChanges in Database Performance AWR Compare Periods Report– awrddrpt.sql – single instance– awrgdrpt.sql - RAC Compares database performance over two time periods Good for identifying what changed in performance Tip: Save AWR snapshots of time periods with goodperformance for reference Example:– Overall system performance resulting from database upgrade
AWR Global Compare Periods Report Compares globalRAC performancefor two time ranges This reportcompares theperformance of a twonode RAC system,before and after anupgrade from OracleDatabase 11.1.0.7 toOracle Database11.2.
AWR Global Compare Periods Report (cont.) The Load Profileshows a reduction inDB Time per secondand per transactionafter the upgrade –overall performancehas improved. Theupgrade was asuccess.
Comparative Performance Analysiswith AWR Baselines ActualAWR Baseline contains a set ofAWR snapshots for an “interesting orreference” period of timeBaseline are key for performancetuning to––– NormalAWR Baseline timeguide set alert thresholdsmonitor performancecompare advisor reportsUser-specifiable, schedulable, e.g.:– last Thanksgiving period– every Monday 10am-noon for4 MondaysAutomatically captures 8-day movingwindow baseline for week to weekcomparisons (default)
A user complains that his sessionseemed to hang for a few minutes.What happened?
Tip: Use ASH for Targeted Performance Diagnostics AWR snapshots and reports cover entire system Transient events can be averaged over a snapshot and be nonobvious from an AWR report ASH can be used for examining:– Targeted time range– A specific session service wait class client id SQL ID– A targeted time range in combination with the above
ASH Report Click on ‘Run ASH Report’ button from performance pageSelect time range and dimension to report on
ASH Report: ASH Report of a singlesession for a 5 minuteperiod The session accountedfor 52% of databaseactivity for the timeperiod The session spent 64%of the time in aconcurrency wait event,36% on CPU. There isclearly some opportunityfor tuning.
Has my SQL statement’s performancechanged over time?
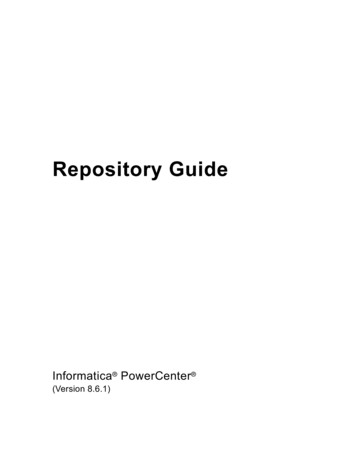
AWR Individual SQL Report AWR Report for aparticular SQL Statement-awrsqrpt.sqlPlan StatisticsBefore tuning Useful for researchingindividual SQL statementperformance over time Example: Single SQLstatement, before andafter tuning CPU Time per executionsubstantially decreased –tuning was successful.After tuning
Migrating AWR Data Why migrate AWR data? To offload analysis from production database To preserve data longer than the production default retentionperiod To do multi-database comparative analysis Scripts are located in ORACLE HOME/rdbms/adminActionSQL ScriptExtract data from AWR into a datapump fileawrextr.sqlLoad data from datapump file created byawrextr.sql into a databaseawrload.sql
Agenda Automatic Workload RepositoryInfrastructure Out of the box AWR reports Active Reports Insert Picture Here
Tip: Use Real-Time SQL MonitoringAnd Active Reports Automatically monitors long runningSQL Enabled out-of-the-box with noperformance impact Monitors each SQL execution Exposes monitoring statistics– Global execution level– Plan operation level– Parallel Execution level Can be saved or emailed as an ‘ActiveReport’
DemoActive Reports
Conclusion AWR contains vast amounts of database performancedata Enterprise Manager displays a comprehensive viewand analysis of that data Standard reports can provide additional insights– Use the right report for the right problem Active reports are a useful new tool for the Oracledatabase professional
Oracle Helps You Maximize Customer ValueDeploys SOAinfrastructure 92%fasterSaves 80% time andeffort for managingDatabasesAvoids online revenuelosses up to 25%Improves ITproductivity by 25%Drives asset utilizationup by 70%Cuts configurationmanagement effort by90%Saves 1.9 millionwith Oracle EnterpriseManagerSaves 170,000 peryear with OracleEnterprise ManagerReplaces manualtools with automation;saves time by 50%Reduces Databasetesting time by 90%Reduces provisioningeffort by 75%Saves weeks onapplication testingtimeCuts applicationtesting from weeks tohoursReduces criticalpatching time by 80%Delivers 24/7 uptimewith Oracle EnterpriseManager
Additional Oracle Enterprise Manager sessionsWednesday, Oct. 14 11:45 a.m.- Performance-Testing OracleE-Business Suite: Tips and Tricks fromOracle Experts 11:45 a.m.- Oracle Enterprise Manager:Monitoring and Security Best Practices 11:45 a.m.- Upgrade Case Study:Database Replay, Snapshot Standby,and Plan Baselines 1:45 p.m.- Quick Tips for DatabasePerformance Tuning 5:00 p.m.- SQL Gone Wild: Taming BadSQL the Easy Way (or the Hard Way) 5:00pm Oracle Enterprise Manager:Beyond the Basics: Getting More fromOracle Enterprise ManagerLocation Moscone S. Room 305 Moscone S. Room 303 Moscone S. Room 301 Moscone S. Room 104 Moscone S. Room 102 Moscone S. Room 305
Additional Oracle Enterprise Manager sessionsThursday, Oct. 15Location 10:30 a.m.Everyone Is Applying CPUs(Critical Patch Updates), Right? Moscone S. Room 303 10:30 am DBA’s New Best Friend:Oracle Database 10g and OracleDatabase 11g SQL PerformanceAnalyzer 12:00 p.m. Worry-Free ApplicationUpgrade Using Oracle ChangeManagement Pack 1:30pm Dell IT's Implementation ofOracle Enterprise Manager PatchProvisioning Moscone S. Room 102 Moscone S. Room 102 Moscone S. Room 306
AWR Report The AWR report is the most well known performance report. Oracle tuning professionals frequently start their analysis with this report. AWR report contains much data – but contains no concrete recommendations for action.File Size: 2MB