Transcription
Middlesex University Research RepositoryAn open access repository ofMiddlesex University researchhttp://eprints.mdx.ac.ukLekesyte, Barbora, Kett, Stephen ORCID: https://orcid.org/0000-0002-0987-5001 andTimmermans, Martijn J. T. N. ORCID: https://orcid.org/0000-0002-5024-9053 (2018) What’s onthe menu: Drosera rotundifolia diet determination using DNA data. Journal of the Lundy FieldSociety, 6 . pp. 55-64. ISSN 1758-3276 [Article]Published version (with publisher’s formatting)This version is available at: http://eprints.mdx.ac.uk/23446/Copyright:Middlesex University Research Repository makes the University’s research available electronically.Copyright and moral rights to this work are retained by the author and/or other copyright ownersunless otherwise stated. The work is supplied on the understanding that any use for commercial gainis strictly forbidden. A copy may be downloaded for personal, non-commercial, research or studywithout prior permission and without charge.Works, including theses and research projects, may not be reproduced in any format or medium, orextensive quotations taken from them, or their content changed in any way, without first obtainingpermission in writing from the copyright holder(s). They may not be sold or exploited commercially inany format or medium without the prior written permission of the copyright holder(s).Full bibliographic details must be given when referring to, or quoting from full items including theauthor’s name, the title of the work, publication details where relevant (place, publisher, date), pagination, and for theses or dissertations the awarding institution, the degree type awarded, and thedate of the award.If you believe that any material held in the repository infringes copyright law, please contact theRepository Team at Middlesex University via the following email address:eprints@mdx.ac.ukThe item will be removed from the repository while any claim is being investigated.See also repository copyright: re-use policy: http://eprints.mdx.ac.uk/policies.html#copy
Journal of the Lundy Field Society, 6, 2018WHAT’S ON THE MENU: DROSERA ROTUNDIFOLIA DIETDETERMINATION USING DNA DATAbyBARBORA LEKESYTE1,2, STEPHEN KETT2 AND MARTIJN J.T.N. TIMMERMANS2,32Department of Natural Sciences, Middlesex University, The Burroughs,Hendon, London, NW4 4BT3Department of Life Science, Natural History Museum, Cromwell Road,London, SW7 5BD1Corresponding author, e-mail: barbora.lekesyte@gmail.comABSTRACTThe round-leaved sundew, Drosera rotundifolia, is a carnivorousplant species. On Lundy it is found in the nutrient-poor bogenvironments of Pondsbury and the northernmost quarry,where it supplements its diet with invertebrate prey. To gaininsight into the diet of these two sundew populations ametabarcoding approach was trialled. This is, to ourknowledge, the first study to use DNA barcodes to identifyDrosera prey. At each site, a 0.25m2 quadrat was placed in arepresentative Drosera patch and two days’ worth of prey werecollected. To identify prey items, Cytochrome c oxidasesubunit I (COX1) sequences were obtained and compared tothe Barcode of Life database. This revealed that Lundysundews have a mixed diet. In total at least 20 different preytaxa were detected in the two 0.25m2 areas sampled. Sixteentaxa could be identified to species, indicating thatmetabarcoding permits accurate species level identification ofsundew prey items. The majority of prey taxa were dipterans(two-winged flies), of which several have previously beenreported on Lundy. Most prey taxa were detected in only oneof the two quadrats examined (Jaccard’s index ofSimilarity 0.01; ‘dissimilar’). This might indicate that the twoDrosera populations feed on distinct prey communities, butmore research is needed to confirm this.Keywords: Lundy, carnivorous plants, sundew Drosera, DNAbarcodes, prey taxa, DipteraINTRODUCTIONCarnivorous plants of the genus Drosera (sundews) are typically found in nutrient poorenvironments (Ellison and Gotelli, 2001). They thrive under these deprived conditionsby supplementing their diet with arthropod prey (Millett et al., 2003). Prey are caughtand digested with modified leaves (‘blades’). Blades possess large numbers of glandular‘hairs’ that secrete drops of viscous adhesive solution. When arthropods contact with- 27 -
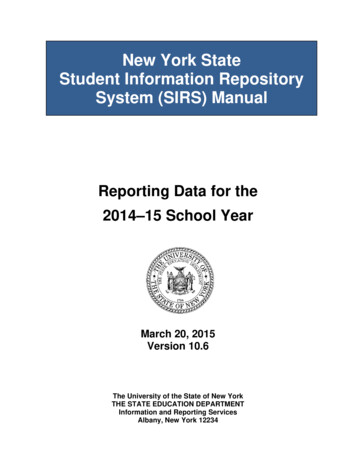
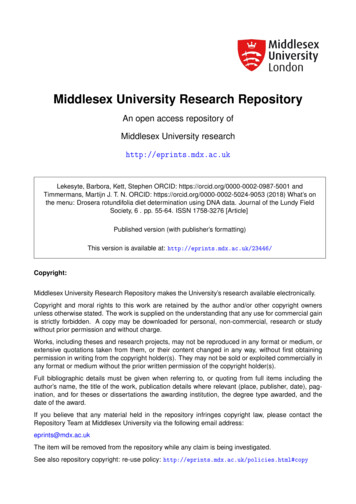
Journal of the Lundy Field Society, 6, 2018these drops they are trapped anddie (Adlassnig et al., 2010) (Figure1). Digestive enzymes producedby the plants then dissolve preyitems, releasing nutrients to beabsorbed by the plant (Adamec,2002).Figure 1: Drosera rotundifoliawith prey items. S. KettThe genus Drosera has attracted scientific attention since the eighteenth century, mostof which focussed on benefits of prey capture on plant growth and survival (e.g.‘Botany’, 1874; Darwin, 1875; Roth, 1782; Thum, 1988; Hooker, 1916). For example,Thum (1988) showed that artificially increased food supply Drosera increases dry weight,flower and leaf number and the overall trapping area of individual plants. Equally, planttraits (Foot et al., 2014) and microhabitat (Thum, 1986) have also been shown to affectprey capture efficiency and diet composition.Investigating natural Drosera diet, via morphological identification of prey, however,is often hampered by the rapid digestion of prey tissue. To overcome this difficulty aDNA barcoding approach to identify prey was trialled. DNA barcodes are standardisedgenetic markers used for taxonomic identification, ideally to species level (Hebert et al.,2003). DNA sequences are obtained from specimens and then compared to sequencesfrom accurately identified and vouchered specimens in a reference database. Matchesbetween ‘unknown’ DNA sequences and sequences in the database result in a positiveidentification for specimens of interest.This study focussed on the round-leaved sundew, D. rotundifolia L., Lundy’s onlycarnivorous plant species. Samples were taken from two populations (Figure 2). Onepopulation is found at the edge of Lundy’s largest pond, Pondsbury (51.1038 N,4.4012 W). Much of the surface vegetation in this area is Sphagnum bog with frequenttussocks of Juncus sp. The other population is found in the northernmost quarry(51.1045 N, 4.3953 W). Here vegetation is characterised by Sphagnum and other plantsadapted to acid, poorly drained soils.This study aimed to test whether sundew prey items can be identified to species levelusing molecular barcoding and to compare obtained identifications to existing Lundyspecies records.- 28 -
Journal of the Lundy Field Society, 6, 2018Figure 2: The two Lundy Drosera rotundifolia populations sampled.A) Pondsbury, B) the northernmost quarry. B. LekesyteMATERIAL AND METHODSField work methodsIn June 2016, 0.5 0.5 m quadrats were established within the Pondsbury and Quarry D.rotundifolia populations. Quadrats were placed in locations judged ‘typical’ of a denseDrosera ‘patch’. Flags were used to indicate the four quadrat corners to permit relocationof each quadrat. On the first day of the experiment, plant blades were ‘cleaned’ usingforceps to remove all prey items. To determine prey composition, prey were collected twodays after cleaning occurred. Collected prey items were stored in tubes of absolute ethanol.Laboratory methodsFor each quadrat, prey samples were pooled in a single tube. DNA extractions wereperformed on these pooled samples. Ethanol was removed by pipetting. A heating block(56 C) was used to evaporate residual ethanol. DNA extractions used the Blood andTissue Kit (Qiagen) and followed manufacturer’s recommendations, except that doublevolumes were used for buffer ATL, buffer AL and 100% ethanol. Extracted DNA wassubsequently sent to NatureMetrics Ltd for metabarcoding. Metabarcoding followedNatureMetrics Ltd standard procedures. In brief, a short fragment of the cytochromeoxidase c subunit 1 (COI) barcode was amplified using primer Fol-degen-rev 5’-- 29 -
Journal of the Lundy Field Society, 6, 2018TANACYTCNGGRTGNCCRAARAAYCA-3’ (Yang et al. 2012) combined with Lerayprimer mlCOIintF: 5’-GGWACWGGWTGAACWGTWTAYCCYCC-3’ (Leray et al.2013) or combined with primer ‘Short2’ 5’-CCNGAYATRGCNTTYCCNCG-3’(NatureMetrics Ltd, pers. comm.) (Figure 3). All PCR reactions were performed intriplicate. PCR products were purified and quantified (Qubit high sensitivity kit). PCRproducts for the same site (quadrat) were pooled and Next Generation Sequencing (NGS)libraries were prepared as specified by Illumina for amplicon sequencing on the IlluminaMiSeq System (Illumina Inc. 2013) and sequenced using an Illumina MiSeq 2 300 kit.Figure 3: Two fragments of the COX1 gene were amplified using PCR. Primers Short2and Fol-degen-rev amplify a 365bp fragment. Primers mlCOIintF and Fol-degen-rev a464bp fragment. Positions of the three primers (green triangles) on the COX1 genesequence (green bar) are givenBioinformatic methodsRaw sequencing reads for each site were stitched using PEAR (Zhang et al., 2014) andsubsequently split by forward primer sequence using cutadapt (Martin, 2011). This stepalso trimmed uninformative PCR primer sequences. Low quality sequences wereremoved using the prinseq-lite Perl script (Schmieder and Edwards, 2011), removing allsequences that contained at least a single ‘N’, had a single position with a Phred qualitybelow 20 and an average Phred quality below 30. Sequences were then converted toFASTA format using fq2fa (Peng et al., 2012). Operational Taxonomic Units (OTUs)were constructed from these files using the UPARSE pipe-line (Edgar, 2013). Sequenceswere de-replicated (merging all exact duplicates) and singletons (sequences that wereobserved once only) were removed. Remaining sequences were clustered at 97%similarity in USEARCH (Edgar, 2010) to generate OTUs and all sequences weresubsequently assigned to each of the different OTUs (again at 97% similarity). OTUswith less than 10 sequences for both quadrats combined were discarded. To identifyOTUs in the final dataset, sequences were compared to the Barcode of Life (BOLD)database (http://www.boldsystems.org/). Identifications were compared to the Dipterachecklist for Lundy (Lane, 1977) and various other sources (Figure 4). Prey taxonapproximate sizes were obtained from a variety of generic sources.Jaccard's Index of SimilarityJaccard's Index of Similarity was used to determine overall similarity of compositionbetween the two sets of identified prey taxa, from the Pondsbury and the quarry sites. Itwas applied only where prey taxon presence could be unequivocally determined, e.g. ifa genus occurs in both prey sets, it was not possible to determine without speciesidentification whether a species level difference occurred between the two taxa.- 30 -
Journal of the Lundy Field Society, 6, 2018Figure 4: Taxa observed at two sites on Lundy using: Left) Leray (2013) primers andRight) Short2 (NatureMetrics Ltd., pers. comm.) primers. Left vertical axis: Numberof sequences observed for a specific taxon. Blue (Pondsbury) and red (Quarry) barsand blue and red numbers on the graph represent number of sequences observed.Right axis: % similarity (grey bar) to a reference sequence in the BOLD database.Horizontal line indicates 97% similarity. Family names are given above graph. Allfamilies belong to Diptera, except *) Entomobryomorpha (Collembola), **) Opiliones(Arachnida) and ***) Araneae (Arachnida). Species names (if available) are givenbelow graph. Numbers between parentheses refer to: 1) (Lane, 1978) 2) (Menzel et al.,2006) 3) (Smith and Nunny, 2012) 4) (Parsons, 1988) 5) (Parsons, 1996) 6)srs.britishspiders.org.uk (last accessed 07/07/2017. Note that Tomocerus longicornis,Opilio saxitalis and Oscinella sp. are represented by two Leray OTURESULTSDrosera populationsThe Pondsbury quadrat contained 91 D. rotundifolia plants and the quarry quadrat 66.Within the two-day sampling period plants in the Pondsbury and quarry quadratscaught totals of 44 and 83 prey items respectively.Molecular identification of prey itemsIn total, 234,058 raw paired-end reads were obtained. There were 162,345 paired-endreads for the Pondsbury sample and 71,713 paired-end reads for the quarry sample.Reads were merged and 94.2% of the Pondsbury and 96.8% of the quarry samples could- 31 -
Journal of the Lundy Field Society, 6, 2018be combined into single contiguous sequences. These datasets were subsequently splitby PCR primer sequence (i.e. Leray or Short2), resulting in two datasets for the quarrysample (Leray: 58866 sequences; Short2: 10222 sequences) and two datasets for thePondsbury sample (Leray: 79316 sequences; Short2: 73110 sequences). Sequences wereclustered per primer pair to construct OTUs. OTUs with 10 or more associatedsequences are given in Figure 4.Figure 4 shows that several OTUs are represented by a large number of sequences inone sample and by a very small number in the other (e.g. Tomocerus longicornis: 7300sequences in quarry sample, 1 sequence in Pondsbury sample). It is currently unclearwhether such very low numbers are a genuine reflection of the presence of a species atthe respective quadrat, or whether they are merely a result of cross-contamination.Cross-contamination between samples is a well-known risk when working withenvironmental DNA (Thomsen and Willerslev, 2015). To avoid overestimation of thenumber of prey species at each site, such cases were treated as cross-contamination.Identifications were obtained using the Barcode of Life Database(http://www.boldsystems.org) search engine. This revealed that all Pondsbury OTUsare dipterans (most from the family Chironomidae). Dipterans were also most abundantin the quarry datasets, but two species of Arachnida and one collembolan species werealso observed.With the Leray primer greater diversity was revealed than with the Short2 primer(Figure 4). All OTUs observed using the Short2 primer, are also observed using theLeray primer, but not vice versa. The Leray primer revealed three more species forPondsbury and six m
Operational Taxonomic Units (OTUs) were constructed from these files using the UPARSE pipe-line (Edgar, 2013). Sequences were de-replicated (merging all exact duplicates) and singletons (sequences that were observed once only) were removed. Remaining sequences were clustered at 97%