![Akamai’s [state Of The Internet]](/img/11/akamai-soti-q214.jpg)
Transcription
Q2 [ 2014 R e p ort] Volum e 8 Num be r 2ak amai’s [ st at e o f t h e in t e rnet]
[ LETTER FROM THE EDITOR ]If you’re reading this issue of the State of the Internet Report as a pdf,or in printed/bound form, you’ll notice that it looks very different than it has in the past.Akamai’s Creative & Brand Development group has redesigned the report to be morelegible, user-friendly and reflect the modern, forward-thinking look of Akamai’s evolvingbrand visuals. We’re very proud of how the report has evolved over time, and think that thisredesign reinforces the value and importance of the data contained within it.In addition to the report redesign, we’re also excited about an associated Web site thatwe are launching in October. The dedicated State of the Internet Web site, to be located atwww.stateoftheinternet.com, is intended to provide a permanent home for the quarterlyState of the Internet Report, as well as future derivatives, such as the upcoming securityfocused report. The site is designed to be fully responsive, consumable on both desktopand mobile devices, with a user interface design that is clearly associated with the report.It will include assets associated with the quarterly report, including report downloads,infographics, data visualizations, and eventually data set downloads as well. In addition,it will include content, visualizations, and data previously found on www.prolexic.com,including plxsert reports and threat advisories. Over time, we plan to include additionalanalysis and commentary on relevant topics and trends through blog posts, podcasts,and other interactive features. Ultimately, Akamai is part of a community that wants tomake the Internet fast, reliable and secure for all, and with this dedicated Web site, we willshare relevant data and trends, with insight into why you should care (and take action ifnecessary). Expect a formal launch announcement later in October.Finally, as a further complement to the redesigned report and the new Web site, we arelaunching an Android-friendly version of the State of the Internet application that waslaunched for Apple iOS devices back in January 2014. Similar to the iOS application, theAndroid version of the application will allow users to read both current and archivedversions of the State of the Internet Report, visualize data from key report metrics, andread the latest content shared by @akamai soti on Twitter. Look for the Android-friendlyversion of the State of the Internet application in the Google Play app store in October.As always, if you have questions, comments, or suggestions regarding the State of theInternet Report, the Web site, or the mobile applications, connect with us via e-mail atstateoftheinternet@akamai.com or on Twitter at @akamai soti.—David Belson
[ TABLE OF CONTENTS ]3[EXECUTIVE SUMMARY]5 [section]1 security6 1.1 / Attack Traffic, Top Originating Ports6 1.2 / Attack Traffic, Top Ports6 1.3 / Observations on DDoS Attacks8 1.4 / Heartbleed, SNMP Reflection Attacks,Storm & Zeus Crimeware13141416[SECTION]2 Internet Penetration2.1 / Unique IPv4 Addresses2.2 / IPv4 Exhaustion2.3 / IPv6 Adoption19 [section]3 Geography (Global)20 3.1 / Global Average Connection Speeds20 3.2 / Global Average Peak Connection Speeds21 3.3 / Global High Broadband Connectivity21 3.4 / Global Broadband Connectivity22 3.5 / Global 4K Readiness37 [section]6 Geography (Asia pacific)37 6.1 / Asia Pacific Average Connection Speeds38 6.2 / Asia Pacific Average Peak Connection Speeds38 6.3 / Asia Pacific High Broadband Connectivity39 6.4 / Asia Pacific Broadband Connectivity40 6.5 / Asia Pacific 4K Readiness43 [section]7 Geography (EMEA)(europe middle east africa)43 7.1 / EMEA Average Connection Speeds44 7.2 / EMEA Average Peak Connection Speeds45 7.3 / EMEA High Broadband Connectivity46 7.4 / EMEA Broadband Connectivity46 7.5 / EMEA 4K Readiness49 [section]8 Mobile connectivity50 8.1 / Connection Speeds on Mobile Networks50 8.2 / Mobile Browser Usage Data51 8.3 / Mobile Traffic Growth Observed by Ericsson55 [section]9 situational performance25 [section]4 Geography (United States)25 4.1 / United States Average Connection Speeds26 4.2 / United States Average Peak Connection Speeds27 4.3 / United States High Broadband Connectivity27 4.4 / United States Broadband Connectivity28 4.5 / United States 4K Readiness31 [section] Geography (Americas)31 5.1 / Americas Average Connection Speeds32 5.2 / Americas Average Peak Connection Speeds32 5.3 / Americas High Broadband Connectivity33 5.4 / Americas Broadband Connectivity34 5.5 / Americas 4K Readiness59 [section]10 internet disruptions events60 10.1 / World Cup60 10.2 / Iraq60 10.3 / Syria64 [section]11 appendix565 [section]12 endnotes
[ EXECUTIVE SUMMARY ]Akamai’s globally-distributed Intelligent Platform allows us togather massive amounts of data on many metrics, includingconnection speeds, attack traffic, network connectivity/availabilityissues, and IPv6 adoption progress, as well as traffic patterns acrossleading Web properties and digital media providers. Each quarter,Akamai publishes the State of the Internet Report.This quarter’s report includes data gathered from across the AkamaiIntelligent Platform during the second quarter of 2014, coveringattack traffic and Internet connection speeds/broadband adoptionacross both fixed and mobile networks, as well as trends seen in thisdata over time. In addition, this quarter’s report includes insightinto the OpenSSL “Heartbleed” vulnerability, snmp ReflectionAttacks, Storm and Zeus crimeware, the states of IPv4 exhaustionand IPv6 adoption, Internet disruptions that occurred during thequarter, and observations from Akamai partner Ericsson regardingdata and voice traffic growth on mobile networks.Security / During the second quarter of 2014, Akamai observedattack traffic originating from source ip addresses in 161 uniquecountries/regions. Note that our methodology captures the sourceip address of an observed attack, and cannot determine attributionof an attacker. China remained in the top slot, growing to 43%of observed attack traffic. Indonesia saw a significant increasein observed attack traffic, more than doubling to 15%, while theUnited States increased nominally to 13%. Overall attack trafficconcentration across the top 10 countries/regions increased fromthe first quarter of 2014, growing to 84% of observed attacks. Attackvolume targeting Port 80 nearly doubled from the first quarterto 15%, placing it as the most targeted port in the second quarter,pushing Port 445 out of the top slot for only the third time in thehistory of the report. During the second quarter, Akamai customersreported being targeted by 270 DDoS attacks, 5% fewer than in theprior quarter, and 15% fewer than in the second quarter of 2013.Enterprise and Commerce customers together accounted for nearly60% of the reported attacks during the quarter, with more than halfof the total attacks reported by customers in the Americas region.In addition, the second quarter saw growth in Simple NetworkManagement Protocol (snmp) reflection attacks, the spread of“Storm” and “Zeus” crimeware kits, and the discovery of a flawknown as “Heartbleed” in the widely-used OpenSSL code base.Internet and Broadband Adoption / In the second quarter,Akamai observed a 0.9% decrease in the number of unique IPv4addresses connecting to the Akamai Intelligent Platform, falling toover 788 million, or about seven million fewer than were seen inthe first quarter of 2014. Looking at connection speeds, the globalaverage connection speed grew 21% to 4.6 Mbps and the globalaverage peak connection speed grew 20%, reaching 25.4 Mbps. Ata country/region level, South Korea continued to have the highestaverage connection speed at 24.6 Mbps but Hong Kong had thehighest average peak connection speed at 73.9 Mbps. Globally, highbroadband ( 10 Mbps) adoption grew 12% to reach 23%, and SouthKorea remained the country with the highest level of high broadbandadoption, at 78%. Global broadband ( 4 Mbps) adoption grew 5.6%quarter-over-quarter to 59%, and South Korea’s broadband adoptionrate inched up to 95% in the second quarter. “4k-ready” ( 15 Mbps)connections grew to 12% on a global basis, and in top country SouthKorea, 62% of connections were at those speeds.Mobile Connectivity / In the second quarter of 2014, averagemobile connection speeds (aggregated at a country level) rangedfrom a high of 15.2 Mbps in South Korea down to a low of 0.9 Mbpsin Vietnam. Average peak mobile connection speeds ranged from108 Mbps in Australia down to 4.7 Mbps in Vietnam. Denmarkhad 92% of its mobile connections to Akamai at speeds above the 4Mbps “broadband” threshold, while five countries had less than 1%of connections at those speeds. Based on traffic data collected byEricsson, the volume of mobile data traffic grew approximately 10%between the first and second quarters of 2014.Analysis of Akamai io data collected during the second quarterfrom a sample of requests to the Akamai Intelligent Platformindicates that for traffic from mobile devices on cellular networks,Apple Mobile Safari accounted for approximately 36% of requests,with Android Webkit trailing at nearly 33%. For traffic from mobiledevices on all networks, Apple Mobile Safari was responsible fornearly 49% of requests, while Android Webkit drove nearly 32%.www.stateoftheinternet.com / 3
[ SECTION ] 1SECURITY Akamai maintains a distributed set of agents deployed acrossthe Internet that monitor attack traffic. Based on data collectedby these agents, Akamai is able to identify the top countriesfrom which attack traffic originates, as well as the top ports targetedby these attacks. Note that the originating country as identified by thesource ip address is not attribution — for example, a criminal in Russiamay be launching attacks from compromised systems in China. Thissection provides insight into port-level attack traffic, as observed andmeasured by Akamai, during the second quarter of 2014.It also includes insight into DDoS attacks that targeted Akamaicustomers during the first quarter of 2014, as well as information aboutHeartbleed, snmp Reflection Attacks, and Storm/Zeus Crimeware.Within this report, all representations denote our view of the best andmost consistent ways of attributing attacks we have seen, based not onlyon published claims, but on analysis of the tools, tactics, and methodsthat tend to provide a consistent signature for different adversaries.5
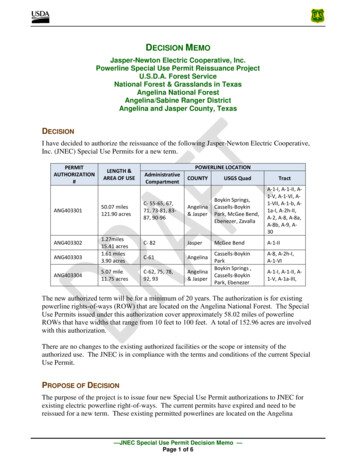
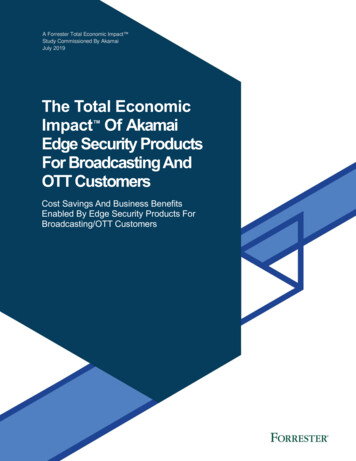
[SECTION] 1 SECURITY1.1 Attack Traffic, Top Originating Ports / During thesecond quarter of 2014, Akamai observed attack traffic originatingfrom 161 unique countries/regions, down from 194 in the first quarter.As shown in Figure 1, China once again remained squarely ahead ofthe other countries/regions in the top 10, originating 43% of observedattacks, or nearly 3x as much as Indonesia, which saw observed attackvolume more than double quarter-over-quarter. The United Stateswas the only other entrant among the top 10 that originated more than10% of observed attack traffic, growing slightly to 13% in the secondquarter. Among the remaining members of the list, only Taiwan sawa quarterly increase, while the other six had lower observed attackvolumes as compared to the prior quarter. The composition of thetop 10 list remained consistent between the first and second quarters.The overall concentration of observed attack traffic increased in thesecond quarter, with the top 10 countries/regions originating 84% ofobserved attacks, up from 75% in the first quarter.Likely related to the percentage increases seen in China and Indonesia,observed attack traffic concentration from the Asia Pacific region sawfurther growth in the second quarter of 2014, reaching 70%. This is5x the concentration seen in North America, which originated 14%of observed attacks. Europe had the next lowest concentration ofattacks, at 11%, while the lowest attack volumes came from countries/regions in South America and Africa, contributing 4.3% and 0.3%respectively. Though minimal at under 1%, Africa’s percentage washalf that seen in the first quarter.1.2 Attack Traffic, Top Ports / As shown in Figure 2, attacktraffic targeting Port 80 (www/http) nearly doubled from thefirst quarter, growing to 15%, and pushing Port 445 (MicrosoftDS) down to second place. This marks only the third timethat Port 445 has not held the top slot, and it is interesting tonote that this same shift also occurred in the second quarterof 2013. However, unlike last year, the attack traffic percentagetargeting Port 445 remained consistent quarter-over-quarter,and it was the only port among the top 10 that did not see anincrease as compared to the prior quarter. To that end, attackCountry/RegionQ2 '14Traffic %Q1 '14 %traffic concentration across the top 10 targeted ports wasup significantly on a quarterly basis, as they attracted 71% ofobserved attacks, compared to just 55% last quarter.Although it was the most targeted port in the second quarter, Port80 was not the most targeted port among any of the top 10 countries/regions. It was, however, the second-most targeted port among threeof the top four countries/regions by a significant margin as comparedto the remaining ports. Half of the top 10 countries/regions saw thelargest number of observed attacks targeting Port 445, while Port 23was the most popular in China, South Korea, and Turkey, indicatingongoing efforts to identify open Telnet ports, where brute force ordefault logins are often leveraged in an attempt to gain access to, andcontrol of, vulnerable target systems. The remaining two countries ofthe top 10, Indonesia and the United States, saw the largest numberof attacks targeting Port 443 and Port 1433 respectively, indicatingongoing attempts to locate and compromise vulnerable Web-basedapplications and associated databases.1.3 Observations on DDoS Attacks / For the second quarter in arow, Akamai customers reported fewer DDoS attacks, dropping from346 attacks in the fourth quarter of 2013 and 283 in the first quarterof 2014 to 270 attacks in the second quarter, as illustrated in Figure 3.This represents a 5% drop from the previous quarter and a 15% yearover-year decline. This reduction in attacks mirrors the attack trendsreported in the Prolexic Q2 Global DDoS Attack Report, whichreports that volumetric attacks have continued to increase in numbersand volume while application attacks (Layer 7) have declined.Figure 4 shows that, while the overall number of attacks reportedto Akamai by customers in the second quarter were down, attacksin the Americas were up, increasing 11% from 139 to 154 attacks andaccounting for 57% of all reported attacks. The Asia Pacific (apac)region saw the largest decline in attacks, from a high of 87 attacksin the first quarter to 67 in the second, a 23% reduction. The regionaccounted for 25% of worldwide attacks. The Europe/Middle East/Africa (emea) region also experienced a modest decline of 14%, withPortCountry/RegionQ2 '14Traffic %Q1 '14 %8.0%1China43%41%80WWW ited States13%11%23Telnet10%8.7%4Taiwan3.7%3.4%443Ssl (HTTPS)7.7%2.9%5India2.1%2.6%1433Microsoft SQL Server6.7%2.3%6Russia2.0%2.9%8080HTTP Alternate5.5%1.5%7Brazil1.7%3.2%3389Microsoft Terminal Services4.3%2.8%8South ��Other16%25%VariousOther29%–Figure 1: Attack Traffic, Top Originating Countries(by source IP address, not attribution)6 / The State of the Internet / Q2 2014Figure 2: Attack Traffic, Top Ports
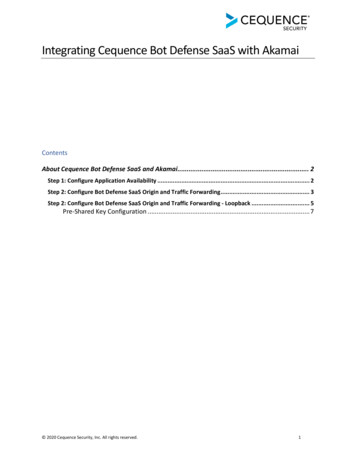
346350318300283281270250200200208150100500Q4 '12 Q1 '13 Q2 '13 Q3 '13 Q4 '13 Q1 '14 Q2 '14 Figure 3: DDoS Attacks Reported by Akamai Customers by Quarter49 reported attacks in the second quarter, down from 57 reportedattacks in the first quarter, with the region accounting for 18% of allreported attacks.The distribution of attacks by industry makes it immediately obviousthat the decrease in attacks between the first and second quarteroccurred primarily in the Public Sector, while the Commerce andEnterprise verticals remained nearly unchanged from the previousquarter, as seen in Figure 5. Attacks against the High Tech sectorgrew 60%, which appears to be an industry trend and not indicativeAmericas (154)APJ (67)of a large number of attacks against any single entity. While attacksagainst the Media and Entertainment vertical shrank a modest11%, the biggest reduction in attacks was seen in the Public Sectorvertical, which saw 26 fewer attacks than the quarter before, orslightly more than half (54%) the number of attacks reported in thefirst quarter.One of the most interesting aspects of the second quarter of 2014is the fact that Akamai saw a decrease in the number of repeatedattacks against targets, highlighted in Figure 6. In the secondquarter, attacks were reported by 184 different targets, the most sincetracking of the number of repeated attacks started. The percentageof customers that saw subsequent attacks shrank from one in four(26%) to nearly one in six (18%). Only two customers were targetedby DDoS attacks more than five times and the most attacks on asingle target were seven, as opposed to 17 in the prior quarter. Thereis no clear explanation as to why repeated attacks have become lesscommon, though this change in tactics came as a welcome respitefor their targets.Akamai has been analyzing Distributed Denial of Service (DDoS)attacks aimed at our customers for the State of the Internet Reportsince the end of 2012. The Akamai platform is a massively-distributednetwork of systems that is designed to serve Internet traffic fromsystems as close to the end user as possible. Part of the value of theAkamai platform is to enable our clients to deal with the suddenspikes in Web site requests, such as during holiday sales or flash mobscreated by news events. Malicious traffic often attempts to overloadsites by mimicking this type of event, and the difference is often onlydistinguishable through human analysis and intervention. Akamaicombats these attacks by serving the traffic for the customer whileEMEA (49)Commmerce(78)Media andEnterpriseEntertainment(80)(40)High gure 4: Q2 2014 DDoS Attacks by RegionFigure 5: Q2 2014 DDoS Attacks by Sectorwww.stateoftheinternet.com / 7
[SECTION] 1 SECURITY150Number of Attacks120906030012345 52013 Q31302753132013 Q410634114072014 Q112122114152014 Q2150198142Figure 6: Frequency of Repeated DDoS Attacksthe analysis is being performed and creating specific Web applicationfirewall rules or implementing other protections such as blockingspecific regions or ip addresses as necessary.wider public informed — links to the full posts can be found athttps://bitly.com/bundles/dbelson/2. What follows is a summary ofthe problem, and Akamai’s response to it.An additional aspect of the Akamai platform is that some of themost common methodologies that are used in DDoS attacks aresimply ignored. Attacks that target the lower levels of the tcp/ipstack, such as udp floods and syn floods, hit the edge of the Akamaiplatform and are dropped. Specifically, Layer 1 – 4 traffic does notcontain the information needed by Akamai to route it to a specificcustomer and is automatically assumed to be either malicious ormalformed traffic.Heartbleed is a bug in the tls heartbeat implementation where anadversary sends a request to be echoed back and specifies a lengthof the response to be echoed. Because the length to be echoed backis not checked against the length of the inbound request, a servercan respond with information that happened to be in memory: upto 64kb of it per request.The vast majority of attacks that Akamai is reporting on are basedon traffic in layers 5 – 7 of the tcp stack, such as volumetric attackslike http get floods and repeated file downloads or applicationand logical layer attacks, which req
addresses connecting to the Akamai Intelligent Platform, falling to over 788 million, or about seven million fewer than were seen in the first