Transcription
Received: 23 May 2018DOI: 10.1111/roie.12446 Revised: 15 August 2019 Accepted: 27 August 2019ORIGINAL ARTICLEThe impact of trade agreements on world exportpricesLisandra Flach1 Fabian Gräf21Ludwig-Maximilians-UniversitätMünchen, Munich, Germany2E.CA Economics, Berlin, GermanyCorrespondenceLisandra Flach, Department of Economics,Ludwig-Maximilians-Universität München,Ludwigstr. 28, Munich, Germany.Email: lisandra.flach@econ.lmu.dePresent addressLisandra Flach, Centre for EconomicPolicy Research (CEPR), London, UnitedKingdon and Center for Economic Studies(CESifo), Munich, GermanyFunding informationGerman Science Foundation, Grant/AwardNumber: CRC TRR 190AbstractThis paper uncovers new stylized facts on the relation between economic integration and world trade prices. Usingfree on board export price data for the universe of manufacturing products, we show that a country’s membership in theWTO (World Trade Organization) or in a PTA (PreferentialTrade Agreement) is associated with an increase in exportprices of differentiated goods. For the WTO, this effect iscaptured by the countries that were subject to rigorous WTOaccession procedures. We also exploit the importance of thedepth of a PTA and of its different provisions. Whereas theeffect of the depth per se is not significant, individual provisions evoke distinct effects on prices. In particular, we findthat PTAs with provisions on investments are associatedwith higher export prices. The results are consistent withtheoretical models that relate competition to the innovationbehavior of firms.JEL CLASSIFICATIONF13; F14 1IN T RO D U C T IONA large empirical literature has investigated the trade promoting effects of membership in the WTOand in PTAs.1 However, little is known about the effect of trade agreements on world trade prices.2Membership in trade agreements lowers trade barriers on imported goods, which decreases exportprices through a cost‐reducing effect. In contrast, lower trade barriers might increase access to morevariety and better quality products (see Amiti & Khandelwal, 2013; Fan, Li, & Yeaple, 2015), affectThis is an open access article under the terms of the Creative Commons Attribution License, which permits use, distribution and reproductionin any medium, provided the original work is properly cited. 2019 The Authors. Review of International Economics published by John Wiley & Sons Ltd168 wileyonlinelibrary.com/journal/roie Rev Int Econ. 2020;28:168–208.
FLACH and GRÄF 169markups (Goldberg, Khandelwal, Pavcnik, & De Loecker, 2016) and firm decision over higher qualityproduction (Chisik, 2012), leading to a positive impact on prices. Moreover, whereas tariffs capture animportant part of the effect of trade agreements on prices, other mechanisms have been suggested bythe literature, such as changes in the regulations and investment rules between members (see Baier &Bergstrand, 2007; Ossa, 2016).3 Hence, the net effect on export prices is a priori unclear.This paper conducts a comprehensive analysis of world trade flows at the product level to investigate the reaction of export prices to membership in the WTO and/or in PTAs and highlights amechanism to explain the results. One important advantage of our approach is the use of highly disaggregated FOB (free on board) export price data from BACI (international trade database), whichis particularly suitable for the analysis of prices, as it is the unique database that provides consistentvalues at the world and product level.4Using 16 years of data with roughly 125 million observations for all countries and all manufacturing traded products, we uncover new stylized facts. First, we show that a country’s membership in theWTO and/or in a PTA is associated with an increase in export prices of differentiated goods, whereasfor homogeneous goods the effect is not robust and almost never significant. For the WTO, we showthat the effect is captured by the countries that were subject to rigorous WTO accession proceduresand not to accession under Article XXVI 5(c).5 Moreover, for intermediate goods, we show that themembership effect is only significant when the importer joins the WTO.Second, we go beyond the analysis of membership in PTAs as a binary variable. Using a newlyreleased dataset on the different provisions negotiated in an PTA, we investigate the importance ofthe depth of the agreement. We find that the effect of the depth on prices is not significant, but thatindividual provisions have distinct effects on prices. In particular, we find that PTAs with provisionsrelated to investment are associated with higher export prices.Although the aggregate data at the product level hides important composition effects (we discusscomposition effects in the next section), our main results constitute evidence consistent with modelsthat relate trade liberalization to innovation, product quality and endogenous markups. In particular,the positive effect on prices of differentiated goods (which have scope for quality differentiation) andthe fact that only importers respond in the case of intermediate goods are consistent with a model inwhich the quality of inputs increases following trade liberalization (see Fan et al., 2015).Concerning the second stylized fact, the positive price effect for PTAs with provisions related toinvestment is likely associated with quality upgrading. As discussed by Amiti and Khandelwal (2013),quality upgrading is one important element of investments in research and technology. In Amiti andKhandelwal (2013), for firms close to the technology frontier (measured by the degree of quality differentiation), the increase in competition following trade liberalization can increase the incentives toinvest and innovate.6 Using product‐level data on exports to the United States, they show that for firmsselling high‐quality products, low import tariffs promote investment and quality upgrading. Empiricalevidence in Bustos (2011) shows that trade liberalization leads to more investment in innovation.The effect of trade liberalization on prices was a priori unclear. On the one hand, we could haveexpected a negative effect of liberalization on prices. Following heterogeneous firms, models, aggregate productivity rises as resources are reallocated towards more productive firms (e.g., Melitz,2003; Pavcnik, 2002). Hence, when trade barriers fall, input prices decrease, such that firms relyingon intermediate inputs face lower marginal costs and charge lower export prices.7 On the other hand,the literature has shown at least two mechanisms by which lower trade barriers promote innovationand access to better inputs, which leads to quality upgrading and higher prices. Amiti and Khandelwal(2013) show that lower import tariffs promote quality upgrading for products close to the technologyfrontier, as it increases import competition. Fan et al. (2015) show that lower import tariffs followingChina’s WTO membership are associated with higher export prices, as exporters gain access to higher
170 FLACH and GRÄFquality inputs. Finally, a literature on trade disputes has shown a positive relation between trade agreements and the decision over higher quality production. For instance, Chisik (2012) provides a theoretical framework in which firms inefficiently choose lower levels of quality production when harmfultrade disputes are more common. In this framework, deeper trade relationships coming from an environment of more transparency and macroeconomic stability affect the production of higher quality.8Our empirical results suggest that, for differentiated goods, the positive price effect dominates thecost effect. Moreover, as expected, prices of homogeneous goods are by large unaffected.9 Althoughwe do not draw direct policy implications, our results indicate that, if we consider only the cost‐reducing effect of trade agreements and disregard innovation and quality upgrading following tradeliberalization, the welfare effects from trade agreements might be wrongly estimated.We conduct several robustness checks. First, we exploit information on the time gap between WTOapplication and accession. Second, we investigate the possibility that PTAs have delayed effects onprices. Third, we check the residuals of the regressions on prices for new members (four years beforeWTO or PTA membership) and a control group (referring to non‐members and old members). Weshow that prior to accession, the price behavior of the two groups is very similar. Finally, we exploitheterogeneous effects of trade agreements for countries that joined the WTO under Article XXVI 5(c)in comparison with countries that were subject to rigorous accession procedures. We show that theeffect of membership on prices comes entirely from countries that committed to trade policy.2 R E LATE D L IT E R AT U R EOur paper offers a first attempt to measure the effect of trade agreements on FOB export prices atthe world and product level. We also disentangle the effects of different provisions within PTAs onprices. However, the data we use at the product level hides substantial composition effects. The priceresponse to trade liberalization might reflect quality upgrading within the firm as well as changes inthe share of sales across firms within product categories. One example of a paper that investigatesfirm responses and composition effects is Fan et al. (2015). They show that lower import tariffs induceChinese firms to upgrade quality and raise export prices of differentiated goods, whereas this effect islower or nonexistent for homogeneous goods.10Moreover, an additional channel that explains changes in prices is the incomplete pass‐throughfollowing trade agreements (see Goldberg & Pavcnik, 2016). As we discuss in Section 4.2, the priceeffect we observe could in part reflect changes in markups following trade liberalization, besidesproduct quality. However, as in most of the literature,11 it is beyond the scope of this paper to disentangle the quality effect from changes in markups. In particular, because changes in markups tend tobe higher for high‐quality goods.Nonetheless, by uncovering new stylized facts, our results uncover the direction of price effects andhighlight the importance of product quality and further channels to explain trade prices.Finally, our paper is related to Breinlich, Dhingra, and Berlingier (2018), who estimate the welfareeffect of FTAs for countries within the European Union (EU). Using aggregate data from Comtrade,they provide a detailed analysis of the decomposition of welfare effects in the EU into variety gains,quality, and lower prices. We are rather interested in the price effects of membership in the WTO andPTAs for different types of goods, as well as in the importance of the different provisions within anagreement. For our research question, one advantage is the use of BACI data to calculate trade prices(see note 4 and data section).Moreover, whereas Breinlich et al. (2018) focus on welfare effects within EU countries, we investigate price effects for world export flows including developed and developing countries. This might
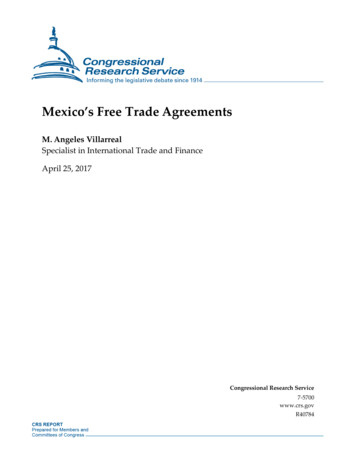
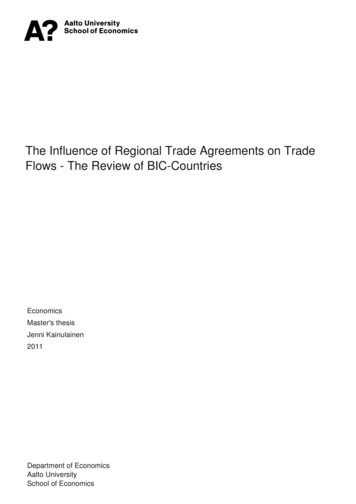
FLACH and GRÄF 171be important in particular for the quality channel. As discussed in Goldberg and Pavcnik (2016),“developing countries are still substantially less liberalized than developed countries, and the role ofinternational trade in their growth and development remains one of the most interesting and policy‐relevant questions”.33.1 DATA A N D E MP IR ICA L D ESIGN DataWe use data on export flows at the six‐digit HS (Harmonized System) level over the period 1995 to2014 from BACI, which is based on the Commodities Trade Statistics database (Comtrade). Gaulierand Zignano (2010) use the Comtrade data to construct the BACI dataset with some modificationsthat make it especially suited to analyze trade prices (Gaulier & Zignano, 2010). They point out thattrade flows in the Comtrade dataset can be reported in four different ways: (i) the exporter reports thetradeflow in FOB values; (ii) the importer reports the tradeflow in CIF (cost, insurance, freight) values; (iii) both trade partners report the trade flow; or (iv) none of the countries reports the trade flow.BACI, in contrast, provides consistent values at the world and product level.12The six‐digit HS classification distinguishes more than 5,000 different products and covers theyears 1995 to 2014 and 250 countries and territories. Because of the large number of observations, wecreate 4‐year averages of the time‐dependent variables, such that the final data used in the paper contains five time periods and roughly 33 million observations. Export prices are proxied by unit values,as described in detail in the Data Appendix.Data for the explanatory variables of interest—WTO membership and membership in a PTA—stem from two different sources. Michael Tomz provides data for WTO membership until 2001 onhis website (Tomz, Goldstein, & Rivers, 2007), which are used to analyze the impact of GATT/WTOmembership on trade (see details in the Data Appendix). We complete the dataset until the year 2014using information from the official WTO website (WTO, 2016). For each country, we create a dummyvariable that is one if a country has joined the WTO in the period and zero otherwise, and use furtherinformation in the robustness checks. The bilateral variable for WTO (WTOij𝜏) takes on values of zero,one and two; zero when neither i nor j were part of the WTO in period τ, one when one of the two isa member, and two when both are members. A detailed description is provided in the Data Appendix.Besides GATT/WTO membership, we investigate the price effect of membership in PTAs. Thenew Design of Trade Agreements (Desta) database constructed by Dür, Baccini, and Elsig (2014)provides information on PTAs. We include a dummy that indicates if a PTA exists as well as a depthmeasure. The Appendix contains further information on how we calculate the PTA variables. We usea depth measure that counts the number of provisions in certain areas (tariff reduction, intellectualproperty rights, procurements, standards, services, investments, and competition) that are covered byan agreement. Hence, this depth measure ranges from zero (if a PTA exists but none of the provisionsis covered, e.g., Protocol on Trade Negotiations) to seven (e.g., NAFTA—North American Free TradeAgreement). If the same country pair is a member in multiple agreements, we include the agreementwith the greatest depth value.The two maps (Figures 1 and 2) present a cross‐country comparison of PTAs in the 5th time period,which corresponds to the years between 2011 and 2014. Figure 1 shows the mean depth of all PTAagreements for every single exporter in period 5—for every exporter in the sample, we calculate themean depth of the PTAs in which the country is a member. It depicts that on average deeper PTAs arenegotiated with countries in North and Central America, Europe, and East Asia, whereas PTAs withcountries in Africa and Central Asia seem on average rather shallow.13 In the Appendix Figure A1
172 FLACH and GRÄF0 - 3 (88)FIGURE 14 - 7 (92)No data (35)Depth of PTAs, 2011–20141 - 30 (53)FIGURE 23 - 4 (20)30 - 46 (52)46 - 67 (45)67 - 134 (50)No data (35)Number of partner countries in PTAs, 2011–2014we exploit changes over time using the difference between the last (2011–2014) and the first (1995–1998) period. On average for the exporter, we observe an increase in the depth measure for manycountries, in particular in several Eastern European and South American countries. Although the mapin differences provides an interesting contrast to Table 1, the depth measure shown in Figure A1 is lessinformative than Tables 1 and 3 because of the high level of aggregation.14The second map (Figure 2) shows the average number of partner countries of each exporter, that is,the average number of countries that have a common agreement with a particular exporter. Countriesin Europe and Africa have the highest average number of partner countries. While the high number ofpartner countries for Europe is of little surprise, the number of partner countries in Africa is mainlydriven by some PTAs with many members such as the African Economic Community that alone has51 members and covers two provisions. In the Appendix Figure A2 we exploit changes over timein the average number of partners, using the difference between the last (2011–2014) and the first(1995–1998) period.Data for the other explanatory variables, real GDP and tariffs, come from the Penn World Tabledatabase, version 8.1 (Feenstra, Inklaar, & Timmer, 2015) and the World Integrated Trade Solution(WITS) database (World Bank, 2016), respectively. In the Appendix we explain the transformationsmade to construct the tariff data.
FLACH and GRÄFTABLE 1 173Explanatory variables over timePeriod 1Period 2Period 3Period 4Period ��2014WTO Variables after 1995WTO member1321431481521581,2451,1831,1351,1191,077PTA Depth Measure0 depth PTA1 depth PTA4157591,5821,3731,3732 depth PTA1,4631,4001,4971,4961,4903 depth PTA1,1721,3431,4241,3121,2934 depth PTA1942283185075375 depth PTA1992523994584596 depth PTA1935751351447 depth PTA3714403688Note: Change of explanatory variables over time. Unit of variation for WTO, countries; unit of variation for PTAs, country pairs. Thedepth measures reflect the depth of a shared agreement ranging from zero to seven. Each time period consists of 4 years. The difference in WTO members between time period 5 and 1 does not equal 32 as in the Appendix table since six countries joined the WTO inthe first time period.TABLE 2WTO accessions between 1995 and 2014Accession countryAccession yearAccession countryAccession Cape Verde2008China2001Congo, Democratic Republic ia2001Taiwan2002Mongolia1997Moldova, Republic n Federation2012Saudi Arabia2005Viet **2003Samoa2012Yemen2014*Laos: Lao People’s Democratic Republic; **Macedonia: The Former Yugoslav Republic of Macedonia.Table 1 shows how the main explanatory variables—WTO membership and the depth measures forPTAs—evolve over the observed time period 1995 to 2014.The first variable in Table 1 counts the number of WTO members over time. The list of countriesthat became members of WTO in every year is shown in Table 2.
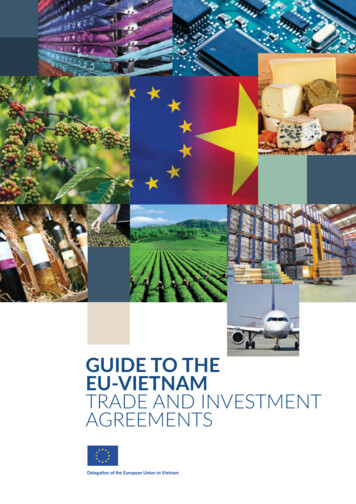
174 FLACH and GRÄFTABLE 3Number of different provisions over timePeriod 1Period 2Period 3Period 4Period ��2014Competition1,3091,3901,6672,1522,475Full tariff 2,24136444,8215,0885,387Note: Number of provisions per country pair in different time periods. For example, in time period 11,309 country pairs were members of a PTA that included a provision on competition.Abbreviations: IPRS, Intellectual property rights.The following variables in Table 1 describe the depth of the PTA. We count the country pairs thatare members of a PTA with a certain depth measure at a certain time; for example, in time period 1(1995–1998) 1,172 country pairs were members of a PTA with depth measure 3. A common patternthat we observe is that the number of country pairs that are members of “deeper” PTAs increases overtime. The number of country pairs with “shallow” PTAs increases until period 3 and declines slightlyafterwards. Only the number of country pairs with the most “shallow” PTA consistently declines. Tobetter describe the importance and heterogeneity of PTAs in terms of the provisions, Table 3 showshow many country pairs are governed by the single provisions. For instance, in the first period 1,309country pairs were members of a PTA that included a provision on competition.The description of all variables and summary statistics are shown in Table A2.Figure 3 plots a further pattern in the data. We show the quantity traded both before and afterWTO membership for products in different export price categories. We divide products into tertileswithin each industry, based on price categories according to their export prices in the period before achange in WTO status. To make products comparable, quantities are standardized to unity in the before period, and the tertiles are created within every two‐digit industry. The figure shows that the tradevolume increases for all price categories following WTO membership. This general result could bedriven by a common time trend. However, it is interesting that the traded quantities of products with anexport price in the highest tertile in the before period increase the most, whereas products with pricesin the lowest tertile the least. Hence, the increase in prices that we observe in our empirical analysis islikely not due to lower sales. One plausible explanation for the increase in traded quantities of goods inthe highest tertile (within an industry) is quality upgrading of goods close to the frontier (with high degree of quality differentiation). As shown by Amiti and Khandelwal (2013), by increasing competitionand the incentives to innovate, trade liberalization is associated with quality upgrading for productsclose to the world quality frontier, whereas the opposite holds for products distant from the frontier.3.2 Empirical designTo investigate the reaction of trade prices to trade agreements, we start with a very simple linearspecification including interacted importer–exporter–product fixed effects as well as period fixed effects, as follows:ln pkij𝜏 𝛽0 𝛽1 trade agreementij𝜏 𝛽2 Xkij𝜏 𝛿𝜏 𝜔kij 𝜖kij𝜏(1)
175 &KDQJH LQ 4XDQWLW\ FLACH and GRÄF%HIRUH%HIRUH DQG IWHU D &KDQJH LQ :72 6WDWXVORZ SULFHG JRRGVKLJK SULFHG JRRGV IWHUPHGLXP SULFHG JRRGVF I G U R E 3 Trade volume before and after WTO membership, for different groups of products (tertiles of priceswithin an industry). Note: We divide products into tertiles of export prices. The figure shows the quantity tradedbefore and after WTO membership (quantities are standardized to unity in the before period), for the three groups ofproducts. Trade quantities increase for all groups following WTO membership, but foremost for products in the thirdtertile of export prices (high‐priced goods)where pkij𝜏 is the FOB export price measured as unit value of product k exported from country i to countryj at time τ. trade agreementij𝜏 either represents WTO membership (WTOij𝜏) or membership in a PTA(PTAij𝜏). For PTA, we create a dyadic, time‐variant dummy variable. In contrast, for WTO we exploit differential effects for importer and exporter membership. We start by investigating the effect of both countries being members of WTO (WTO Both) on prices, and then go on to investigate the effect separatelyfor importer and exporter (WTO Importer and WTO Exporter, respectively). Moreover, we also createWTO as a variable taking the values zero, one, and two depending on whether only one or both are WTOmembers.15 𝜔kij represents interacted product–exporter–importer fixed effects and 𝛿𝜏 period fixed effects.There is little theoretical guidance regarding the correct set of control variables Xkij𝜏 when it comesto the analysis of trade prices. We provide results with and without control variables. As control variables, we include the logarithmized interaction of real GDP (ln(GDPi𝜏 GDP j𝜏)) and in some specifications the tariff variable averaged over 4 years (tariffijk𝜏). In Section 5, we conduct further robustnesschecks including additional control variables. One of the reasons to include GDP in the baseline specification is to explore the possibility that terms of trade motivations affect our results. From standard tradepolicy we expect that, when the trade partner cuts tariffs and they are large (measured by country size),then the world demand for the country’s exported goods increases and, in turn, so does the price of theexported products—which improves the country’s terms of trade. A second reason is to relate marketsize to export prices: in trade models with firm heterogeneity and CES preferences, the cutoff marginalcost increases with market size of the destination country and the average export price to export from ito j increases in size.16 Hence, as a proxy for size, we expect that GDP of the destination country may influence trade prices.17 However, we also show that our results are not sensitive to the inclusion of GDP.Note that, given the large number of fixed effects when we include interacted HS six‐digit product–importer–exporter fixed effects and period fixed effects in a sample with over 33 million observations,it is computationally cumbersome and inefficient to include additionally importer–product–periodand exporter–product–period fixed effects. In the robustness check section, we account for multilateral resistance terms in two ways, (1) using tetrads as in Hallak (2006) and Head, Mayer, and Ries(2010) and (2) we conduct the analysis in first differences, which allows for the inclusion of multilateral resistance terms.18
176 FLACH and GRÄFWe cluster the errors in the same dimension as the fixed effects, that is, we use two‐way clusteringby importer–exporter–product and by time groups, which has important implications for the interpretation of the standard errors and p values. We discuss clustering later in the paper. 𝜖kij𝜏 is the errorterm.In a second step, we investigate the differential effects for different types of goods and differenttypes of trade agreements. We divide goods in homogeneous (HOM goods) and differentiated goods(DIFF goods) following Rauch (1999). In this case, we interact the variable trade agreementij𝜏 withindicator variables for HOM goods and DIFF goods.According to the literature on quality upgrading as a response to a fall in tariffs (e.g., Fan et al.,2015), we expect the positive effect of trade agreementij𝜏 on prices to be driven by differentiatedgoods.Finally, we investigate the importance of the depth of a PTA, as follows:ln pkij𝜏 𝛽0 𝛽1 PTAij𝜏 𝛽2 PTAij𝜏 depthij𝜏 𝛿𝜏 𝜔kij 𝜖kij𝜏(2)where PTAij𝜏 is a dummy variable that indicates the presence of a PTA, as before, and depthij𝜏 indicatesthe number of provisions in certain areas (tariff reduction, intellectual property rights, procurements,standards, services, investments, and competition) that are covered by a PTA. The depth measure rangesfrom zero (if a PTA exists but none of the provisions is covered, e.g., Protocol on Trade Negotiations) toseven (e.g., NAFTA). All estimations include exporter–importer–product fixed effects.Additionally, we disentangle the depth measure in its seven provisions to get an insight on howthey affect export prices:ln pkij𝜏 𝛽0 𝛽1 PTAij𝜏 7 𝛽p 1 PTAij𝜏 provisionij𝜏p 𝛿𝜏 𝜔kij 𝜖kij𝜏(3)p 1where provisionij𝜏p is an indicator taking one if a particular provision is covered and zero otherwise. Allestimations include exporter–importer–product fixed effects.In all results, we use two‐way clustering by i j k and by time groups (see Cameron, Gelbach, &Miller, 2011). Besides the standard clusters by by i j k, clustering over time is crucial in the contextof our paper. As shown for instance in Cao and Flach (2015), there is a negative dependence of thestandard deviation of prices on WTO membership. Hence, without correction, the error term wouldlikely be heteroskedastic.4 E M P IR ICA L R E SU LTSThe first results for the effect of WTO and PTAs on prices are shown in Tables 4 and 5. The estimationstrategy corresponds to Equation 1. The results include interacted six‐digit product–importer–exporterfixed effects as well as time fixed effects. In robustness checks we include further groups of fixedeffects to account for multilateral resistance terms. Moreover, crucial for our analysis, all results arereported using FOB export prices, that is, the prices at the port of shipment, excluding transportationcosts and other costs associated with insurance and unloading.All results in the paper are reported using 4‐year averages, which yields a sample of roughly33 million observations. Besides computational gains, taking averages also allows us to deal withissues related to serial correlation and the adjustment of standard errors (see Bertrand, Duflo, &Mullainathan, 2004). This is important in our framework because of the three following reasons. Inour paper, we deal with (1) long time series, (2) the dependent variable (price) is highly positively
FLACH and GRÄFTABLE 4 177Results for WTO and PTA(1)WTO 5)(0.0139)(0.0279)(0.0139)WTO Both DIFF0.0786**0.0826**(0.0263)(0.0267)WTO Both HOM0.02930.0336(0.0360)WTO ExporterWTO .0154)(0.0159)ln(GDPi𝜏 GDP 33,161,90133,161,901Adjusted R0.7930.7930.7930.7930.7930.793Fixed effectst & ijkt & ijkt & ijkt & ijkt & ijkt & ijk2Note: Robust standard errors are shown in parentheses.Abbreviations: DIFF, differentiated; HOM, homogeneous.***,**,* Denotes significance at the 1%, 5%, and 10% level, respectively. Robust standard errors two‐way clustered by importer–exporter–product and time groups, see Cameron et al. (2011).serially correlated, and (3) the independent variable (trade agreementij𝜏) changes little over time(WTO member or not, PTA member or not). As discussed in Bertrand et al. (2004), in this setting,these three factors reinforce each other, so that the standard error of 𝛽1 in the empirical model shownin Equation 1 could understate the standard deviation of 𝛽1. Hence, serial correlation is an especiallyimportant concern in our framework, in particular in a co
and in PTAs.1 However, little is known about the effect of trade agreements on world trade prices. 2 Membership in trade agreements lowers trade barriers on imported goods, which decreases export prices through a cost‐reducing effect. In con