Transcription
Web Intelligence to Power BI ConversionAs SAP and Microsoft analytics experts we are often asked to support customers transitioning from theirexisting analytics tools to a new reporting tool, this can happen when a new requirement exceeds theexisting tools capabilities or a new parent company introduced to the business has a pre-determinedanalytics strategy with another analytics tool.This blog explores some of the considerations of a recent requirement to convert an existing WebIntelligence report within an SAP BusinessObjects platform to the new analytics environment of a Power BIreport.Conversion StrategyExamine the current report purpose and structureThis is a report which shows the work done for a specific customer during a time period. It is usually runweekly for the customer to track the work undertaken in the last week.It is manually run, exported to PDF and emailed, rather than automatically scheduled, so that there is alwaysan internal check that the timesheets which feed the report have been completed in full.It includes A work breakdown structure type hierarchy with summary of time worked at each level:o Type of work (billable/non-) - Project - Work itemA filter/prompt on date range and customerDetail-level timesheet data
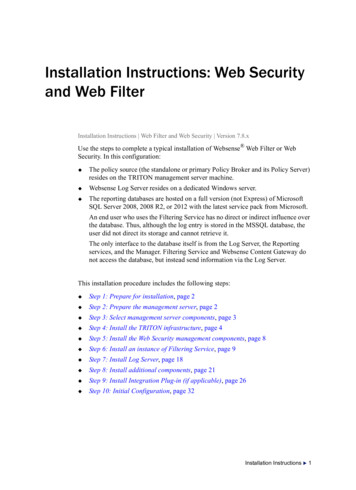
Improvements that could be made, including considering wholesale redesignLook to automate the distribution. Rejected (would require additional work to automate check that timesheets are completed in full)Use Power BI’s matrix visual rather than Web Intelligence’s section-based approach to show hierarchy level AcceptedHave we chosen the right toolPower BI’s primary use case is visualisation and manipulation of aggregated data and there are tools thatare focused more on detail data, such as Reporting Services or Report Builder. However Power BI is easilyable to handle this requirement and the customer who will be the first recipient of this report is keen to usePower BI for all possible reporting requirements, so this example is a good case in point for an operationalscenario.Investigate the dataThe report is driven from a single universe:
It contains a single query from a SQL Server database:Data strategyThe main choice we have is copy the query (which Business Objects dynamically created) and embed it as the hard coded datasource of the Power BI reporto faster to buildo - it limits Power BI’s ability to optimise the queryo - it limits (although does not prevent) our ability to modify the report data loadcreate a Power BI model from the same source dataAs this is a one-off report which we don’t plan to expand our to other requirements we will take the firstoption. If at a later date we want to expand the requirement we can swap it over to a Power BI model infuturedscallards.com
Recreate the ReportDefine the source dataIn this instance we have decided to re-use the Business Objects-generated rather than create a Power BImodel. Looking at the Get Data option, Blank Query would seem the obvious choice. However this gotchaactually refers to an M query (Power BI’s data transformation language)To use a pre-built SQL query, we first select the database connector, in this case SQL ServerWe need to enter the connectivity information for the database we want to query. If you don’t this you canfind it (apart from the password) in the universe connection. NB for this information you need to view theconnection stored in the repository, not the one retrieved to the IDT.
The query contains a Business Object variable (which is how the date is dynamically filtered). This returnsan error.We select Edit then remove both the data and the customer constraint, hence the whole WHERE clause:We need to be aware of any performance implications as this query will now return all records for allcustomers. We could of course include a different WHERE clause at this point.As we all now returning all customers’ projects we need to add customer name to the query:
Review the dataThe data runs and we now have all required data available within a Power BI model, for which we can viewthe data itself and the data profiling information:Create the outputWe need to recreate any report-level calculations:Add logo, report title (formula above) and date filter to report header:Recreate the hierarchy (add level by right clicking a field and selecting Add to hierarchy:
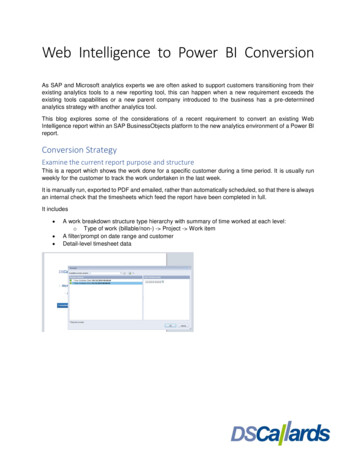
Add a matrix visual with the Work Date and Work Type Hierarchy as rows and Days Worked as Values.Add a report-level filter to select Customer:Publish the report to the cloud. NB the Power BI Data Gateway is required in order to refresh the reportfrom the cloud
The report is available online (with necessary access rights). Data update date is displayed in the dark topbanner:Export to PDF from the browser:
EvaluationHaving tested several weekly periods, the data always fits on a single page comfortably. If it exceeds apage, multiple exports would be necessary. As the export is intended to be manual, to provide the crosscheck on completion of timesheets, this is acceptable. If the distribution was to be automated the possibilityof truncation would be unacceptable and require using instead a paginated tool such as Reporting Servicesor Report Builder.Written by Angus Menter, BI Services Managerdscallards.com DSCallards
The report is driven from a single universe: It contains a single query from a SQL Server database: Data strategy The main choice we have is copy the query (which Business Objects dynamically created) and embe