Transcription
2017 Investor Presentation
Forward-looking statements andnon-GAAP financial informationThis presentation includes fo a d-looki g state e ts ithi the ea i g of the fede al se u ities la s. You a ge e all ide tif the o pa ’s fo a d-lookingstate e tso ds su h as a ti ipate,elie e, ould, esti ate, e pe t, fo e ast, outlook, i te d,a , possi le, pote tial, p edi t,p oje t, seek, ta get, ould,a , should oould o othe si ila o ds, ph ases o e p essio s that o e the uncertainty of future events oroutcomes. The company cautions readers that actual results may differ materially from those expressed or implied in forward-looking statements made by or onbehalf of the company due to a variety of factors, such as: the fi alizatio of the o pa ’s fi a ial state e ts fo the fou th ua te a d th ee ea s e dedDecember 31, 2016, including the actual impact of the adoption of mark-to-market accounting; the o pa ’s a ilit to ealize the e pe ted e efits of the spi off;the costs associated with being an independent public company, which may be higher than anticipated; deterioration in world economic conditions, or in economicconditions in any of the geographic regions in which the company conducts business, including additional adverse effects from global economic slowdown, terrorismor hostilities, including political risks associated with the potential instability of governments and legal systems in countries in which the company or its customersconduct business, and changes in currency valuations; the effects of fluctuations in customer demand on sales, product mix and prices in the industries in which thecompany operates, including the ability of the company to respond to rapid changes in customer demand, the effects of customer bankruptcies or liquidations, theimpact of changes in industrial business cycles, and whether conditions of fair trade exist in U.S. markets; competitive factors, including changes in market penetration,increasing price competition by existing or new foreign and domestic competitors, the introduction of new products by existing and new competitors, and newte h olog that a i pa t the a the o pa ’s p odu ts a e sold o dist i uted; ha ges i ope ati g osts, i ludi g the effe t of ha ges i the o pa ’smanufacturing processes, changes in costs associated with varying levels of operations and manufacturing capacity, availability of raw materials and energy, theo pa ’s a ilit to itigate the i pa t of flu tuatio s i aate ials a d e e g osts a d the effe ti e ess of its su harge mechanism, changes in the expectedcosts associated with product warranty claims, changes resulting from inventory management, cost reduction initiatives and different levels of customer demands, theeffe ts of u pla ed o k stoppages, a d ha ges i the ost of la o a d e efits; the su ess of the o pa ’s ope ati g plans, announced programs, initiativesand capital investments (including the jumbo bloom vertical caster and advanced quench-and-temper facility), the ability to integrate acquired companies, the abilityof acquired companies to achieve satisfactory operating results, including results being accretive to earnings, the o pa ’s a ilit to ai tai app op iate elatio swith unions that represent its associates in certain locations in order to avoid disruptions of business; and availability of financing and interest rates, which affect theo pa ’s ost of fu ds a d/o a ilit to aise apital, the o pa ’s pe sio o ligatio s a d i est e t pe fo a e, a d/o customer demand and the ability ofusto e s to o tai fi a i g to pu hase the o pa ’s p odu ts o e uip e t that o tai its products. Additional isks elati g to the o pa ’s usi ess, thei dust ies i hi h the o pa ope ates o the o pa ’s oo sha es a e des i ed f o ti e to ti e i the o pa ’s filings with the SEC. All of these riskfactors are difficult to predict, are subject to material uncertainties that may affect actual results and may be beyond the compa ’s control. Readers are cautionedthat it is not possible to predict or identify all of the risks, uncertainties and other factors that may affect future results and that the above list should not beconsidered to be a complete list. Except as required by the federal securities laws, the company undertakes no obligation to publicly update or revise any forwardlooking statement, whether as a result of new information, future events or otherwise.The unaudited pro forma consolidated financial data in this presentation is subject to assumptions and adjustments described in the o pa ’s egist atio state e ton Form 10. Ti ke “teel Co po atio ’s Ti ke “teela age e t elie es these assu ptio s a d adjust e ts a e easo a le u der the circumstances . Theu audited p o fo a o solidated fi a ial data does ot pu po t to ep ese t hat Ti ke “teel’s fi a ial positio a d esults of operations actually would haveee had the spi off o u ed o the dates i di ated, o to p oje t Ti ke “teel’s fi a ial pe fo a e fo a futu e pe iod following the spinoff.This presentation also includes certain non-GAAP financial measures as defined by SEC rules. A reconciliation of those measures to the most directly comparable GAAPequivalent is contained in the Appendix. Please see discussion of non-GAAP financial measures in the Appendix.2
Business overview
History of delivering valuethrough focus on customer needsHistory and milestonesA 100-year-old start-up Wo ld’s la gestmanufacturer of EAFbearing steel and seamlessmechanical tubingBirth of a business: Opening of first steelplant in Canton, Ohio Most product sold toexternal customers TimkenSteel beginsoperation as an Launch of TimkenSteel process toindependentmanage extensive supplier networkcompany on July 1 Advanced manufacturingtechnologySupply chain focus:Business development: International expansion201720142000s1990s Timken RollerBearing CompanyfoundedDelivering value:1980s1970s1930s191718991915Fixing the base: Period of profitimprovement initiativesCustomer centric:Foundation: Steel businesscreated to addressTi ke ’s ea i gsupply and qualityneeds4Innovation: Demandingapplications drivenew developments Opening of Faircrestplant establishesleadership in SBQand seamlessmechanical tubing Focus on organic growth Enhanced manufacturingcapabilities Doubled capacityMade in America for 100 years. Strengthening ourhold on nichemarkets, using assetsto expand ourportfolio, buildingThe Next 100
TimkenSteel: At a glanceOverviewAlloy steel bars (SBQ) Headquartered in Canton, OhioTimkenSteel Applications Annual melt capacity of 2 million 60%1Value-added solutionsMachining, honing& drilling 30%1Componentstons Only focused North American SBQproducer Supplies over 30% of seamlessmechanical tube demand inNorth AmericaBearingsFuel injectorsGun barrelsCrankshaftsTri-Cone bits Percussion bits Energy CRAProduction CV joints GearHigh SBQ2016 net sales by end marketSeamless mechanical tubingQUALITYEnergy Other4%4%Low (Not SBQ)Industrial37% Fasteners Hand tools Leaf springsMobile55% Shopping carts Table legs Reinforcing barNon-TimkenSteel ApplicationsSource: TimkenSteel1 As a percentage of 2016 net sales5Supply chain 10%1
Focused in niche market sectors where we havecompetitive strengthGlobal finished steel productsUSA finished steel productsOur core product linesAsia and Oceana66%Other LongProducts141%EU-2810%NAFTA9%CIS3%Special BarQuality4%SeamlessMechanicalTubing 1%Our homemarketMiddle East3%Flat-Rolled54%Other Europe3%CentralandAfricaSouthAmerica3%3%World: 1,502 mm tonsSource: World Steel Association; American Iron and Steel Institute (2016)1 Other Long Products: Light Shapes, Reinforcing Bars, Merchant Bars, Wire, Pipe & Tubing6USA: 100 mm tons
Unique combination of processes, experience andsystems is a competitive advantageComplex order bookComplex planning environmentLarge 500 grades of steel 400,000 bar configurations, more for tubesMedium Over 500 customers 30 ton average order size Ship over 40,000 orders a year on average 7 manufacturing plants, 4 warehousesSmallSize range More than 10,000 customer specifications 90 major flow paths, 100 operations, 255 workcentersCarbonAlloyChemistry100% made to order products delivered at industry leading customer serviceSource: TimkenSteel over the cycle7
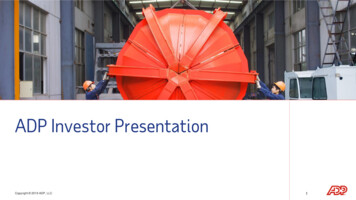
Broad size range strengthens our competitive positionApprox. market sector size2.6mm tons1.4mm tons0.7mm tons0.3mm tonsTimkenSteelNucor - MemphisSteel Dynamics PittsboroRepublic SteelGerdau012345678910Bar Diameter (Inches)6:1 Reduction1 – MachiningSource: TimkenSteel internal estimates as of 12/31/20161 Reduction ratio is a critical quality measure for machining applications.8111213141516
A leading producer of seamless mechanical tubingU.S. tubing landscape1Seamlessmechanical; 2%Differentiation Largest domestic capacityPressure; 1%Structural ; 21%OCTG; 19% Broadest size range .to. Heavier wallsStainless; 1% Higher value – added niche volume andalloy grade categoriesStandard; 13% Leading producer of quench and temperedcapabilityLine Pipe; 24%Weldedmechanical; 19% Custom grades, small order sizes,demanding applications make barrier toentry difficult12.1mm annual tons - welded and seamlessSource: 2016 Preston Pipe and Tube Report1 The chart is organized from lightest to darkest shading, with the darkest shading denoting the highest material value and performance.9
Meeti g our custo ers’ high-performance needsValue propositionEnergyKey customers On and off-shore drilling and completion applications Offerings are valued and trusted by industry leaders Unique and integrated supply chain solution set which combines highperformance materials, unmatched thermal treatment, proprietarymachining processes and responsive delivery capabilities Diverse industrial applications where performance is critical in a variety ofIndustrialend markets including mining, rail, agriculture, military, machinery andmore Manufacturing flexibility supports large scale assets with small scalesolutions Trusted, long-term, reliable supplier Known for our leadership in quality, consistency, and technical support Broad experience fostering deep material, application, and process knowMobilehow that creates value Critical automotive applications where high performance is required,primarily engine, transmission and driveline componentsSales channelDistribution10Source: TimkenSteel National Oilwell VarcoSchlumbergerHalliburton (via distribution)FMC TechnologiesEllwood GroupDril-Quip TimkenCaterpillarBrencoEllwood GroupCanton Drop ForgeGeneral DynamicsGeneral MotorsFordHondaNissanToyotaFiat Chrysler AutomobilesKey customers Selected distribution channel partners le e agi g o e a othe ’s st e gths Authorized service centers valued for differentiated supply chain solutions Wide yet tailored offering of sizes, value levels and quantities Reliance Steel &Aluminum A.M. Castle Eaton Steel Marmon Keystone
TimkenSteel applications in autosEngine 35% Crankshafts Connecting rods Fuel componentsTransmission 45% Sun, ring, pinion and 11planetary gearsCVT pulleyDrive gearsShaftsHubs Driveline 20%Bearing hubsRing gearsDrive pinion gearsSide gearsAxle tubingSteering knucklesCV Joint housing and cages
Automotive market peaking at record high levelNorth American light vehicle production 018E2019E2020E15.413.112.611.98.620082009Source: IHS Automotive 20161220102011201220132014
TimkenSteel industrial applications Bearings components Connecting components Driveline/axle components 13Engine componentsGround engaging toolingHydraulic componentsMissile components and projectiles Planetary gear components Steering components Track componentsTransmission componentsDrillingOthers
Key industrial economic indicators have trendedpositivelyU.S. manufacturing PMI index, seasonally adjustedU.S. Consumer Sentiment .0 48.298.2100Index value (1966 t-16Dec-1640Jun-06Mar-08Dec-09Sep-11Source: University of MichiganSource: Institute for Supply Management14Jun-13Mar-15Dec-16
Demanding applications require our unique productand process capabilitiesVertical and horizontal drilling applicationsCompletion and deepwater drilling applicationsCustom-crafted, reliable solutions that address the distinct needs of the energy industry15
Oil & Gas OutlookU.S. footage drilled by type (million feet)Dry 32019E2020ESource: Spears Drilling Production Outlook (Dec 2016)Spot WTI prices ( /bbl) 95 94 98U.S. average rig count1,874 93 62 49201120122013201420151,7621,862 731,079983 53708 4320161,1808705092017E 2018E 2019E 2020ESource: Spears Drilling Production Outlook (Dec 2016) & Energy Information Association16 701,9192011201220132014201520162017E 2018E 2019E 2020ESource: Spears Drilling Production Outlook (Dec 2016) & Baker Hughes Rig Count
Maximizing our assets and process paths to servicediverse industriesFaircrest SteelPlantHarrison SteelPlantGambrinus SteelPlantScrapMeltMeltPierce1.1mm tons per year0.75mm tons per year0.50mm tons per yearRefiningRefiningSoaking pitsBloom re-heatRolli g Mill36“ Rolli gThermal treat0.485mm tons per yearHarrison rolling millPrecision sizing millillBar finishingBillet cuttingTube finishingBar finishingBillet conditioning17ShipBar ShipTube ShipTruck & railcarTruck & railcarTruck & railcarCustomers orvalue-added plantsCustomers orvalue-added plantsCustomers orvalue-added plantsBarsTubesBloomsBillets to pierceMain operations
Investing for growth and competitive strengthJumbo CasterLadle refining station 200m investmentcommissioned 3Q 2014 125k tons added capacity 10% yield improvement Flexible capacity in all markets Proprietary tundish design Superior cleanness for standcast products Broader capability to supporthigher value SBQ and seamlessmechanical tube marketsIn-Line Forge PressIntermediate Finishing Line (IFL) 35m investmentcommissioned April 2013 2% yield improvement 40k ton increase in rollingcapacity Achieves requiredsou d ess up toa Entrance to new markets Unique in-line processeates fo ged i te alquality with rolling millprecision and productivity18 25m investmentcommissioned April 2013 Exotic and new grades Steel cleanness and tightchemistry control Steelmaking capacity for 40kadditional finish tons Ensures steel is deliveredwith correct chemistry,cleanness, temperature andtime 50m investmentcommissioned April 2013 65% cycle time reduction 40% labor productivity State-of-the-art finishingprocesses Enhanced safety andenvironmental controls
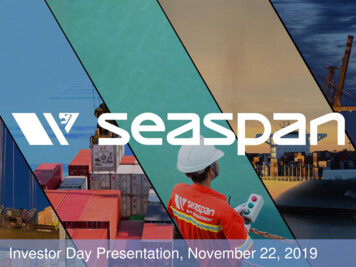
Benefits of continuous cast – yield improvement andproductivityBottom pourContinuous castTop CropBottomCropRunner &Trumpet LossLiquid to bloom yield 85%19Liquid to bloom yield 95%
Quench-and-tempercapabilities:Changing drilling technologyBackground / scope Multiple thermal treatment options made availablesince 1980s to meet customer needsProcessing / capabilities General Thermal Treatment Facilities: 10 car-bottom furnaces,five roller-hearth furnaces, one tunnel-hearth furnaceContinuous Thermal Treatment Facility: “izes up toidiameterInduction Thermal Treatment Facility: “izes up to idiameterQuench-and-Temper Facility: “izes up to i dia eteCOMING SOON: Advanced Quench-and-Temper Facility:Capa it fo,p o ess to s a uall of a s a d tu esCustomer advantages Diverse range of processes to meet demandingstrength and hardness requirements, regardless oforder sizeCompetitive advantages Meeting stringent mechanical properties is20becoming increasingly valuable as drillingdemands in harsh environments increase
Unique combination of process, experiencedengineering and systems drive operational excellenceand superior performanceProblem solvingcultureExperiencedengineersUnique set ofassets and processcapabilitiesCompetitive coststructure Enhancedproducts andservicescustomers valueConsistent, cost-effective engineered product solutions for the superior performance ourcustomers count on in demanding applications21
Financial performance
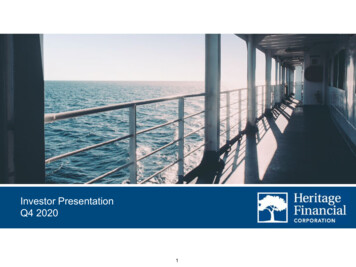
Financial performance historyAverage base selling price ( / ton)1Shipments (mm tons)1.31.21.11.11.00.9 1,011 1,0270.80.620082009201020112012201320142015 1,226 1,177 1,174 1,12620162008200920102011201220132014 1,957 1,729 315 1,674 312 1,381 1,106 715 298 195 181 869 242010201120122013201420152016Adj. EBITDAmargin232016 247( 3)20092015Adjusted EBITDA ( mm)2,3 1,3602008 1,0390.7Net sales ( mm) 1,852 964 1,069( 7%14%15%0%3%Source: TimkenSteel, The Timken Company1 Excludes surcharges2 2008-2013 adjusted EBITDA ased o The Ti ke Co pa ’s “teel seg e t EBITDA, adjusted fo p e iousl u allo ated o po ate e pe ses a d incremental stand-alone costs; see Appendix forreconciliation3 Effective January 1, 2016 the company adopted mark-to-market accounting. Adjusted EBITDA for all periods excludes the remeasurement impact of mark-to-market accounting. For 2008-2013, theimpact reflected in adjusted EBITDA has been estimated. See Appendix for reconciliation
Improved liquidity positionCapital structureLiquidity summary mm12/31/201612/31/2015 mm12/31/201612/31/2015Cash 26 42Cash 26 42Availability under ABL facility 120 42Total liquidity 146 84ABL credit facility 40 170Environmental rev. bonds 30 30Convertible notes* 66 0Total debt 136 200Shareholder equity 597 682Total capitalization 733 882*Note: Excludes transaction costs – convertible debt of 86 split into equity and debtSource: TimkenSteel24
Investments in major growth projects nearly completeCapital expenditures ( mm)GrowthMaintenance & continuous improvement 180 171 45 50 135 99 58 78 62 121 135 48 43 28 28 34 36 22 6 920092010Source: TimkenSteel25 43 40 772011 302012201320142015 152016 36 42017E
Pension plan close to fully fundedGlobal Pension plans & OPEBQualifiedNon-qualifiedTotalOPEBLiabilities 1,190 30 1,220 214Assets 1,132 0 1,132 11495%0%93%53%( m)Funded %No significant cash outflows expected in the near termSource: TimkenSteel as of December 31, 201626
TimkenSteel: A compelling investment A leading manufacturer of high-quality, high-performance engineered steelproducts and value-added services Problem solving culture delivers tailored solutions A market leader in products and services at volumes and cost levels webelieve cannot be replicated Close and trusted working relationship with customers across diverse endmarkets Competitive operating cost structure with breakeven at 50% melt utilization Solid capital structure with good liquidity position Deep and experienced management and technical team27
Appendix
Incentive CompensationAwardObjectiveAnnualIncentive Execution of annual operationalpriorities Variable cash compensation based onperformance EBIT/BIC(1) Cash flow New business sales All salaried 1 year Retention Build ownership Alignment with shareholders Share price 4 years Ratable vested Long-term shareholder value creation Alignment with 3 year strategicbusiness priorities Reward for accomplishment of longterm financial performance Cumulative cash flow Cumulative earningsper share Average return oninvested capital Share Price(metrics in current cycles) Directors andabove includingOfficers andCEO(2) 2 to 3 years Retention of top talent Build ownership Alignment with shareholders Share price Directors andabove includingOfficers 3 years Long-term shareholder value creation Alignment with shareholders Share price 4 years ratablevested 10 year exerciseperiodRestrictedStock UnitsPerformancebasedRestrictedStock UnitsCliff VestedRestrictedStock UnitsNon-QualifiedStock OptionsMetricsSource: TimkenSteel1EBIT/BIC2CEO’s29is defined as earnings before interest and ta
manufacturing processes, changes in costs associated with varying levels of o perations and manufacturing capacity, availability of raw materials and energy, the . Wide yet tailored offering of sizes, . Marmon Keystone