Transcription
July 2019Investor Presentation
Safe harborFORWARD-LOOKING STATEMENTS This presentation contains certain forward-looking information within the meaning of the Private Securities Litigation Reform Act of 1995. The words“may,” “will,” “expect,” “intend,” “estimate,” “anticipate,” “aspiration,” “objective,” “project,” “believe,” “continue,” “on track” or “target” or the negativethereof and similar expressions, among others, identify forward-looking statements. All forward looking statements are based on information currentlyavailable to management. Such forward-looking statements are subject to certain risks and uncertainties that could cause events and the Company’sactual results to differ materially from those expressed or implied. Please see the disclosure regarding forward-looking statements immediatelypreceding Part I of the Company’s Annual Report on the most recently filed Form 10-K. The company assumes no obligation to update any forwardlooking statements.REGULATION G This presentation includes certain non-GAAP financial measures like Adjusted EBITDA and other measures that exclude special items such asrestructuring and other unusual charges and gains that are volatile from period to period. Management of the company uses the non-GAAPmeasures to evaluate ongoing operations and believes that these non-GAAP measures are useful to enable investors to perform meaningfulcomparisons of current and historical performance of the company. All non-GAAP data in the presentation are indicated by footnotes. Tables showingthe reconciliation between GAAP and non-GAAP measures are available at the end of this presentation and on the Greif website at www.greif.com.July 8, 2019 – P.2
Who we areJuly 8, 2019 – P.3
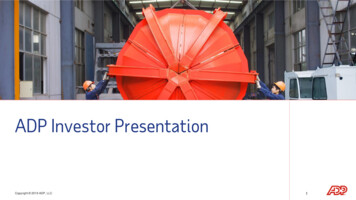
Who we areHow we operateBusiness segment overviewWhy invest in Greif?AppendixGreif provides packaging solutions around the worldRigid Industrial Packaging& ServicesPaperPackaging & ServicesFlexibleProducts & ServicesLand ManagementDenotes Greif presence in countryA global and diversified footprint across 43 countries and multiple packaging substratesJuly 8, 2019 – P.4
Who we areHow we operateBusiness segment overviewWhy invest in Greif?AppendixLeading industrial packaging solutions provider2019 Pro-forma run rate snapshot ( M)1RevenueAdj. EBITDA1% of Net Sales 5,300 72013.6%,pre-synergyHighlights and Capabilities Leading product positions inmultiple packaging substrates Diverse geographic portfolio withwide market reachPortfolio Composition by percentage ofpro-forma Net SalesDifferentiations Demonstrated commitment tocustomer service and industrypartnership Broadest industrial packagingproduct portfolio capability of fulfillingcustomer needsPortfolio Composition by percentage ofpro-forma Adj. EBITDARigid Industrial Packaging &ServicesRigid Industrial Packaging &ServicesPaper Packaging & ServicesPaper Packaging & ServicesFlexible Products & ServicesFlexible Products & ServicesLand ManagementLand Management1 Pro-forma financials representing Greif FY’18 actual performance plus a full year of Caraustar expected run-rateperformance with no synergies.July 8, 2019 – P.5
Who we areHow we operateBusiness segment overviewWhy invest in Greif?AppendixLeading positions in multiple packaging substratesUpstream OperationsIndustrial PackagingSteelFibreIndustrialClosuresFlexible IBCs#1#1#1#1Tube & CorePlasticIBC#2#2#3#2Uncoated Recycled Paperboard(URB)#3Coated Recycled Paperboard(CRB)Top 10Recovered Fiber GroupNote: Ranking denotes standing in global market. Based on company estimates.July 8, 2019 – P.6
How we operateJuly 8, 2019 – P.7
Who we areHow we operateBusiness segment overviewWhy invest in Greif?AppendixBusiness approach focused on fundamental executionBuild, optimize andservice existingportfolio Leverage leadingproduct positionsand robust globalportfolioDemonstratecommitment tocontinuousimprovement andmarginal gainsGenerate and deployenhanced Free CashFlowOut serve thecompetition Provide trulydifferentiatedcustomer service Focus on creativesolutions to customerneeds Create sustainablevalue for customersand shareholdersGrowth through lowrisk organicopportunities Adj. EPS 62%1 Adj. FCF 121%1Fund industry-leadingdividend Strategic partnershipand creativesolutions to customerneedsOur approach is fueled by our vision and strategic priorities1 percent change from 2015 to 2018Note: A reconciliation of the differences between all non-GAAP financial measures used in this presentation with the most directly comparable GAAP financialmeasures is included in the appendix of this presentation.July 8, 2019 – P.8
Who we areHow we operateBusiness segment overviewWhy invest in Greif?AppendixPutting the Service Profit Chain to work at eDrivesFinancialPerformanceEngaged colleagues drive exceptional performance for customers and shareholdersJuly 8, 2019 – P.9
Who we areHow we operateBusiness segment overviewWhy invest in Greif?AppendixVision and strategic priorities in placeStrategicVisionIn industrial packaging, be the best performingcustomer service company in the world1StrategicPrioritiesEngaged Teams Health and safety Colleague engagement Accountability aligned to valuecreation2 Differentiated Customer Service Deliver superior customerexperience Create value for our customersthrough a solutions basedapproach Earn our customers trust andloyaltyKeyEnablerThe Greif Business SystemValuesTHE GREIF WAY3 Enhanced Performance Growth aligned to value Margin expansion Fiscal discipline and freecash flow expansion SustainabilityJuly 8, 2019 – P.10
Who we are1How we operateBusiness segment overviewWhy invest in Greif?AppendixStrategic priority: engaged teamsTeams in the top quartile of thoseGallup1 has studied have Gallup Overall Engagement Score421%Higher profitability17%Higher productivity10%Higher customer metrics70%Fewer safety incidents59%Less turnover41%Lower absenteeismManufacturing sectorpercentile ranking74th3.93.813.855th3.7201828%3.972019Less shrinkageSafe and engaged colleagues drive improved operating and financial performance1 According to “The Relationship Between Engagement at Work and Organizational Outcomes: 2016 Q12 Meta- AnalysisJuly 8, 2019 – P.11
Who we are2How we operateBusiness segment overviewWhy invest in Greif?AppendixStrategic priority: differentiated customer serviceNet Promoter Score (NPS)Customer Satisfaction Index (CSI)Net PromoterScore100.090.0Wave 880.0729 576470.060.050.0Wave 1381151 ePromoters43% improvement in Net Promoter Score since inception*Note: CSI is an internal measure of a plant’s or business’ performance against selected parameters that customersexperience, giving us an indication of our level of meeting our customers basic needs. Components include: customercomplaints received; customer complaints open greater than 30 days; credits raised; number of late deliveries; and thenumber of deliveries.July 8, 2019 – P.12
Who we are3How we operateBusiness segment overviewWhy invest in Greif?AppendixStrategic priority: enhanced performanceAdjusted EBITDA – actual and anticipated ( M)Return on Invested Capital15% 700 65013% 600 55011% 5009% 450 4007% 350 300FY15FY16FY17FY18FY19E5%2015201620172018Denotes Adj. EBITDA range for FY1928% improvement in Adj. EBITDA between 2015 and 2018Note: A reconciliation of the differences between all non-GAAP financial measures used in this presentation with the most directly comparable GAAP financial measures isincluded in the appendix of this presentation.Note: No reconciliation of the fiscal year 2019 Adjusted EBITDA is included in this presentation because, due to the high variability and difficulty in making accurate forecastsand projections of some of the excluded information, together with some of the excluded information not being ascertainable or accessible, we are unable to quantify certainamounts that would be required to be included in the most directly comparable GAAP financial measure without unreasonable efforts.Note: ROIC is calculated as after tax operating profit before special items divided by average total invested capital. Invested capital is defined as current portion of long-termdebt plus long-term debt plus total shareholder equity.July 8, 2019 – P.13
Who we are3How we operateBusiness segment overviewWhy invest in Greif?AppendixStrategic priority: enhanced performance2016Join UNGlobalCompact2008Join World BusinessCouncil ls established2012NexDRUMintroduced20102010Greif Green Toolcreated2012201520162015 & 2016Awarded Silver recognitionfrom EcoVadis20172018Achieved an“A- Leadership”CDP score20182025Sustainabilitygoals achieved20252018Awarded Gold recognitionfrom EcoVadisStrong progress on our sustainability journeyJuly 8, 2019 – P.14
Who we are3How we operateBusiness segment overviewWhy invest in Greif?AppendixStrategic priority: Caraustar enhances Greif’s portfolio1Combined pro-formaSales bySegmentSales byGeography2EBITDAby SegmentRIPSRIPSPPSPPSFPSFPSLMLMUSUSEMEAEMEAAPAC &OtherAPAC &OtherRIPSRIPSPPSPPSFPSFPSLMLMImpact Balances Greif’sexisting portfolio Increases Greif’sexposure to the U.S. Strengthens earningspower and marginaccretive to Greif’sportfolio1 Greif Fiscal 2018 data.2 EBITDA represents Greif’s Fiscal 2018 EBITDA before special items. A summary of all adjustments for the impact of special items that are included in theEBITDA before special items by segment is set forth in the appendix of this presentation.Note: EBITDA is often defined as net income, plus interest expense, net, plus tax expense, plus depreciation, depletion and amortization. However,because the Company does not calculate net income by segment, the reference to operating profit (loss) by segment, which, as demonstrated in the tableof EBITDA in the appendix, is another method to achieve the same result.July 8, 2019 – P.15
Business segment overviewJuly 8, 2019 – P.16
Who we areHow we operateBusiness segment overviewWhy invest in Greif?AppendixRIPS: highlights and differentiationHighlights and Capabilities2018 Financials ( M)Revenue 2,623.6Adj. EBITDA 273.4Adj. EBITDA margin10.4% Extensive global expertise andoperational footprint Industry’s most comprehensiveproduct line offering Large product shares in steel andfibre and fast growing IBC business Ability to serve customers globally FPS cross selling opportunities2018 Net Sales By GeographyDifferentiation2018 Revenue Mix Differentiated customer service focus;long tenured relationships2018 Revenue by End MarketBulk/Commodity ChemicalsOil/LubricantsAll Other1APACSpecialty ChemicalsFood and BeverageFibreDrumsOtherNorth AmericaPaints, Coatings, AdhesivesIBCsEMEAPlasticDrumsSteelDrumsPackaging DistributorsAgro ChemicalsPharmaceuticals and Personal CareFlavors and FragrancesBlenders/FillersLATAMDetergentsWaste Industry1 Includes packaging accessories, filling, reconditioning, water bottles, pails and other miscellaneousNote: A reconciliation of the differences between all non-GAAP financial measures used in this presentation with the most directly comparable GAAP financialmeasures is included in the appendix of this presentationJuly 8, 2019 – P.17
Who we areHow we operateBusiness segment overviewWhy invest in Greif?AppendixRIPS: broad product and services capabilitySteelFibre#1#1IBCEarth MindedClosures#1Plastic#2Filling#3RIPS is the most comprehensive customer solutions provider in the industryNote: Ranking denotes standing in global market. Based on company estimates.July 8, 2019 – P.18
Who we areHow we operateBusiness segment overviewWhy invest in Greif?AppendixRIPS: ongoing efforts to enhance marginsPriceadjustmentmechanism(PAM)refreshedNew serviceenhancementsdeployedRobustbusinessplanning andsupply chainfully ingrained Current: PAMs cover 71% of steel drum production and 63% plastic drum production Future: Contract “golden rules” deployed; opener provisions to recover non-raw material inflation Current: CSI and NPS provide insights into customer needs Future: customer service excellence (CSE) training deployed globally; additional value-addenhancements that address growing customer needs Current: Collaborative approach between commercial, finance, operations and supply chain Future: Discipline enhanced through added technology, enhanced S&OP and robust pricingdeskPursuing marginal gains across the business to enhance profitabilityJuly 8, 2019 – P.19
Who we areHow we operateBusiness segment overviewWhy invest in Greif?AppendixRIPS: expanding reconditioning for sustainable solutionsReconditioning overview Benefits to customers:‒ Reduces cost/manufacturingexpense‒ Supports sustainability goalsand reduces environmentalimpactsGreif today Operate services to facilitatecollection and reconditioning globally Operate the largest reconditioningfacility in Europe Greif future state Closed loop network in place inregional hubs in the U.S. andEurope Global IBC reconditioned miximproved and enhances marginCurrently assessing additionalreconditioning opportunities andoperating model upgrades‒ Reduces disposal costs andoperating expensesJuly 8, 2019 – P.20
Who we areHow we operateBusiness segment overviewWhy invest in Greif?AppendixPPS: broad portfolio offering a variety of paper productsMillsContainerboardRecovered FiberUncoated RecycledPaperboardCoated sTube & CoreConsumerPackagingCC#2Note: Ranking denotes standing in global market. Based on company estimates.July 8, 2019 – P.21
Who we areHow we operateBusiness segment overviewWhy invest in Greif?AppendixPPS: highlights and differentiationRevenueAdjusted EBITDA2Adjusted EBITDA margin 2,274 Niche position in containerboard 412 Leadership position in URB andtubes/cores18.1% 2019 Net Sales By GeographyUnique converting capabilities Speed – response and lead times Breadth of product offerings Long-standi
08.07.2019 · Future: Contract “golden rules” deployed; opener provisions to recover non-raw material inflation Price adjustment mechanism (PAM) refreshed Current: CSI and NPS provide insights into customer needs Future: customer service excellence (CSE) training deployed globally; additional value-add enhancements that address growing customer needs New service enhancements deployed