Transcription
2018 Investor Presentation
Forward-looking statements and non-GAAP financial informationThis presentation includes “forward-looking” statements within the meaning of the federal securities laws. You can generally identify the company’s forward-lookingstatements by words such as “anticipate,” “believe,” “could,” “estimate,” “expect,” “forecast,” “outlook,” “intend,” “may,” “possible,” “potential,” “predict,”“project,” “seek,” “target,” “could,” “may,” “should” or “would” or other similar words, phrases or expressions that convey the uncertainty of future events oroutcomes. The company cautions readers that actual results may differ materially from those expressed or implied in forward-looking statements made by or onbehalf of the company due to a variety of factors, such as: deterioration in world economic conditions, or in economic conditions in any of the geographic regions inwhich the company conducts business, including additional adverse effects from global economic slowdown, terrorism or hostilities, including political risks associatedwith the potential instability of governments and legal systems in countries in which the company or its customers conduct business, and changes in currencyvaluations; the effects of fluctuations in customer demand on sales, product mix and prices in the industries in which the company operates, including the ability of thecompany to respond to rapid changes in customer demand, the effects of customer bankruptcies or liquidations, the impact of changes in industrial business cycles,and whether conditions of fair trade exist in U.S. markets; competitive factors, including changes in market penetration, increasing price competition by existing ornew foreign and domestic competitors, the introduction of new products by existing and new competitors, and new technology that may impact the way thecompany’s products are sold or distributed; changes in operating costs, including the effect of changes in the company’s manufacturing processes, changes in costsassociated with varying levels of operations and manufacturing capacity, availability of raw materials and energy, the company’s ability to mitigate the impact offluctuations in raw materials and energy costs and the effectiveness of its surcharge mechanism, changes in the expected costs associated with product warrantyclaims, changes resulting from inventory management, cost reduction initiatives and different levels of customer demands, the effects of unplanned work stoppages,and changes in the cost of labor and benefits; the success of the company’s operating plans, announced programs, initiatives and capital investments (including thejumbo bloom vertical caster and advanced quench-and-temper facility), the ability to integrate acquired companies, the ability of acquired companies to achievesatisfactory operating results, including results being accretive to earnings, and the company’s ability to maintain appropriate relations with unions that represent itsassociates in certain locations in order to avoid disruptions of business; unanticipated litigation, claims or assessments, including claims or problems related tointellectual property, product liability or warranty, and environmental issues and taxes, among other matters; the availability of financing and interest rates, whichaffect the company’s cost of funds and/or ability to raise capital, the company’s pension obligations and investment performance, and/or customer demand and theability of customers to obtain financing to purchase the company’s products or equipment that contain its products; the amount of any dividend declared by thecompany’s Board of Directors on the company’s common shares; and the overall impact of mark-to-market accounting. Additional risks relating to the company’sbusiness, the industries in which the company operates or the company’s common shares may be described from time to time in the company’s filings with the SEC.All of these risk factors are difficult to predict, are subject to material uncertainties that may affect actual results and may be beyond the company’s control. Readersare cautioned that it is not possible to predict or identify all of the risks, uncertainties and other factors that may affect future results and that the above list should notbe considered to be a complete list. Except as required by the federal securities laws, the company undertakes no obligation to publicly update or revise any forwardlooking statement, whether as a result of new information, future events or otherwise.The unaudited pro forma consolidated financial data in this presentation is subject to assumptions and adjustments described in the company’s registration statementon Form 10. TimkenSteel Corporation’s (“TimkenSteel”) management believes these assumptions and adjustments are reasonable under the circumstances . Theunaudited pro forma consolidated financial data does not purport to represent what TimkenSteel’s financial position and results of operations actually would havebeen had the spinoff occurred on the dates indicated, or to project TimkenSteel’s financial performance for any future period following the spinoff.This presentation also includes certain non-GAAP financial measures as defined by SEC rules. A reconciliation of those measures to the most directly comparable GAAPequivalent is contained in the Appendix. Please see discussion of non-GAAP financial measures in the Appendix.2
Business Overview
TimkenSteel: A compelling investment A leading manufacturer of high-quality, high-performance engineered steelproducts and value-added services Problem solving culture delivers tailored solutions A market leader in products and services at volumes and cost levels webelieve cannot be replicated Close and trusted working relationship with customers across diverse endmarkets Solid capital structure with good liquidity position Deep and experienced management and technical team4
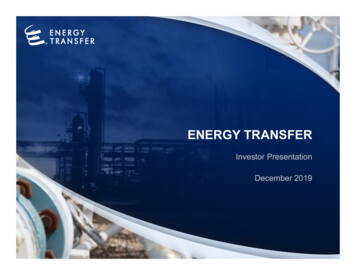
TimkenSteel: At a glanceOverviewAlloy steel bars (SBQ) Headquartered in Canton, OhioTimkenSteel Applications Annual melt capacity of 2m tons 75%1,2Value-added solutionsMachining, honing& drilling 15%1Components Only focused North American SBQproducer Widest size range of SBQ barcapability Largest domestic capacity ofBearingsFuel injectorsCrankshaftsTri-Cone bitsPercussion bits Energy CRAProduction CV joints GearHigh SBQseamless mechanical tube capability2017 shipments by end marketQUALITYOther18%Low (Not SBQ)Industrial36%Energy9% Fasteners Hand tools Leaf springs Shopping carts Table legs Reinforcing barNon-TimkenSteel ApplicationsMobile37%5Supply chainSource: TimkenSteel1 As a percentage of 2017 shipments2 Includes billetsSeamless mechanical tubing 10%1
Focused in niche market sectors where we have competitive strengthGlobal finished steel productsNAFTA finished steel products1,780m tons150m tonsOur core product linesAsia and Oceana68%Other %Our homemarketNAFTA9%Middle East3%CIS3%Other Europe3%Africa Central andSouthAmerica2%2%Sources: World Steel Association Finished Steel Demand (2017); American Iron and Steel Institute (2017)1 Other Long Products: Light Shapes, Reinforcing Bars, Merchant Bars, Wire, Pipe & Tubing6Special BarQuality4%Flat-Rolled52.5%
Competitive advantage from processes, experience and systemsComplex order bookComplex planning environmentLarge Approximately 700 grades of steel Over 2,300 scrap and alloy classificationsMedium Over 500 customers Average 35 ton order size Over 33,000 orders per year on average 7 manufacturing plants, 4 warehousesSmallSize range Roughly 8,000 customer specifications About 100 major flow paths, 100 operations, 260work centersCarbonAlloyChemistry100% made to order products delivered at industry leading customer serviceSource: TimkenSteel (current state)7
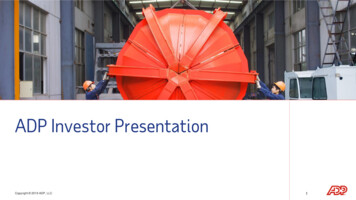
Broad size range strengthens our competitive positionApprox. market sector size1.4m tons3.5m tons0.8m tons0.3m tonsTimkenSteelNucor - MemphisSteel Dynamics PittsboroRepublic SteelGerdau012345678910Bar Diameter (Inches)6:1 Reduction1 – MachiningSource: TimkenSteel internal estimates as of 12/31/20171 Reduction ratio is a critical quality measure for machining applications.8111213141516
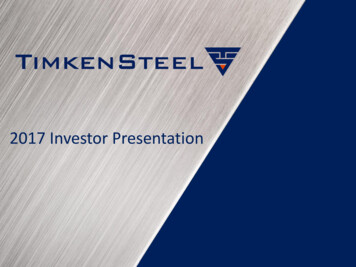
A leading producer of seamless mechanical tubingU.S. tubing landscape1Differentiation18.6m tonsStructural17% Largest domestic capacitySeamlessmechanical3%Pressure1% Broadest size range 1.9” to 13.0” Heavier wallsOCTG31%Standard11% Higher value – added niche volume and alloygrade categories Leading producer of quench and temperedcapability Custom grades, small order sizes, demandingapplications make barrier to entry difficultWeldedmechanical14%Stainless1%Line Pipe22%Source: 2017 Preston Pipe and Tube Report1 The chart is organized from lightest to darkest shading, with the darkest shading denoting the highest material value and performance.9
Meeting our customers’ high-performance needsValue propositionEnergyKey customers On and off-shore drilling and completion applications Offerings are valued and trusted by industry leaders Unique and integrated supply chain solution set which combines highperformance materials, unmatched thermal treatment, proprietarymachining processes and responsive delivery capabilities Diverse industrial applications where performance is critical in a varietyIndustrialof end markets including mining, rail, agriculture, military, machineryand more Manufacturing flexibility supports large scale assets with small scalesolutions Trusted, long-term, reliable supplier Known for our leadership in quality, consistency, and technical support Broad experience fostering deep material, application, and process knowMobilehow that creates value Critical automotive applications where high performance is required,primarily engine, transmission and driveline componentsSales channelDistributionSource: TimkenSteel10 National Oilwell VarcoSchlumbergerHalliburton (via distribution)FMC TechnologiesEllwood GroupDril-Quip TimkenCaterpillarAmsted RailEllwood GroupCanton Drop ForgeGeneral Dynamics General MotorsFordHondaNissanToyotaFiat Chrysler AutomobilesKey customers Selected distribution channel partners leveraging one another’s Reliance Steel &strengths Authorized service centers valued for differentiated supply chainsolutions Wide yet tailored offering of sizes, value levels and quantities A.M. Castle Eaton Steel Marmon KeystoneAluminum
TimkenSteel applications in autosEngine 35% Crankshafts Connecting rods Fuel componentsTransmission 45% Sun, ring, pinion and 11planetary gearsCVT pulleyDrive gearsShaftsHubs Driveline 20%Bearing hubsRing gearsDrive pinion gearsSide gearsAxle tubingSteering knucklesCV Joint housing and cages
TimkenSteel industrial applications Bearings components Connecting components Ground engaging tooling Hydraulic components OthersDriveline/axle componentsEngine components Missile components and projectiles12 Planetary gear componentsSteering componentsTrack componentsTransmission componentsDrilling
Demanding applications using unique product and processesVertical and horizontal drilling applicationsCompletion and deepwater drilling applicationsCustom-crafted, reliable solutions that address the distinct needs of the energy industry13
Maximizing our assets and process paths to service diverse industriesFaircrest SteelPlantHarrison SteelPlantGambrinus SteelPlantScrapMeltMeltPierce1.1m tons per year0.75m tons per year0.50m tons per yearRefiningRefiningSoaking pitsBloom re-heat46” Rolling MillThermal treat0.485m tons per yearHarrison rolling millPrecision sizing millBar finishing36“ Rolling millBillet cuttingTube finishingBar finishingBillet conditioning14ShipBar ShipTube ShipTruck & railcarTruck & railcarTruck & railcarCustomers orvalue-added plantsCustomers orvalue-added plantsCustomers orvalue-added plantsBarsTubesBloomsBillets to pierceMain operations
Quench-and-temper capabilities:Changing drilling technologyBackground / scope Multiple thermal treatment options made available since 1980s to meet customer needs 40m investment commissioned 4Q 2017Processing / capabilities Advanced Quench-and-Temper Facility:Capacity for 50,000 process tons annually of 4”-13”bars and tubesCustomer advantages Diverse range of processes to meet demandingstrength and hardness requirements, regardless oforder sizeCompetitive advantages Meeting stringent mechanical properties isbecoming increasingly valuable as drillingdemands in harsh environments increase15
Financial Performance
High level financial performance historyMelt Utilization65%2012Shipments (k tons)73%72%2013201449%46%201520160.920122017 1,177 1,174 1,1260.82013201420150.72016 1,039 902 298 195 247 2420122013201420152016 69( 2)2017Adj. EBITDA margin172017Adjusted EBITDA ( m)2,3,4Average base selling price ( / ton)1,4 0%3%5%Source: TimkenSteel, The Timken Company1 Excludes surcharges2 2012-2013 adjusted EBITDA based on The Timken Company’s Steel segment EBITDA, adjusted for previously unallocated corporate expenses and incremental stand-alone costs3 Effective January 1, 2016 the company adopted mark-to-market accounting. Adjusted EBITDA for all periods excludes the remeasurement impact of mark-to-market accounting. For 2012-2014, theamortized actuarial losses reflected in adjusted EBITDA have been estimated.4 Please see Appendix for a reconciliation of base sales to net sales and Adjusted EBITDA to Net Income.
Investments in major growth projects nearly completeCapital expenditures ( m)GrowthMaintenance & continuous improvement 180 171 45 50 135 58 78 121 135 48 43 36 40 27 39 15 920162017 12018 F 77 28 302012Source: TimkenSteel18201320142015
Pension plan close to fully fundedGlobal Pension plans & OPEBQualifiedNon-qualifiedTotalOPEBLiabilities 1,250 32 1,282 216Assets 1,187 0 1,187 10495%0%93%48%( m)Funded %No significant cash outflows expected in the near termSource: TimkenSteel as of December 31, 201719
Appendix
Incentive odAnnual Incentive Execution of annual operational priorities Variable cash compensation based onperformance EBIT/BIC(1) Cash flow Key process path sales All salaried 1 yearRestricted StockUnits Retention Build ownership Alignment with shareholders Share price 4 years Ratable vestedPerformancebased RestrictedStock Units Long-term shareholder value creation Alignment with strategic business priorities Reward for accomplishment of mid-termfinancial performance Average return oninvested capital Cumulative sales Cumulative cash flow Share price(metrics in current cycles) Directors and aboveincluding Officers andCEO(2) 2 to 3 yearsCliff VestedRestricted StockUnits Retention of top talent Build ownership Alignment with shareholders Share price Directors and aboveincluding Officers 3 years Long-term shareholder value creation Alignment with shareholders Share price 4 years ratablevested 10 year exerciseperiodNon-QualifiedStock OptionsSource: TimkenSteel1EBIT/BIC is defined as earnings before interest and taxes divided by beginning invested capital2CEO’s Long-term incentive portfolio comprised of performance-based restricted stock units and non-qualified stock options21Senior ManagersDirectors and aboveincluding Officers andCEO(2)
Non-GAAP ReconciliationsTimkenSteel reports its financial results in accordance with accounting principles generally accepted in the United States ("GAAP") andcorresponding metrics as non-GAAP financial measures. This investor presentation includes references to the following non-GAAPfinancial measures: Adjusted EBITDA and Base Sales. Adjusted EBITDA is an important financial measure used in the management ofthe business, including decisions concerning the allocation of resources and assessment of performance. Management believes thatreporting Adjusted EBITDA is useful to investors as it is representative of the company's performance, is a useful reflection of theunderlying growth from the ongoing activities of the business and provides improved comparability of results. Base Sales, which theCompany defines as net sales adjusted to exclude raw material surcharges, is also an important financial measure used in themanagement of the business. Management believes that reporting Base Sales is important to investors as it provides additionalinsight into key drivers of net sales such as base price and product mix.For the periods prior to the spinoff, the financial information has been prepared on a stand-alone basis and is derived from theconsolidated financial statements and accounting records of TimkenSteel’s former parent company, The Timken Company.TimkenSteel’s consolidated financial statements include certain expenses of its former parent that were allocated to the steel businessfor certain functions, including general corporate expenses related to finance, legal, information technology, human resources,compliance, shared services, insurance, employee benefits and incentives and stock-based compensation. TimkenSteel considers theexpense allocation methodology and results to be reasonable for all periods presented. However, these allocations may not beindicative of the actual expenses TimkenSteel would have incurred as an independent public company or of the costs it will incur in thefuture.See the attached schedules for definitions of the non-GAAP financial measures referred to above and corresponding reconciliations ofthese non-GAAP financial measures to the most comparable GAAP financial measures. Non-GAAP financial measures should beviewed in addition to, and not as an alternative for, TimkenSteel's results prepared in accordance with GAAP. In addition, the nonGAAP measures TimkenSteel uses may differ from non-GAAP measures used by other companies, and other companies may notdefine the non-GAAP measures TimkenSteel uses in the same way.22
Reconciliation of Adjusted Earnings (Loss) Before Interest and Taxes (Adjusted EBIT)(1) and AdjustedEarnings (Loss) Before Interest, Taxes, Depreciation and Amortization (Adjusted EBITDA)(2) to Net Income(Loss); Reconciliation of Base Sales(3) to Net Sales: mNet salesLess: surchargesBase salesShip tons (k) 20121,7294171,312 1,070,38020131,3813001,081918,243 20141,6743901,284 1,093,692 1,226 1,177 1,174 Net income (loss) 155 90 46 --792343812812370Adjustments:Audit/other adjustmentsStand-alone costsMark-to-market remeasurment (gain)/lossAmortized actuarial Losses(1.0)(28)362.3(32)36(11)10619Adjusted EBIT % of SalesAdjustments:Stand-alone depreciation & amortizationDepreciation & amortizationTotal depreciation & amortizationAdjusted EBITDA% of Sales 241 134 18414%10%11%75057754615586329817% 19514% 24715% 837,135Average base sale per tonInterest expenseProvision (benefit) for income 29 4(27)(68)1,039(106)(7) 902 (44)151(28)8022-(75) -(51)-7%-6%-7373(2)0%20171,3292911,0381,150,279-- 11(36)(131)- 0%7575 (6)243%7575 695%Source: TimkenSteelNote: Effective January 1, 2016 the company adopted mark-to-market accounting.1Adjusted EBIT is defined as EBIT (a) adjusted for previously unallocated corporate expenses and incremental stand-alone costs and/or (b) excluding the remeasurement impact of mark-tomarket accounting.2 Adjusted EBITDA is defined as EBITDA (a) adjusted for previously unallocated corporate expenses and incremental stand-alone costs and/or (b) excluding the remeasurement impact of markto-market accounting.3 Base sales is defined as net sales adjusted to exclude raw material surcharges.23
4 TimkenSteel: A compelling investment A leading manufacturer of high-quality, high-performance engineered steel products and value-added services Problem solving culture delivers tailored solutions A market leader in products and services at volumes and cost levels we believe cannot be replicated Close and trust