Transcription
Investor Day Presentation, November 22, 20191
DisclaimersThis presentation contains forward-looking statements (as such term is defined in Section 21E of theSecurities Exchange Act of 1934, as amended, or the Exchange Act) concerning operations, cash flows,and financial position of Seaspan Corporation (“Seaspan”), including, in particular, the likelihood of itssuccess in developing and expanding its business. Statements that are predictive in nature, that dependupon or refer to future events or conditions, or that include words such as “continue,” “expects,”“anticipates,” “intends,” “plans,” “believes,” “estimates,” “projects,” “forecasts,” “will,” “may,” “potential,”“should,” “guidance,” and similar expressions are forward-looking statements. These forward-lookingstatements represent Seaspan’s estimates and assumptions only as of the date of this presentation and arenot intended to give any assurance as to future results. As a result, you are cautioned not to rely on anyforward-looking statements. Forward-looking statements appear in a number of places in this presentation.Although these statements are based upon assumptions Seaspan believes to be reasonable based uponavailable information, they are subject to risks and uncertainties. These risks and uncertainties include, butare not limited to: future growth prospects and ability to expand Seaspan’s business; Seaspan’sexpectations as to impairments of its vessels, including the timing and amount of currently anticipatedimpairments; the future valuation of Seaspan’s vessels and goodwill; potential acquisitions, vessel financingarrangements and other investments, and Seaspan’s expected benefits from such transactions; future timecharters and vessel deliveries, including future long-term charters for certain existing vessels; estimatedfuture capital expenditures needed to preserve the operating capacity of Seaspan’s fleet including, its capitalbase, and comply with regulatory standards, its expectations regarding future dry-docking and operatingexpenses, including ship operating expense and general and administrative expenses; Seaspan’sexpectations about the availability of vessels to purchase, the time that it may take to construct newvessels, the delivery dates of new vessels, the commencement of service of new vessels under long-termtime charter contracts and the useful lives of its vessels; availability of crew, number of off-hire days anddry-docking requirements; general market conditions and shipping market trends, including charter rates,increased technological innovation in competing vessels and other factors affecting supply and demand;Seaspan’s financial condition and liquidity, including its ability to borrow and repay funds under its creditfacilities, to refinance its existing facilities and to obtain additional financing in the future to fund capitalexpenditures, acquisitions and other general corporate activities; Seaspan’s continued ability to meet itscurrent liabilities as they become due; Seaspan’s ability to remediate any existing material weakness in itsinternal controls over financial reporting; Seaspan’s continued ability to maintain, enter into or renewprimarily long-term, fixed-rate time charters with its existing customers or new customers; the potential forearly termination of long-term contracts and Seaspan’s potential inability to enter into, renew or replacelong-term contracts; the introduction of new accounting rules for leasing and exposure to currency exchangerates and interest rate fluctuations; conditions inherent in the operation of ocean-going vessels, includingacts of piracy; acts of terrorism or government requisition of Seaspan’s containership during periods of waror emergency; adequacy of Seaspan’s insurance to cover losses that result from the inherent operationalrisks of the shipping industry; lack of diversity in Seaspan’s operations and in the type of vessels in its fleet;conditions in the public equity market and the price of Seaspan’s shares; Seaspan’s ability to leverage to itsadvantage its relationships and reputation in the containership industry; compliance with and changes ingovernmental rules and regulations or actions taken by regulatory authorities, and the effect ofgovernmental regulations on Seaspan’s business; the financial condition of Seaspan’s customers, lenders,refund guarantors and other counterparties and their ability to perform their obligations under theiragreements with us; Seaspan’s continued ability to meet specified restrictive covenants and other conditionsin its financing and lease arrangements, its debt instruments and its preferred shares; any economicdownturn in the global financial markets and export trade and increase in trade protectionism and potentialnegative effects of any recurrence of such disruptions on Seaspan’s customers’ ability to charter Seaspan’svessels and pay for Seaspan’s services; some of Seaspan’s directors and investors may have separateinterest which may conflict with those of its shareholders and they may be difficult to replace given the antitakeover provisions in Seaspan’s organizational documents; taxation of Seaspan’s company and ofdistributions to its shareholders; Seaspan’s exemption from tax on U.S. source international transportationincome; the ability to bring claims in China and the Marshall Islands, where the legal systems are not welldeveloped; potential liability from future litigation; and other factors detailed from time to time in Seaspan’speriodic reports.Forward-looking statements in this presentation are estimates and assumptions reflecting the judgment ofsenior management and involve known and unknown risks and uncertainties. These forward-lookingstatements are based upon a number of assumptions and estimates that are inherently subject to significantuncertainties and contingencies, many of which are beyond Seaspan’s control. Actual results may differmaterially from those expressed or implied by such forward-looking statements. Accordingly, these forwardlooking statements should be considered in light of various important factors listed above and including, butnot limited to, those set forth in “Item 3. Key Information—D. Risk Factors” in Seaspan’s Annual Report forthe year ended December 31, 2018 on Form 20-F filed on March 26, 2019, and the “Risk Factors” inReports on Form 6-K that are filed with the Securities and Exchange Commission, or the SEC, from time totime relating to our quarterly financial results.Seaspan does not intend to revise any forward-looking statements in order to reflect any change inSeaspan’s expectations or events or circumstances that may subsequently arise. Seaspan expresslydisclaims any obligation to update or revise any of these forward-looking statements, whether because offuture events, new information, a change in Seaspan’s views or expectations, or otherwise. You shouldcarefully review and consider the various disclosures included in Seaspan’s Annual Report and in Seaspan’sother filings made with the SEC, that attempt to advise interested parties of the risks and factors that mayaffect Seaspan’s business, prospects and results of operations.In this Investor Day Presentation, Seaspan relies on and refers to information and statistics regardingindustry data. Seaspan obtained this information and statistics from third-party sources believed to bereliable. Seaspan has not independently verified the accuracy or completeness of any such third-partyinformation. This Investor Day Presentation includes non-GAAP forward-looking financial measures relatedto a proposed business combination. Seaspan believes that these non-GAAP financial measures provideuseful information to management and investors regarding certain financial and business trends related tothe financial condition of the proposed acquired business and results of operations. Seaspan does notprovide a quantitative reconciliation of forward-looking Adjusted EBITDA for APR to the most directlycomparable GAAP measure because it is unable to predict with reasonable certainty the ultimate outcomeof certain significant items without unreasonable effort. These items include but are not limited todepreciation, interest expense and certain one-time costs, as well as the finalization of acquisitionaccounting treatment. These items could have a material impact on GAAP-reported results for the futureperiod.This communication does not constitute an offer to sell or the solicitation of an offer to buy any securities ora solicitation of any vote or approval. Atlas will file a registration statement that includes a preliminary proxystatement/prospectus and other relevant documents in connection with the Proposed Reorganization.SEASPAN’S SHAREHOLDERS ARE URGED TO CAREFULLY READ THE PRELIMINARY PROXYSTATEMENT/PROSPECTUS, WHEN FILED, AND THE DEFINITIVE PROXYSTATEMENT/PROSPECTUS, WHEN FILED AND MAILED, BECAUSE THEY WILL CONTAINIMPORTANT INFORMATION ABOUT THE PROPOSED REORGANIZATION. The definitive proxystatement/prospectus will be mailed to the holders of Seaspan shares prior to the Special Meeting. Inaddition, investors may obtain a free copy of the preliminary proxy statement/prospectus and other filingscontaining information about Seaspan, Atlas and the Proposed Reorganization, from the SEC at the SEC’swebsite at http://www.sec.gov after such documents have been filed with the SEC. In addition, after suchdocuments have been filed with the SEC, copies of the preliminary proxy statement/prospectus and otherfilings containing information about Seaspan, Atlas and the Proposed Reorganization can be obtainedwithout charge by accessing them on Seaspan’s web site at http://www.seaspancorp.com or by contactingSeaspan Investor Relations at 1-778-328-5340 or IR@seaspancorp.com.2
David Sokol,ChairmanChairman Opening Remarks
Three Key TakeawaysStrengthenBalanceSheet &LiquidityDisciplined,ReturnOriented FleetGrowthDiversifyCash Flows De-leveraging of 800 million, lowest net debt to equity since 2007 Improving flexibility & reducing cost of capital 1.5 billion portfolio financing program Record cash flow from operations Continue to be best-in-class owner & operator of containerships Deployed over 400 million into container shipping during 2019 Stable market provides fundamentals for further allocation Acquisition of attractive niche power rental business Diversification provides through-cycle deployment opportunities Evolution to asset management4
Foundational Growth Over the Past Year2018120191Total Debt2 4.4bn 3.6bn-18%Liquidity3 541mn 913mn69%Revenue (TTM) 1.0bn 1.1bn12%Cash Flow (TTM)4 465mn 805mn73%Opex / day (TTM) 5,996 .As of September 30Principal value of debt and leases outstanding; does not include operating leasesCash plus undrawn committed credit facilitiesCash flow from operations; historical periods reclassified to conform to current presentationLong-time injury frequency (LTIF) represents injuries per million man hours5
Leading Asset ManagerWorld’s LargestContainership LessorMobile PowerSolution LessorLeading MaritimePlatformGlobal EnergyPlatform6
Board ReviewQ&A
Bing Chen,President &Chief Executive OfficerStrategic Update & Vision8
Our Five Key PrioritiesOur Core Competencies Drive Sustainable Growth and Value Creation1Consistent Operational Excellence2Creative Customer Partnerships3Solid Financial Strength4Quality Growth Opportunities5Disciplined Capital Allocation9
Operational ExcellenceOperational Excellence Is the Cornerstone of Our Business ModelVessel Operating LTIF / Safety Industry-leading utilization Vessel reliability Port state controlcomplianceManagement of all ourvessels Fuel changeover (IMO2020) for customers Crew training & retentionTechnologyChartering Development of CDS(Commercial DataServices) Implementation of ERPsystems (Netsuite,GTreasury)10
Customer PartnershipsOur Customers Are The Reason For Our SuccessPartnership Approach Drives Value Attractive and accretive vessel acquisitions forour customers Partnering on operational improvements Scrubber solutions on 10 vesselsEnables Mutually Beneficial Innovation Innovative commercial structures Mutually beneficial charter modificationagreement Vessel modificationsEstablishes New Partnerships 98.8% vessel utilization YTD New relationships with leading credit-worthycustomers (Arkas, KMTC, HMM) First ever charter with Evergreen Marine(relationships with top 8) Geographic expansion of commercial team11
Financial Strength and StabilityTransformational Year For Our Financial Strength and StabilityFinancial Flexibility Flexible portfolio financing program ( 1.5bn)De-Leveraging Reduction of 800mn in total debt 227mn modification payment Closed second tranche of Fairfax’s 1.0bninvestment Lowest net debt / equity since 2007Long-Term Goal:Investment GradeCredit RatingImproving Liquidity Position Improved cash balances New credit facility12
Growth Opportunities & Capital AllocationConstantly Determining the Best Use of Our CapitalContainership-RelatedNon-Containership Newbuilding opportunities Secondhand vessels Re-writing capabilities(charter modification) CSET framework agreement Portfolio financing program Special Projects / M&A Team Acquisition of APR EnergyOpportunity for accretivecorporate acquisitions; publicand private companiesOther Capital Allocation De-leveraging Improves cost of capital “Right-sizing” thebalance sheet Evaluating all capitalallocation decisions with thesame criteriaCapital Allocation CriteriaRisk-adjusted returnsStrengthen balance sheetCompelling strategic rationaleMeeting customers’ needsValue creation for shareholders13
Building Upon Core Competencies for GrowthOur Vision is Sustainable Growth and Value CreationGrowth in AncillaryGrowth in Adjacent Maritime IndustriesGrowth in Container ShippingCore Competencies People / Processes / Systems14
Competitive Advantages Position Seaspan WellOur Unique Platform Well Positions Us for Sustainable Growth Fully-Integrated PlatformManage full life cycle from design, construction,operation, scrapping; 4,600 employees Highly Predictable BusinessModel 4 billion contracted future revenue Entrenched Relationshipswith Top-Quality CustomersLong-term charters with 7 leading liners Attractive Fleet Focused onGrowing TradesLarge, diverse, modern fleet Balance Sheet FlexibilityFlexibility, 900mn liquidity, de-leveraging,strong foundational capital partners1.TEU weighted; Pro Forma for previously announced vessel acquisitions98% utilization since IPO(control 80% of market) 70% of our fleet over 9k TEU115
Q&A
Peter Curtis,EVP and Chief Commercial& Technical OfficerTorsten Pedersen,EVP Ship ManagementState of the Industry & Operations, Projects,and Technology17
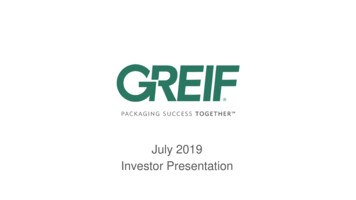
Container Shipping – Infrastructure for Global Trade Seaborne transportation largest and most efficient: 90% of trade Stable seaborne growth: doubled between 2000 and 2019 Container trade growth and stabilization: 70mn TEU/year in 2000to 200mn today49km1226km1 Global GDP growth driven Fundamental international trade growth, a means for globalization Containerization penetration (cargo types and geography) Global container industry infrastructure development394 km1World Seaborne 22014201620182020World Seaborne Trade (trillion tonne-miles)Containerships are integral infrastructure for global trade1.2.ClearSeas – 1 tonne of cargo on 1 litre of fuelClarksons Research – October 201918
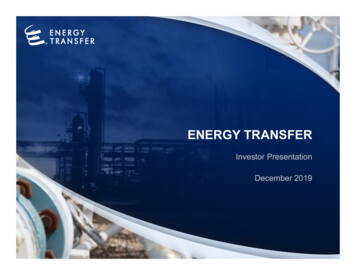
Demand – Global Container Trade GrowthSeaborne Container Trade Volume Growth vs GDP1Growth Phase7.0xMaturity and Stabilization6.0x5.0x4.0x3.0x2.0x1.0x–2000 2001 2002 2003 2004 2005 2006 2007 2008 2009 2010 2011 2012 2013 2014 2015 2016 2017 2018 2019 2020Seaborne Container Trade to GDP Growth Multiple1x GDP GrowthContainer Market Volume Demand by Trade1250Mainlane E-WNon-Mainlane 02010050–20172018Broad-based growth supported by stabilizing environment1.Clarksons Research – October 201919
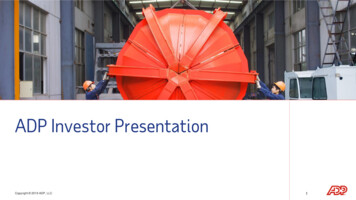
Supply – Disciplined Management of Global Fleet Orderbook as % of Global Fleet1,2Increased discipline on the part ofowners and capital providerscontinues to temper supplygrowth75%Normalization through discipline50%Orderbook-to-fleet ratiocurrently at 10.7%2; near alltime 0172019Global Idle Containership Fleet (% TEU)1,2 Idle vessels 3.3% of the globalfleet2 significant improvement YOYIdle tonnage primarily 3,000 TEUTotal Idle TEU1,800Idle Fleet as % of Total FleetBenefits ofdiscipline1,35012%9%9006%4503%3.3%02010Idle % Industry supply rationalization anddemand growth driving idle fleetreductionTEU (000's) n of orderbook driven by forming of alliances and ordering discipline1.2.Clarksons Research – October 2019Alphaliner Monthly Monitor – October 201920
Opportunities – Trade Route by Vessel Size100-999 TEU3,000-3,999 TEU7,500-9,999 TEUIdleOther/UnassignedOceania Related1,000-1,999 TEU4,000-5,099 TEU10,000-15,000 TEUME/ISC RelatedLat Am. RelatedIntra-Far EastIntra-EuropeFar East to North Am.Far East to Europe2,000-2,999 TEU5,100-7,499 TEU15,200-23,000 TEUEurope to North Am.Africa Related1.Alphaliner Monthly Monitor – October 201921
Improved Container Industry Fundamentals Industry dynamics characterized by rationalization and discipline Volatility reduced: supply vs demand growth rate Strong, stable demand: GDP-driven growth Stabilizing and sustainability: new normal driven by consolidationStabilization of Supply & DemandFleet Capacity (TEU)Throughput GrowthCapacity Growth3020%15%TEU (millions)2510%205%15–10(5%)5(10%)–(15%)2000 2001 2002 2003 2004 2005 2006 2007 2008 2009 2010 2011 2012 2013 2014 2015 2016 2017 2018 2019F 2020FStabilizing industry driven by robust demand drivers and improved ordering discipline1.Clarksons Research – September 201922
Supply and Demand Balance Supporting RatesCharter Rate Improvement1 Rates improvement primarilydriven by high demand for largervessels, cascading of demanddownwards to smaller sizesSupport from limited number ofdeliveries and low t-17Jan-182,500 TEUApr-18Jul-183,500 TEUOct-18Jan-19Apr-194,400 TEUJul-19Oct-199,000 TEUHistorical Containership Asset Value11Q17 2Q173Q174Q171Q182Q183Q184Q181Q192Q193Q19150%Sale and purchase activity focusedon panamax125%100%75%Asset values stabilized during3Q19; depressed asset valuescreate opportunity for Seaspan50%25%–(25%)Jan-17Apr-17Jul-17Oct-172,600 - 2,900 TEUJan-18Apr-183,200 - 3,600 TEUJul-18Oct-18Jan-194500 TEUApr-19Jul-19Oct-198,500 - 9,100 TEUMarket stabilizing due to demand growth and supply discipline1.Clarksons Research – October 201923
Seaspan Efficiency & Environmental EffortsSAVER Fleet Efficiency Improvements – Mods & Newbuild Initiative has reduced carbon emissions 25% since roll out in 2012 Results in 9.2 million tons abatement since inception SAVER new builds (10000 TEU & 14000 TEU) : 1,250,000 tonnes annually Modifications: 325,000 tonnes annuallyWorld-class designs lead to fuel andemission savingsContainer Loading Improvements Work with customers on load planning - larger load achievements Improved cargo securing arrangements – higher cargo weight capability Improved class approvals – more containers and improved weightcapabilitiesCargo care improvements withsignificant efficiency gainOperational ImprovementsOperational excellence through bestin-class operations Work with customers on operational voyage execution – improved fuelconsumption Improved trim evaluation through load planning and hydrodynamic analysis –improved fuel consumption.Driving efficiency gains thro
In this Investor Day Presentation, Seaspan relies on and refers to information and statistics regarding . Seaspan Investor Relations at 1-778-328-5340 or IR@seaspancorp.com. David Soko