Transcription
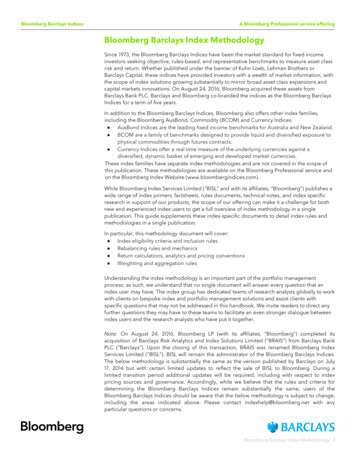
Bloomberg Barclays IndicesA Bloomberg Professional Services offeringBloomberg Barclays MethodologySince 1973, the Bloomberg Barclays Indices have been the market standard for fixed incomeinvestors seeking objective, rules-based, and representative benchmarks to measure asset classrisk and return. Whether published under the banner of Kuhn Loeb, Lehman Brothers orBarclays, these indices have provided investors with a wealth of market information andcontinue to evolve to help investors track new asset classes and capital markets innovations. OnAugust 24, 2016, Bloomberg acquired these assets from Barclays Bank PLC. Barclays andBloomberg co-branded the indices as the Bloomberg Barclays Indices for a term of five years.In addition to the Bloomberg Barclays Indices, Bloomberg also offers other index families,including the Bloomberg AusBond, Commodity (“BCOM”) and Currency Indices. AusBond Indices are the leading fixed income benchmarks for Australia and New Zealand. BCOM are a family of benchmarks designed to provide liquid and diversified exposure tophysical commodities through futures contracts. Currency Indices offer a real time measure of the underlying currencies against adiversified, dynamic basket of emerging and developed market currencies.These, among other, index families have separate methodologies and are not covered in thescope of this publication. These methodologies are available on the Bloomberg Terminal andon the Bloomberg Index Website hile Bloomberg Index Services Limited (“BISL” and with its affiliates, “Bloomberg”) publishes awide range of index primers, factsheets, rules documents, technical notes, and index specificresearch in support of our products, the scope of our offering can make it a challenge for bothnew and experienced index users to get a full overview of the methodology in a singlepublication. This guide supplements these index-specific documents to detail index rules andmethodologies for most of the Bloomberg Barclays Indices in a single publication.In particular, this methodology document will cover: Index eligibility criteria and inclusion rules Rebalancing rules and mechanics Return calculations, analytics and pricing conventions Weighting and aggregation rulesUnderstanding the methodology is an important part of the portfolio management process; assuch, we understand that no single document will answer every question that an index user mayhave. The index group has dedicated teams of research analysts globally to work with clients onbespoke index and portfolio management solutions and assist clients with specific questionsthat may not be addressed in this methodology. We invite readers to direct any furtherquestions they may have to these teams to facilitate an even stronger dialogue between indexusers and the research analysts who have put it together.Bloomberg Barclays Index Methodology 1
Version Tracker*:Date12 December 2018UpdateMethodology Update for BMR requirementsOwnerSherwood Kuo*For the latest updates and rules clarifications since the last version noted above, please see INP GO on the BloombergTerminal or contact a team member at indexhelp@bloomberg.netBloomberg Barclays Methodology 2
ContentsContents . 3About Bloomberg Barclays Indices . 4Benchmark Index Design Principles . .9Benchmark Index Eligibility Rules .11Currency .12Sector .15Credit Quality . 24Amount Outstanding . .28Maturity.33Country . .34Market of Issue . 40Taxability . .42Subordination .43Benchmark Index Rebalancing Rules .46Benchmark Index Pricing and Analytics . 55Benchmark Index Returns Calculations and Weighting Rules . 59Accessing Indices .66Appendices . 67Appendix 1: Total Return Calculations . 67Appendix 2: Index Rules for Currency Hedging and Currency Returns .72Currency Returns and Hedging for Series-B Indices. .80Appendix 3: Detailed Discussion of Excess Return Computations . .84Appendix 4: Benchmark Index Pricing Methodology . 88US Aggregate Index Components . .90Other US Indices .91Pan-European Indices . 92Other Pan-European Indices . .93Asian-Pacific Indices . 94EM Local Currency Government Index-Eligible Currencies . 95Price Timing and Conventions for Nominal Bonds and Convertibles . 96Inflation-Linked Indices . 99Appendix 5: Glossary of Terms . 101Appendix 6: Index Governance and Index Methodology Considerations . 112Bloomberg Barclays Methodology 3
About Bloomberg Barclays IndicesBISL has two core index business lines: 1) Benchmark Indices and 2) Investable Index Products.While benchmark indices (and the risk and return characteristics they provide at the security,sector, and asset class levels) are a fundamental part of the portfolio management process,index demand has evolved beyond traditional long-only measures of broad marketperformance. Investors now also use indices to efficiently measure and access beta, enhancedbeta, and alpha through rigorous and transparent rules-based index products. The suite ofproducts and services reflects this evolution and offers investors a more comprehensiveapproach to portfolio management challenges.OverviewThe range of products andservices offered by Bloombergextends well beyond benchmarkfixed income indices to includeinvestable index productsThe Bloomberg Barclays index brand is most commonly associated with market-leading fixedincome and inflation-linked benchmark indices such as the Global Aggregate Index and WorldGovernment Inflation-Linked Bond Index. However, the range of index products and servicesoffered by Bloomberg extends beyond benchmark indices to include investable index productsdesigned to offer access to systematic strategies (beta, smart beta, and alpha) across multipleasset classes (fixed income, equities, commodities, FX, etc.). Portfolio analytics and portfoliomodeling are complementary functions available through the PORT portfolio managementplatform available through the Bloomberg Terminal.With dedicated teams in the US, Europe and Asia, Bloomberg is able to offer products andservices for a broad array of investor types and portfolio management functions. By firm type,users of Bloomberg Barclays Indices and Bloomberg portfolio analytics and services includeasset managers, insurance companies, pension funds/plan sponsors, investment banks,commercial banks/trust banks, central banks, sovereign wealth funds, hedge funds, ETFproviders, investment consultants, and private wealth and retail investors. By function,investment professionals that use Bloomberg Barclays Indices and Bloomberg portfolio analyticsinclude portfolio managers, investment officers, asset allocators, performance analysts, riskanalysts, research analysts, traders, marketing professionals, structurers, pricing analysts,operations and market data teams, and investment consultants.Bloomberg Barclays Methodology 4
Benchmark IndicesThe Bloomberg Barclays Indices are the most widely used fixed income and inflation-linkedbenchmarks and are an integral part of the active and passive global portfolio managementprocesses. With broad product coverage, a strong history of innovation, and objective andtransparent rules, BISL has continually been recognized as the top index provider. 1 BloombergBarclays Indices are also the most widely used benchmarks for fixed income exchange tradedfunds (“ETFs”).History and EvolutionThe Bloomberg Barclays indexbrand can trace its roots backmore than 40 years, to 1973,with the launch of the USGovernment and US CorporateIndicesThe Bloomberg Barclays Indices can trace their genealogy back to 1973, with the launch of thefirst generally available total return bond indices for the US bond market: the US Governmentand US Investment Grade Corporate Indices. At the request of the Bond Portfolio ManagersAssociation, two Kuhn Loeb researchers 2 created these new bond market benchmarks on July 7,1973, to offer investors a performance target akin to those that had long been available forequities. At the time, bond indices consisting of yield averages had been around for decades,but bond total return indices did not exist.Broad acceptance of total return debt indices took several years; however, asset managementtrends in the 1970s – specifically, the need for greater portfolio accountability – contributed tothe demand for such indices. By the late 1970s, public and private plan sponsors, as well asactive money managers, had embraced these initial US Government and US Corporate Indices.The US Aggregate Index wascreated in 1986The expansion of the platform remained largely rooted in the US capital markets during the1980s. The Municipal Bond Index was launched in January 1980 to track the market for taxexempt municipal securities in the US. In 1986, the Government/Credit Index (created in 1979and used as a first generation broad-based measure of investment grade debt) was expandedto include Mortgage Backed Securities (“MBS”) securities. This expanded second-generationmacro index was called the US Aggregate Index and was backfilled with data to 1976.Since the mid-1980s, the global debt capital markets have evolved and expanded because ofthe acceleration of economic and capital market globalization, rapid technological change andincreased availability of information, and the steady emergence of new issuers and securitytypes. A substantive high yield corporate market emerged first in the US and later in Europe.Emerging markets (“EM”) debt was disintermediated from commercial banks to the publicsecurity markets, with new countries issuing debt in hard currency, local currency, and inflationlinked formats. Fixed- and floating-rate asset backed securities (“ABS”) were issued in the US,Europe and Asia. Commercial mortgage backed securities (“CMBS”) and agency hybrid ARMMBS were introduced. Inflation-linked bonds and floating-rate notes emerged as distinct fixedincome asset classes. Issuance of capital securities, hybrid instruments and convertiblesappealing to both debt and equity investors accelerated. Interest rate, currency and creditdefault swaps were created and became widely used as instruments to express market views infixed income portfolios. Encouraged by the support of our many index users among plansponsors, money managers, consultants, issuers, and academics, the index franchise addedperformance metrics for these new debt asset classes to match the pace of market innovation withbenchmark indices.The Euro Aggregate Index waslaunched in 1998, the GlobalAggregate in 1999, and theAsian-Pacific Aggregate inIndices for new asset classes, such as inflation-linked bonds, 3 ABS, CMBS, and EM, wereintroduced in the 1990s. The multi-currency Global Treasury Index was launched in 1992. A thirdgeneration of macro indices, including the US Universal Index (1999), tracking investment gradeand high yield debt in one benchmark, was originated. In tandem with market and assetBased on Evestement data for fixed income indices.Art Lipson and John Roundtree were analysts at the investment bank Kuhn, Loeb & Co. when these first two indices were created. Kuhn Loeb merged with LehmanBrothers in 1977, and the fixed income index platform existed as part of the Lehman Brothers research offering through a number of subsequent mergers and spinoffs. Itwas subsequently acquired by Barclays in 2008, and then by Bloomberg in 2016.3Inflation-linked indices were independently launched and offered under the Barclays and Lehman Brothers brands. These indices were unified under a single brand inSeptember 2008, but remained as two distinct offerings: Series-B and Series-L Indices, respectively.12Bloomberg Barclays Methodology 5
2000management evolution, the index franchise became a truly global platform with the creation ofthe Euro Aggregate Index in July 1998, Pan-European Aggregate Index in January 1999, AsianPacific Aggregate Index in July 2000, and Global Aggregate Index in January 1999. The GlobalAggregate has seen steady expansion into new investment grade debt markets since its initiallaunch and now tracks 24 different local currency debt markets.In 1997, the first Index Advisory Council was held in the US to collect external feedback to beused in the governance of benchmark indices. Subsequent Index Advisory Councils have beenheld globally in London, Singapore and Tokyo as part of the formal index governance process.In the 2000s, US and Euro Floating-Rate Notes Indices, the Global Capital Securities, FloatingRate ABS Indices, and a Taxable Municipal Index were introduced. In 2002, the CanadianAggregate Index was launched, and in March 2003, a US Convertibles Index was created, withsubsequent EMEA and APAC Convertibles Indices launched in 2010 and 2011, respectively.Local currency indices for China (2004), Russia (2006) and India (2007) were launched to delvedeeper into new local currency debt markets. In 2007, the EM Government Inflation-LinkedBond Index further expanded both the inflation-linked and EM index families. In 2010, astandalone EM Local Currency Government Index family was launched tracking both GlobalAggregate eligible and non-Global Aggregate eligible nominal local currency governmentdebt. In 2012, the LDI Index family was launched as a new replicable benchmark for US liabilitydriven investors.The evolution of indices continues at Bloomberg. In March 2017, Global Aggregate China andEM Local Currency Government China Indices were launched to incorporate China’s RMBdenominated government and policy bank debt. In March 2018, Bloomberg announced the planto begin adding Chinese RMB-denominated government and policy bank debt into the flagshipGlobal Aggregate Index in April 2019.Recent innovations in “smartbeta” indices include the launchof GDP Weighted Indices, FiscalStrength Weighted Indices, ESGthemed indices and DurationHedged IndicesWhile the primary expansion of the Bloomberg Barclays index platform has focused on addedcoverage of new asset classes and a quest to fully map the global fixed income debt markets,there has also been parallel development to create new measures of already covered assetclasses that reflect alternative investment themes. In 2009, float-adjusted versions of BloombergBarclays Indices that exclude publicly announced government holdings were introduced, as wellas GDP weighted versions of existing flagship indices, such as the Global Treasury, GlobalAggregate, and Euro Treasury Indices. In 2011, Fiscal Strength Weighted Indices furtherexpanded alternative weight index offerings, integrating objective measures of a government’sfinancial solvency, dependence on external financing, capacity, and governance to determineindex weights. In 2013, Bloomberg Barclays MSCI ESG Fixed Income Indices were introduced tooffer debt investors a new market standard for benchmarks that formally integrateEnvironmental, Social and Governance criteria into their design. In addition, Bloomberg BarclaysMirror Futures and Duration Hedged Indices were introduced in 2013 to provide investors withfixed income benchmarks that replicate and hedge interest rate duration exposure of existingflagship indices using liquid futures contracts. In 2014, the Green Bond family of indices waslaunched to track bonds that use proceeds for environmental purposes.Product CoverageBloomberg offers a comprehensive set of fixed income benchmarks spanning the investmentgrade, high yield, inflation-linked, hard and local currency EM, municipal, and convertiblemarkets. Product coverage is currently at more than 70,000 securities with over USD50trn inmarket value representing 120 countries and 42 local currency debt markets. Bloombergpublishes more than 40,000 standard and bespoke indices daily. Figure 1 illustrates thecoverage of flagship benchmark index families.Benchmark Index SolutionsBenchmark indices are used by global investors for three primary purposes: 1) as portfolioBloomberg Barclays Methodology 6
performance targets, 2) as informational measures of security-level and asset class risk andreturn characteristics, and 3) as references for in
linked formats. Fixed- and floating-rate asset backed securities (“ABS”) were issued in the US, Europe and Asia. Commercial mortgage backed securities (“CMBS”) and agency hybrid ARM MBS were introduced. Inflation-linked bonds and floating-rate notes emerged
