Transcription
Using PI Integrators to Improve theValue of Your PI System DataMartin Bryant, Field ServiceSeptember 20, 20162016 REGIONAL SEMINARS
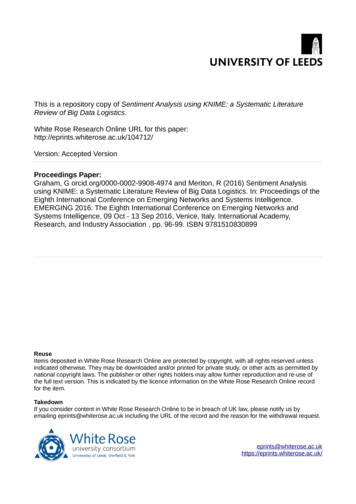
Seeking Value in a Sea of Buzz and JargonMachine LearningData WarehouseOperational IntelligenceInternet of ThingsData ScienceAdvanced AnalyticsBusiness IntelligenceData LakesData MiningPredictive AnalyticsBig DataProcess Efficiency2016 REGIONAL SEMINARSAdvanced Visualization2
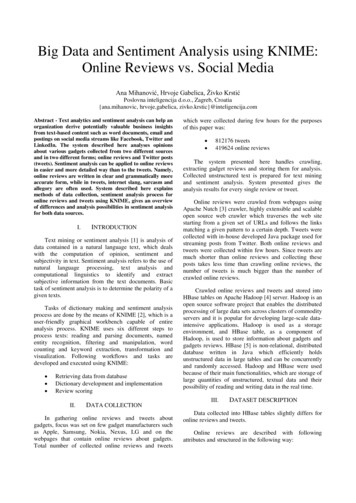
The Importance of Data (and Sensor Data) is Increasing2016 REGIONAL SEMINARS3
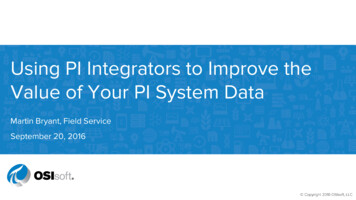
OSIsoft has Listened to Your Needs“We’re looking toget the data intotools likeSpotfire"“Writing customcode andsupporting itindefinitely is justnot an option”“I need to be ableto look at dataacross similar anddifferent assets atthe same time”Summary of Needs:Familiar toolsScalability without codeFlexibility and trust2016 REGIONAL SEMINARS4
PI IntegratorsPI Integrator forBusiness AnalyticsPI SystemPI IntegratorsTime, Eventand AssetContext2016 REGIONAL SEMINARSPI Integrator for Business Analytics SQL Server Hadoop (HIVE & HDFS) Oracle RDBMS File ODBC clientPI Integrator for SAP HANA SAP HANA Smart Data Integration (SDI)TabularContextPI Integrator for Microsoft Azure SQL Data Warehouse Azure SQL Azure Data Lake5
The Traditional PI System2016 REGIONAL SEMINARS
An Alternative Data Use Model2016 REGIONAL SEMINARS
Getting Value Solving complexproblems for a fleetDashboarding – visualreporting – real time &mobileIntegration to new I.T.projects and databasesMultivariate, otherstatistics & machinelearning resourcesOne time answers orRunning modelsDrill drown, rollupAnywhere anytimeThe right way to bringoperational data to I.T.’sBig Data party 262016 REGIONAL SEMINARS
Why? Big data complex problem solvingStatistical AnalyticsAll PI Customers have a great dealof data. Often too much foreffective analysis in a spreadsheet.This data can be complex withmany variables. Multivariable Identifying patterns anddiscovering problemsthrough statistical methodsthat require large anddiverse datasetsanalysis and machine learning canMultidimensionalBusiness Intelligence& Dashboardsprovide interesting and invaluableanswers to complex, bigquestions PI data is very large and complex.This is about finding the answer to large, complex questions.2016 REGIONAL SEMINARSPredictiveStatistical Modelling& Machine Learning
Complex Analyses Increase the Need for Deeper IntegrationDisparate assetsInteracting with assets on an individual basisInteracting with common assets as a fleetSystem OptimizationBenchmarkingProcess OptimizationComplexityMonitoringReal-time visibility Traditional HMIReal-time & historicalviews across anyasset PI ProcessBook PI Coresight PI Datalink2016 REGIONAL SEMINARSFleet-wideperformancecomparisons BI app (e.g. Tableau,Spotfire, Lumira) PI Integrator forBusiness Analytics PI Integrator for SAPHANALarge scalemultivariate analysis Machine learning(Azure ML, R) PI Integrator forBusiness Analytics PI Integrator for SAPHANA10
Applying Data to Maintenance Disparate assetsInteracting with assets on an individual basisComplexityMonitoringWait for failurefaster break & fixData awareUsing run timesand not clockhours toschedulePreventiveMaintenanceand inspections2016 REGIONAL SEMINARSInteracting with common assets as a fleetPredictivePerformanceCompare currentperformancemetrics, includingvibration toexpected valuesBased on thehistory of likeequipment andcircumstances –build a modelthat predictsfailure andtriagesmaintenance11
Results and ROI: Data Integration can Address Key QuestionsMining What material is beinghauled? When was it raining? Are there holes in theroad? What is the grade ofthe hill? When did breaks anddowntime occur? How do drivingbehaviors vary byshift?Oil & Gas When did thegeology change? Which well wasbeing drilled? What angle was thedrill bit? Is production relatedto drill conditions?2016 REGIONAL SEMINARSWind Power Was wind gusty orsteady? Was themaintenanceplanned? How long does thisissue usually take tofix?Pharmaceuticals What product isbeing made? When is theequipment empty? Where was theinstrument when Itook thatmeasurement?Transmission & Dist How are renewablesimpacting theequipment? Was there a voltageviolation? What are thechanges in weather?12
Why? DashboardingVisual Analytics Visualizing diverse sets ofdata sources to gain insights,create reports, and improveoperations Automated daily reportsMultiple data source viewsManagement overviewsKPIs and metricsRollups by business unitFuture Data (forecast)Scheduled and Ad-Hoc ReportingDon’t wait for tomorrow to explore performance todayyour operational data is a click or swipe away.Even from your mobile devices2016 REGIONAL SEMINARS
Result: Improved, Detailed Reporting and AnalyticsDashboard drilldownsto detailed reportsPI Coresight iesRefineryKPI ScorecardsDrilling Activity Reports2016 REGIONAL SEMINARSAsset Performance Displays14
Why? I.T. Integration projectsInformation systems have projects that provide enormous value –and those can benefit from the real-time process awareness of PIData WarehousingData. But PI Data hasn’t been easy to integrate – until now. Centralizing data fromdifferent business systems More effectively analyzingand reporting on businessand building LOBapplicationsStructured PI data in a format readily consumable by the latest I.T. tools.2016 REGIONAL SEMINARS
New Technology is bringing the IT and OT Worlds TogetherI want to analyze production,maintenance logs, and financialI want to build predictivemodels from historical dataI want to spend lesstime on operationalreportsdata all togetherPlant ManagerOTI want to comparemy equipmentagainst our other sitesEngineerBusiness AnalystInfrastructureI want operational datafor the Big Dataproject we’re startingI want trustedproduction data, toITCIObe confident in ourdecisionsI want the operational datato work with our otherI want to minimizerisks through datadriven decisionsCOO2016 REGIONAL SEMINARStechnologiesIT ArchitectI want all data accessible by the BItools my users already know16
Oil and GasDrilling and production comparisonsInformation distributionMiningRoute optimizationEnergy reductionAcross 300 haul trucksLife SciencesReactor comparisonsProcess scale-ups(1L, 3L, 10L, 1kL, 10kL)RenewablesEnergy production reportsWind farm comparisonsOutlier analysisPI Integrator for Business Analyticsis in use today! IT/ OT integrationFood and BeverageUtility usagesProcess analytics Business intelligence and reporting Data warehouse integration Supporting cross-platform projects2016 REGIONAL SEMINARS17
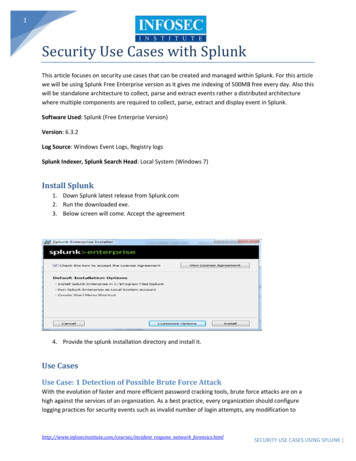
(Big) Data Projects: Sound Attractive But There are Challenges64% of large enterprises plan toimplement a big data project.85% will be unsuccessful.Clean & PrepAnalysisSucceedFailData cleansing and preparation tasks can take50-80% of the development time and funds.Source: t-century-is-tedious-and-that-needs-to-change/2016 REGIONAL SEMINARS18
(Big) Data Projects: Time Spent in the Wrong AreasSource: -data-science-task-survey-says/#5481f6037f752016 REGIONAL SEMINARS19
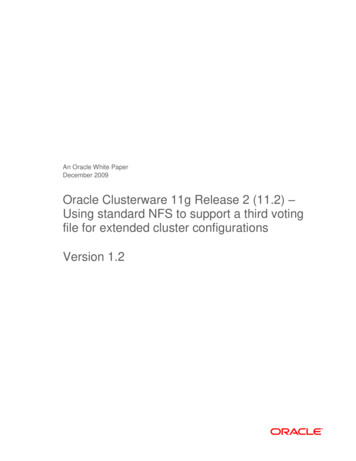
Cleaning & Preparing Sensor Data: It’s ChallengingComm FailureTorqueOil TempSpeedOil 9.860Differentstart timesTorqueOilTempUneven SpacingSpeedSpike /Out of 3:2003:3003:402016 REGIONAL 03:5020
PI Integrators Let You Clean and Prepare PI System Datafor your business intelligence tools,data warehouses, anddata lakesCleanseData odelTransmitNormalizationClean & Prepare2016 REGIONAL SEMINARS21
PI Integrator for Business Analytics - “Select Data” Intuitive way tocreate tabularcontent in “PIViews” Requires AFHierarchy Select AF Elementsand Attributes Scale up leveragingname, hierarchy, orcategory2016 REGIONAL SEMINARS22
PI Integrator for Business Analytics - “Modify View” Select any timerange and interval Add columns forproper aggregatingPI System data Add columns forcommon time anddate functions2016 REGIONAL SEMINARS23
PI Integrator for Business Analytics - “Publish” Select targetedendpoint “PI View”,MS SQL, text file,more to come . Publish once or ona scheduled bases2016 REGIONAL SEMINARS24
Let’s See This in Action!Publishing Building Energy Consumptionfor 67 Buildings to SAP HANA2016 REGIONAL SEMINARS25
2016 REGIONAL SEMINARS
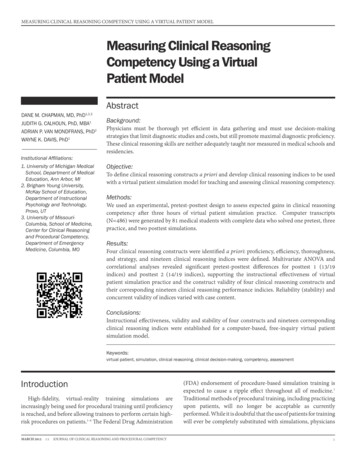
Operational Reporting & Analysis ArchitectureTableauVisualization &AnalyticsSpotfireMSFT BI All BI tools thatsupport ODBCSASData Preparation andIntegration LayerPI Integrator for BusinessAnalytics – BusinessIntelligence EditionSystem of RecordPI Server“I want to analyzeoperations datastored in the PISystem usingmodern BI tools!”272016 REGIONAL SEMINARS27
Enterprise Data Warehouse ArchitectureVisualization &AnalyticsEnterprise DataWarehouse / DataMart / Data le DW, SQL Server, TeradataData Preparation andIntegration LayerPI Integratorfor BusinessAnalyticsSystem of RecordPI Server“I need to fitoperational datainto my existingcompany ITinformationarchitecture!”HadoopCustom or 3rd Party Data Managementand ETLCRMEAMSalesERPHR 282016 REGIONAL SEMINARS28
PI Integrator for SAP HANA ArchitectureSAP HANAHANA StudioHANA SDALinuxSAP DP AgentOption 1Linux / Windows (AllJava) (via SDA)SAP Lumira, VORA, S4, etc.SAP HANA IoT Connector byOSIsoftPI JDBCDirectpublicationinto a HANAschemaOption 2PI Integrator FrameworkWindowsWeb UI Shape DesignerSecurity REST LayerPI ServerDataArchiveWindows2016 REGIONAL SEMINARSPI AssetFramework (AF)Microsoft SQLPI ViewFull platform coverage for alldata integration scenarios!29
Soon PI Integrator for Azure SQL DatawarehouseDATA SOURCESPI SystemPREPAREINGESTANALYZEPUBLISHCONSUMEPI Integrator for AzureCortanaAzure SQLData WarehouseMachine LearningAzure SQLData WarehousePower BIPredictions as Future Data (to PI 2015)Azure Data Factory (Orchestration)On PremiseWeb/LOB DashboardsOn Cloud2016 REGIONAL SEMINARS30
Getting Value Solving complexproblems for a fleetDashboarding – visualreporting – real time &mobileIntegration to new I.T.projects and databasesMultivariate, otherstatistics & machinelearning resourcesOne time answers orRunning modelsDrill drown, rollupAnywhere anytimeThe right way to bringoperational data to I.T.’sBig Data party 262016 REGIONAL SEMINARS
Move the Needle with PI Integrators Start the conversation! Could a colleague make a betterdecision with data you see daily? What business intelligence toolscould you leverage further? Visit YouTube or osisoft.com to seewhich PI Integrator works for you2016 REGIONAL SEMINARSPI Integrator for Business AnalyticsPI Integrator for SAP HANAPI Integrator for Microsoft Azure32
Contact InformationMartin BryantMBryant@osisoft.comField Service EngineerOSIsoft, LLC2016 REGIONAL SEMINARS33
QuestionsPlease wait for the microphonebefore asking your questionsPlease remember to Complete the Surveyfor this sessionState yourname & company2016 REGIONAL SEMINARS34
Thank You2016 REGIONAL SEMINARS
PI Integrator for Business AnalyticsThe PI Integrator for Business Analytics fully realizes the PIinfrastructure goal by providing peerless real-time & deep historicalPI process data to enterprise “big data” dash-boarding, integration,analysis and data scientist tools with easy configuration andperformance.2016 REGIONAL SEMINARS42
PI Integrator For Business Analytics No programming or queries - browser based configuration Integrated to PI AF - uses templates as schemas Rest Model Accessed with ODBC driver New fast PI ODBC Driver & PI Data Access Server Windows Integrated security with delegation (Kerberos) Updates for new data on a schedule2016 REGIONAL SEMINARS
PI Integrator For Business AnalyticsIntegrator Targets: Microsoft SQLServer Hadoop Oracle Ascii files/CSVs SAP Hana (from SAP) Microsoft SQL Datawarehouse for Azure (cloud based)2016 REGIONAL SEMINARS
PI Integrator For Business Analytics Supports PI Event Frames Time Sampling analogous to PI Datalink Data cleansing (nulls/errors), row filtering (by value, etc.),data typing (string/numeric) for each column Aggregations supported – calculate averages, totals forintervals.2016 REGIONAL SEMINARS
OSIsoft University ProgramPI Integrator For Business AnalyticsCompared to previous OSIsoft data access technologies: Much easier to learn(2 hrs instead of 1 day - configured not coded)no coding – no code generators Much higher performing(many millions of rows instead of 100K) 25K outbound events per second Integrates to key 21st century technologiesendorsed by major tech players and many large companiesMore secure2016 REGIONAL SEMINARS
What’s new?Is this merely a new product built by OSIsoft?or does it fit into a larger perspective?Relational database technology is changingTechnology is changing – new opportunities from “Big Data”and internet of things2016 REGIONAL SEMINARS53
Relational database technology is changingSQL – the end of an era Tablular. Not object oriented File oriented. Not scalable Security ChallengesSQL and relational / tabular technologies are not adequate to today’s data.2016 REGIONAL SEMINARS54
Relational database technology is changingWeb Services – not adequate for big data Too slow for big data Transmission and query – but no storage Programming – but no client tools Security Challenges2016 REGIONAL SEMINARS55
Relational database technology is changingBest of both worlds technologies required:REST (representational state transfer) technologies Web interface and transport – designed for the internetPerformance – designed for memory resident scalabilityStandard data formats including binary formatsObject orientedSecure in the current cross platform environment2016 REGIONAL SEMINARS56
Impact of Big Data / Internet of Things TechnologyImpact of Social MediaGoogle, Facebook, and other social media sites have generated massiveamounts of data.This may not seem immediately relevant to industrial applications,But it has driven new search engine and database technologies.And it has resulted in self-service clients to do analysis2016 REGIONAL SEMINARS57
Impact of Big Data / Internet of Things TechnologyImpact of Internet of ThingsAs computing becomes less expensive Every “thing” gets a computer – refrigerators, fitness wristbands, cars,drones, mobile devices,and new industrial devices tooThese devices are not organized andconcentrated pyramidalyand that is demanding and providing newsecure data communications anddatabase technology.2016 REGIONAL SEMINARS58
The Big Data Landscape2016 REGIONAL SEMINARSFrom: http://www.bigdatalandscape.com/59
Why? Big data complex problem solvingStatistical AnalyticsAll PI Customers have a great deal ofdata. Often too much for effectiveanalysis in a spreadsheet. This datacan be complex with many variables. Identifying patterns anddiscovering problemsthrough statistical methodsthat require large anddiverse datasetsMultivariable analysis and machinelearning can provide interesting andinvaluable answers to complex, bigquestions PI data is very large and complex.This is about finding the answer to large, complex questions.2016 REGIONAL SEMINARS How arerenewablesimpacting the grid? What kind of gridcomponents areassociated withvoltage violations? What is the impactof changingweather?
Complex Analyses Increase the Need for Deeper IntegrationDisparate assetsInteracting with assets on an individual basisInteracting with common assets as a fleetSystem OptimizationBenchmarkingProcess OptimizationComplexityMonitoringReal-time visibility Traditional HMIReal-time & historicalviews across anyasset PI ProcessBook PI Coresight PI Datalink2016 REGIONAL SEMINARSFleet-wideperformancecomparisons BI app (e.g. Tableau,Spotfire, Lumira) PI Integrator forBusiness Analytics PI Integrator for SAPHANALarge scalemultivariate analysis Machine learning(Azure ML, R) PI Integrator forBusiness Analytics PI Integrator for SAPHANA61
Enabling Analytics for Operational IntelligenceRetrospective & Predictive AnalysisReal-Time Decision AnalysisPI Integrator forBusiness AnalyticsTime and EventMultidimensionalTrending & AwarenessBusiness Intelligence& DashboardsSpecialized ModelsSimulation & OptimizationDescriptiveCondition & PerformanceTime, Eventand AssetContext2016 REGIONAL SEMINARSTabularContextPredictiveStatistical Modelling& Machine Learning
Why? I.T. Integration projectsInformation systems have projects that provide enormousvalue – and those can benefit from the real-time processData Warehousingawareness of PI Data. But PI Data hasn’t been easy tointegrate – until now. Centralizing data fromdifferent business systems More effectively analyzingand reporting on businessand building LOBapplicationsStructured PI data in a format readily consumable by the latest I.T. tools.2016 REGIONAL SEMINARS
New Technology is bringing the IT and OT Worlds TogetherI want to analyze production,maintenance logs, and financialI want to build predictivemodels from historical dataI want to spend lesstime on operationalreportsdata all togetherPlant ManagerOTI want to comparemy equipmentagainst our other sitesEngineerBusiness AnalystInfrastructureI want operational datafor the Big Dataproject we’re startingI want trustedproduction data, toITCIObe confident in ourdecisionsI want the operational datato work with our otherI want to minimizerisks through datadriven decisionsCOO2016 REGIONAL SEMINARStechnologiesIT ArchitectI want all data accessible by the BItools my users already know17
No single purpose data pools – data lakes that are: Reusable & FlexibleVetted & MaintainedSecureIntegrated with data from other sources2016 REGIONAL SEMINARS65
Why? DashboardingIndustrial companies are replacing periodic row and column reports (day,shift, etc.) with dynamic web-based dashboards – and they are exploringVisual Analyticsthem from their phones and mobile devices. They are combining the nearreal time operational data with financial and administrative data for thecomprehensive view of the immediate road ahead. Visualizing diverse sets ofdata sources to gain insights,create reports, and improveoperationsDon’t wait for tomorrow to explore performance todayyour operational data is a click or swipe away.Even from your mobile devices2016 REGIONAL SEMINARS
Use Case: Management Summaries Automated daily reportsMultiple data source viewsManagement overviewsKPIs and metricsRollups by business unitFuture Data (forecast)Scheduled and Ad-Hoc Reporting2016 REGIONAL SEMINARS67
Result: Improved, Detailed Reporting and AnalyticsDashboard drilldownsto detailed reportsPI Coresight iesRefineryKPI ScorecardsDrilling Activity Reports2016 REGIONAL SEMINARSAsset Performance Displays68
Big Data Projects Sound Easy But there are Complications!64% of large enterprises plan toimplement a big data project.Prep85% will be unsuccessful.Analysis85%Data cleansing and preparation tasks can take50-80% of the development time and /2016 REGIONAL SEMINARS10
OSIsoft has Listened to Your Needs“We’re looking toget the data intotools likeSpotfire!"“Writing customcode andsupporting itindefinitely is justnot an option!“I need to be ableto look at dataacross similar anddifferent assets atthe same time!”Summary of Needs:Familiar toolsScalability without codeFlexibility and trust2016 REGIONAL SEMINARS12
OSIsoft’s Solution Lets You Prepare and Deliver Pro
Tableau Spotfire System of Record Visualization & Analytics Data Preparation and Integration Layer Oracle DW, SQL Server, Teradata Enterprise Data Warehouse / Data Mart / Data Lake Custom Applications SAS MSFT BI Custom or 3rd Party Data Management and ETL CRM Sales EAM ERP HR Hadoop