Transcription
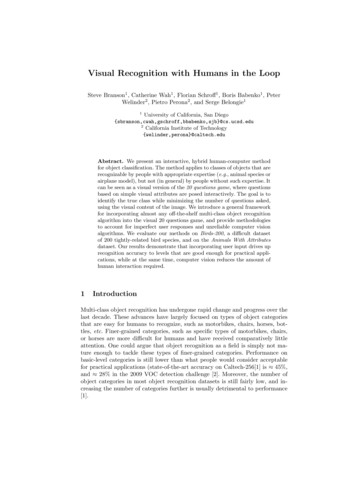
Visual Recognition with Humans in the LoopSteve Branson1 , Catherine Wah1 , Florian Schroff1 , Boris Babenko1 , PeterWelinder2 , Pietro Perona2 , and Serge Belongie11University of California, San .edu2California Institute of Technology{welinder,perona}@caltech.eduAbstract. We present an interactive, hybrid human-computer methodfor object classification. The method applies to classes of objects that arerecognizable by people with appropriate expertise (e.g., animal species orairplane model), but not (in general) by people without such expertise. Itcan be seen as a visual version of the 20 questions game, where questionsbased on simple visual attributes are posed interactively. The goal is toidentify the true class while minimizing the number of questions asked,using the visual content of the image. We introduce a general frameworkfor incorporating almost any off-the-shelf multi-class object recognitionalgorithm into the visual 20 questions game, and provide methodologiesto account for imperfect user responses and unreliable computer visionalgorithms. We evaluate our methods on Birds-200, a difficult datasetof 200 tightly-related bird species, and on the Animals With Attributesdataset. Our results demonstrate that incorporating user input drives uprecognition accuracy to levels that are good enough for practical applications, while at the same time, computer vision reduces the amount ofhuman interaction required.1IntroductionMulti-class object recognition has undergone rapid change and progress over thelast decade. These advances have largely focused on types of object categoriesthat are easy for humans to recognize, such as motorbikes, chairs, horses, bottles, etc. Finer-grained categories, such as specific types of motorbikes, chairs,or horses are more difficult for humans and have received comparatively littleattention. One could argue that object recognition as a field is simply not mature enough to tackle these types of finer-grained categories. Performance onbasic-level categories is still lower than what people would consider acceptablefor practical applications (state-of-the-art accuracy on Caltech-256[1] is 45%,and 28% in the 2009 VOC detection challenge [2]. Moreover, the number ofobject categories in most object recognition datasets is still fairly low, and increasing the number of categories further is usually detrimental to performance[1].
2S. Branson et al.(A) Easy for Humans(B) Hard for HumansChair? Airplane? Finch? Bunting? (C) Easy for HumansYellow Belly? Blue Belly? Fig. 1. Examples of classification problems that are easy or hard for humans.While basic-level category recognition (left) and recognition of low-level visual attributes (right) are easy for humans, most people struggle with finer-grained categories(middle). By defining categories in terms of low-level visual properties, hard classification problems can be turned into a sequence of easy ones.On the other hand, recognition of finer-grained subordinate categories is animportant problem to study – it can help people recognize types of objects theydon’t yet know how to identify. We believe a hybrid human-computer recognitionmethod is a practical intermediate solution toward applying contemporary computer vision algorithms to these types of problems. Rather than trying to solveobject recognition entirely, we take on the objective of minimizing the amountof human labor required. As research in object recognition progresses, tasks willbecome increasingly automated, until eventually we will no longer need humansin the loop. This approach differs from some of the prevailing ways in which people approach research in computer vision, where researchers begin with simplerand less realistic datasets and progressively make them more difficult and realistic as computer vision improves (e.g., Caltech-4 Caltech-101 Caltech-256).The advantage of the human-computer paradigm is that we can provide usableservices to people in the interim-period where computer vision is still unsolved.This may help increase demand for computer vision, spur data collection, andprovide solutions for the types of problems people outside the field want solved.In this work, our goal is to provide a simple framework that makes it aseffortless as possible for researchers to plug their existing algorithms into thehuman-computer framework and use humans to drive up performance to levels that are good enough for real-life applications. Implicit to our model is theassumption that lay-people generally cannot recognize finer-grained categories(e.g., Myrtle Warbler, Thruxton Jackaroo, etc.) due to imperfect memory orlimited experiences; however, they do have the fundamental visual capabilitiesto recognize the parts and attributes that collectively make recognition possible (see Fig. 1). By contrast, computers lack many of the fundamental visualcapabilities that humans have, but have perfect memory and are able to poolknowledge collected from large groups of people. Users interact with our systemby answering simple yes/no or multiple choice questions about an image or ob-
Visual Recognition with Humans in the LoopComputer vision is helpfulThe bird is aBlack‐footedAlbatross3Computer vision is not helpfulIs the bellywhite? yesAre the eyeswhite? yesTh biThebirdd iis aParakeet AukletIs the beak cone‐shaped? yesIs the upper‐tail brown? yesIs the breast solid colored? noIs the breast striped? yesI theIsh throathwhite?hi ? yesThe bird is a Henslow’sSparrowFig. 2. Examples of the visual 20 questions game on the 200 class Bird dataset.Human responses (shown in red) to questions posed by the computer (shown in blue)are used to drive up recognition accuracy. In the left image, computer vision algorithmscan guess the bird species correctly without any user interaction. In the middle image,computer vision reduces the number of questions to 2. In the right image, computervision provides little help.ject, as shown in Fig. 2. Similar to the 20-questions game 1 , we observe that thenumber of questions needed to classify an object from a database of C classesis usually O(log C) (when user responses are accurate), and can be faster whencomputer vision is in the loop. Our method of choosing the next question to askuses an information gain criterion and can deal with noisy (probabilistic) userresponses. We show that it is easy to incorporate any computer vision algorithmthat can be made to produce a probabilistic output over object classes.Our experiments in this paper focus on bird species categorization, which wetake to be a representative example of recognition of tightly-related categories.The bird dataset contains 200 bird species and over 6,000 images. We believethat similar methodologies will apply to other object domains.The structure of the paper is as follows: In Section 2, we discuss relatedwork. In Section 3, we define the hybrid human-computer problem and basicalgorithm, which includes methodologies for modeling noisy user responses andincorporating computer vision into the framework. We describe our datasets andimplementation details in Section 4, and present empirical results in Section 5.2Related WorkRecognition of tightly related categories is still an open area in computer vision, although there has been success in a few areas such as book covers andmovie posters (e.g., rigid, mostly flat objects [3]). The problem is challengingbecause the number of object categories is larger, with low interclass variance,and variability in pose, lighting, and background causes high intraclass variance.Ability to exploit domain knowledge and cross-category patterns and similaritiesbecomes increasingly important.There exist a variety of datasets related to recognition of tightly-related categories, including Oxford Flowers 102 [4], UIUC Birds [5], and STONEFLY9[6]. While these works represent progress, they still have shortcomings in scalingto large numbers of categories, applying to other types of object domains, or1See for example http://20q.net.
4S. Branson et al.Computer VisionQuestion 1:Is the belly black?Question 2:Is the bill hooked?A: NOInput Image (A: YES)Fig. 3. Visualization of the basic algorithm flow. The system poses questionsto the user, which along with computer vision, incrementally refine the probabilitydistribution over classes.achieving performance levels that are good enough for real-world applications.Perhaps most similar in spirit to our work is the Botanist’s Field Guide [7],a system for plant species recognition with hundreds of categories and tens ofthousands of images. One key difference is that their system is intended primarily for experts, and requires plant leaves to be photographed in a controlledmanner at training and test time, making segmentation and pose normalizationpossible. In contrast, all of our training and testing images are obtained fromFlickr in unconstrained settings (see Fig. 4), and the system is intended to beused by lay people.There exists a multitude of different areas in computer science that interleavevision, learning, or other processing with human input. Relevance feedback [8]is a method for interactive image retrieval, in which users mark the relevance ofimage search results, which are in turn used to create a refined search query. Active learning algorithms [9–11] interleave training a classifier with asking usersto label examples, where the objective is to minimize the total number of labeling tasks. Our objectives are somewhat similar, except that we are queryinginformation at runtime rather than training time. Expert systems [12, 13] involveconstruction of a knowledge base and inference rules that can help non-expertssolve a problem. Our approach differs due to the added ability to observe imagepixels as an additional source of information. Computationally, our method alsohas similarities to algorithms based on information gain, entropy calculation,and decision trees [14–16].Finally, a lot of progress has been made on trying to scale object recognitionto large numbers of categories. Such approaches include using class taxonomies[17, 18], feature sharing [19], error correcting output codes (ECOC) [20], andattribute based classification methods [21–23]. All of these methods could beeasily plugged into our framework to incorporate user interaction.3Visual Recognition With Humans in the LoopGiven an image x, our goal is to determine the true object class c {1.C} byposing questions based on visual properties that are easy for the user to answer(see Fig. 1). At each step, we aim to exploit the visual content of the image and
Visual Recognition with Humans in the Loop5Algorithm 1 Visual 20 Questions Game1:2:3:4:5:6:U0 for t 1 to 20 doj(t) maxk I(c; uk x, U t 1 )Ask user question qj(t) , and U t U t 1 uj(t) .end forReturn class c maxc p(c x, U t )the current history of question responses to intelligently select the next question.The basic algorithm flow is summarized in Fig. 3.Let Q {q1 .qn } be a set of possible questions (e.g., IsRed?, HasStripes?,etc.), and Ai be the set of possible answers to qi . The user’s answer is somerandom variable ai Ai . We also allow users to qualify each response with aconfidence value ri V, (e.g., V {Guessing, Probably, Definitely}). The user’sresponse is then a pair of random variables ui (ai , ri ).At each time step t, we select a question qj(t) to pose to the user, wherej(t) 1.n. Let j {1.n}T be an array of T indices to questions we willask the user. U t 1 {uj(1) .uj(t 1) } is the set of responses obtained by timestep t 1. We use maximum information gain as the criterion to select qj(t) .Information gain is widely used in decision trees (e.g. [15]) and can be computedfrom an estimate of p(c x, U t 1 ).We define I(c; ui x, U t 1 ), the expected information gain of posing the additional question qi , as follows: I(c; ui x, U t 1 ) Eu KL p(c x, ui U t 1 ) k p(c x, U t 1 )(1)X t 1t 1t 1 p(ui x, U ) H(c x, ui U ) H(c x, U ) (2)ui Ai Vwhere H(c x, U t 1 ) is the entropy of p(c x, U t 1 )H(c x, U t 1 ) CXp(c x, U t 1 ) log p(c x, U t 1 )(3)c 1The general algorithm for interactive object recognition is shown in Algorithm1. In the next sections, we describe in greater detail methods for modeling userresponses and different methods for incorporating computer vision algorithms,which correspond to different ways to estimate p(c x, U t 1 ).3.1Incorporating Computer VisionWhen no computer vision is involved it is possible to pre-compute a decisiontree that defines which question to ask for every possible sequence of user responses. With computer vision in the loop, however, the best questions dependdynamically on the contents of the image.
6S. Branson et al.In this section, we propose a simple framework for incorporating any multiclass object recognition algorithm that produces a probabilistic output overclasses. We can compute p(c x, U ), where U is any arbitrary sequence of responses, as follows:p(c x, U ) p(U c)p(c x)p(U c, x)p(c x) ZZ(4)Pwhere Z c p(U c)p(c x). Here, we make the assumption that p(U c, x) p(U c); effectively this assumes that the types of noise or randomness that wesee in user responses is class-dependent and not image-dependent. We can stillaccommodate variation in responses due to user error, subjectivity, externalfactors, and intraclass variance; however we throw away some image-related information (for example, we lose ability to model a change in the distribution ofuser responses as a result of a computer-vision-based estimate of object pose).In terms of computation, we estimate p(c x) using a classifier trained offline(more details in Section 4.3). Upon receiving an image, we run the classifier onceat the beginning of the process, and incrementally update p(c x, U ) by gatheringmore answers to questions from the user. One could imagine a system where alearning algorithm is invoked several times during the process; as categories areweeded out by answers, the system would use a more tuned classifier to updatethe estimate of p(c x). However, our preliminary experiments with such methodsdid not show an advantage2 . Note that when no computer vision is involved, wesimply replace p(c x) with a prior p(c).3.2Modeling User ResponsesRecall that for each question we may also ask a corresponding confidence valuefrom the user, which may be necessary when an attribute cannot be determined(for example, when the associated part(s) are not visible). We assume that thequestions are answered independently given the category:p(U t 1 c) t 1Yp(ui c)(5)iThe same assumption allows us to express p(ui x, U t 1 ) in Equation 2 asp(ui x, U t 1 ) CXp(ui c)p(c x, U t 1 )(6)c 1It may also be possible to use a more sophisticated model in which we estimate afull joint distribution for p(U t 1 c); in our preliminary experiments this approachdid not work well due to insufficient training data.2See supplementary materialbirds200.html) for more details.(http://www.vision.caltech.edu/visipedia/
Visual Recognition with Humans in the LoopIvory GullBank SwallowIndigo BuntingWhip poor will7Chuck will’s widow1back colorback patternbelly colorbelly patternbill shapebreast colorbreast patterncrown coloreye colorforehead colorhead patternleg colornape colorprimary colorshapesizetail patternthroat colorunder tail colorunderparts colorupper tail colorupperparts colorwing colorwing patternwing g. 4. Examples of user responses for each of the 25 attributes. The distribution over {Guessing,Probably,Definitely} is color coded with blue denoting 0% and reddenoting 100% of the five answers per image attribute pair.To compute p(ui c) p(ai , ri c) p(ai ri , c)p(ri c), we assume that p(ri c) p(ri ). Next, we compute each p(ai ri , c) as the posterior of a multinomial distribution with Dirichlet prior Dir αr p(ai ri ) αc p(ai c) , where αr and αc areconstants, p(ai ri ) is a global attribute prior, and p(ai c) is estimated by poolingtogether certainty labels. In practice, we use a larger prior term for Guessingthan Definitely, αguess αdef , which effectively down weights the importanceof any response with certainty level Guessing.4Datasets and Implementation DetailsIn this section we provide a brief overview of the datasets we used, methodsused to construct visual questions, computer vision algorithms we tested, andparameter settings.4.1Birds-200 DatasetBirds-200 is a dataset of 6033 images over 200 bird species, such as MyrtleWarblers, Pomarine Jaegars, and Black-footed Albatrosses – classes that cannotusually be identified by non-experts. In many cases, different bird species arenearly visually identical (see Fig. 8).We assembled a set of 25 visual questions (list shown in Fig. 4), which encompass 288 binary attributes (e.g., the question HasBellyColor can take on 15 different possible colors). The list of attributes was extracted from whatbird.com3 ,a bird field guide website.3http://www.whatbird.com/
8S. Branson et al.We collected “deterministic” class-attributes by parsing attributes from whatbird.com. Additionally, we collected data of how non-expert users respond to attribute questions via a Mechanical Turk interface. To minimize the effects of usersubjectivity and error, our interface provides prototypical images of each possible attribute response. The reader is encouraged to look at the supplementarymaterial for screenshots of the question answering user-interface and exampleimages of the dataset.Fig. 4 shows a visualization of the types of user response results we get on theBirds-200 dataset. It should be noted that the uncertainty of the user responsesstrongly correlates with the parts that are visible in an image as well as overalldifficulty of the corresponding bird species.When evaluating performance, test results are generated by randomly selecting a response returned by an MTurk user for the appropriate test image.4.2Animals With AttributesWe also tested performance on the Animals With Attributes (AwA) [21], adataset of 50 animal classes and 85 binary attributes. We consider this datasetless relevant than birds (because classes are recognizable by non-experts), andtherefore do not focus as much on this dataset.4.3Implementation Details and Parameter SettingsFor both datasets, our computer vision algorithms are based on Andrea Vedaldi’spublicly available source code [24], which combines vector-quantized geometricblur and color/gray SIFT features using spatial pyramids, multiple kernel learning, and per-class 1-vs-all SVMs. We added features based on full image colorhistograms and vector-quantized color histograms. For each classifier we usedPlatt scaling [25] to learn parameters for p(c x) on a validation set. We used15 training examples for each Birds-200 class and 30 training examples for eachAwA class. Bird training and testing images are roughly cropped.Additionally, we compare performance to a second computer vision algorithmbased on attribute classifiers, which we train using the same features/trainingcode, with positive and negative examples set using whatbird.com attribute labels. We combined attribute classifiers into per-class probabilities p(c x) usingthe method described in [21].For estimating user response statistics on the Birds-200 dataset, we usedαguess 64, αprob 16, αdef 8, and αc 8 (see Section 3.2).5ExperimentsIn this section, we provide experimental results and analysis of the hybrid-humancomputer classification paradigm. Due to space limitations, our discussion focuses on the Birds dataset. We include results (see Fig. 9) from which the usercan verify that trends are similar on Birds-200 and AwA, and we include additional results on AwA in the supplementary material.
Visual Recognition with Humans in the Loop91Percent Classified CorrectlyRose‐breasted Grosbeak0.80.60.4Deterministic UsersMTurk UsersMTurk Users Model0.2001020304050Number of Binary Questions Asked60Q: Is the belly red? yes (Def)Q: Is the breast black? yes (Def.)Q : Is the primary color red? yes (Def.)Fig. 5. Different Models of User Responses: Left: Classification performance onBirds-200 (Method 1) without computer vision. Performance rises quickly (blue curve)if users respond deterministically according to whatbird.com attributes. MTurk usersrespond quite differently, resulting in low performance (green curve). A learned modelof MTurk responses is much more robust (red curve). Right: A test image where usersanswer several questions incorrectly and our model still classifies the image correctly.5.1Measuring PerformanceWe use two main methodologies for measuring performance, which correspondto two different possible user-interfaces:– Method 1: We ask the user exactly T questions, predict the class withhighest probability, and measure the percent of the time that we are correct.– Method 2: After asking each question, we present a small gallery of imagesof the highest probability class, and allow the user to stop the system early.We measure the average number of questions asked per test image.For the second method, we assume that people are perfect verifiers, e.g., theywill stop the system if and only if they have been presented with the correctclass. While this is not always possible in reality, there is some trade-off betweenclassification accuracy and amount of human labor, and we believe that thesetwo metrics collectively capture the most important considerations.5.2ResultsIn this section, we present our results and discuss some interesting trends towardunderstanding the visual 20 questions classification paradigm.User Responses are Stochastic: In Fig. 5, we show the effects of differentmodels of user responses without using any computer vision. When users areassumed to respond deterministically in accordance with the attributes fromwhatbird.com, performance rises quickly to 100% within 8 questions (roughlylog2 (200)). However, this assumption is not realistic; when testing with responses
10S. Branson et al.0.20.7No CV (11.11)Percent of Testset ImagesPercent Classified Correctly0.60.50.40.30.2No CV1 vs allAttribute0.10010203040Number of Binary Questions Asked0.10.050501 vs all (6.64)Attribute (6.43)0.150246810Number of Binary Questions Asked121416Fig. 6. Performance on Birds-200 when using computer vision: Left Plot:comparison of classification accuracy (Method 1) with and without computer visionwhen using MTurk user responses. Two different computer vision algorithms are shown,one based on per-class 1-vs-all classifiers and another based on attribute classifiers.Right plot: the number of questions needed to identify the true class (Method 2) dropsfrom 11.11 to 6.43 on average when incorporating computer vision.from Mechanical Turk, performance saturates at around 5%. Low performancecaused by subjective answers are unavoidable (e.g., perception of the color brownvs. the color buff), and the probability of the correct class drops to zero afterany inconsistent response. Although performance is 10 times better than randomchance, it renders the system useless. This demonstrates a challenge for existing field guide websites. When our learned model of user responses (see Section3.2) is incorporated, performance jumps to 66% due to the ability to tolerate areasonable degree of error in user responses (see Fig. 5 for an example). Nevertheless, stochastic user responses increase the number of questions required toachieve a given accuracy level, and some images can never be classified correctly,even when asking all possible questions. In Section 5.2, we discuss the reasonswhy performance saturates at lower than 100% performance.Computer Vision Reduces Manual Labor: The main benefit of computervision occurs due to reduction in human labor (in terms of the number of questions a user has to answer). In Fig. 6, we see that computer vision reduces theaverage number of yes/no questions needed to identify the true bird species from11.11 to 6.43 using responses from MTurk users. Without computer vision, thedistribution of question counts is bell-shaped and centered around 6 questions.When computer vision is incorporated, the distribution peaks at 0 questions butis more heavy-tailed, which suggests that computer vision algorithms are oftengood at recognizing the “easy” test examples (examples that are sufficiently similar to the training data), but provide diminishing returns toward classifying theharder examples that are not sufficiently similar to training data. As a result,computer vision is more effective at reducing the average amount of time thanreducing the time spent on the most difficult images.User Responses Drive Up Performance: An alternative way of interpreting the results is that user responses drive up the accuracy of computer vision
Visual Recognition with Humans in the w/o// nlyCVCVCVCV Q Q#1:#1:Is (Def.)(Def.)breastedbreastedGrosbeakGrosbeakFig. 7. Examples where computer vision and user responses work together:Left: An image that is only classified correctly when computer vision is incorporated.Additionally, the computer vision based method selects the question HasThroatColorWhite, a different and more relevant question than when vision is not used. In the rightimage, the user response to HasCrownColorBlack helps correct computer vision whenits initial prediction is wrong.algorithms. In Fig. 6, we see that user responses improve overall performancefrom 19% (using 0 questions) to 66%.Computer Vision Improves Overall Performance: Even when users answer all questions, performance saturates at a higher level when using computervision ( 69% vs. 66%, see Fig. 6). The left image in Fig. 7 shows an exampleof an image classified correctly using computer vision, which is not classified correctly without computer vision, even after asking 60 questions. In this example,some visually salient features like the long neck are not captured in our list ofvisual attribute questions. The features used by our vision algorithms also capture other cues (such as global texture statistics) that are not well-representedin our list of attributes (which capture mostly color and part-localized patterns).Different Questions Are Asked With and Without Computer Vision:In general, the information gain criterion favors questions that 1) can be answered reliably, and 2) split the set of possible classes roughly in half. Questionslike HasShapePerchingLike, which divide the classes fairly evenly, and HasUnderpartsColorYellow, which tends to be answered reliably, are commonly chosen.When computer vision is incorporated, the likelihood of classes change anddifferent questions are selected. In the left image of Fig. 7, we see an examplewhere a different question is asked with and without computer vision, whichallows the system to find the correct class using one question.Recognition is Not Always Successful: According the the Cornell Ornithology Website4 , the four keys to bird species recognition are 1) size and age.aspx?pid 1053
12S. Branson et al.Parakeet AukletLeast AukletSayornisGray KingbirdQ : Is the belly multi‐colored? yes (Def.)Fig. 8. Images that are misclassified by our system: Left: The Parakeet Aukletimage is misclassified due to a cropped image, which causes an incorrect answer to thebelly pattern question (the Parakeet Auklet has a plain, white belly, see Fig. 2). Right:The Sayornis and Gray Kingbird are commonly confused due to visual similarity.2) color and pattern, 3) behavior, and 4) habitat. Bird species classification isa difficult problem and is not always possible using a single image. One potential advantage of the visual 20 questions paradigm is that other contextualsources of information such as behavior and habitat can easily be incorporatedas additional questions.Fig. 8 illustrates some example failures. The most common failure conditionsoccur due to 1) classes that are nearly visually identical, 2) images of poorviewpoint or low resolution, such that some parts are not visible, 3) significantmistakes made by MTurkers, or 4) inadequacies in the set of attributes we used.1-vs-all Vs. Attribute-Based Classification: In general, 1-vs-all classifiersslightly outperform attribute-based classifiers; however, they converge to similarperformance as the number of question increases, as shown in Fig. 6 and 9. Thefeatures we use (kernelized and based on bag-of-words) may not be well suitedto the types of attributes we are using, which tend to be localized and associatedwith a particular part. One potential advantage of attribute-based methods iscomputational scalability when the number of classes increases; whereas 1-vsall methods always require C classifiers, the number of attribute classifiers canbe varied in order to trade-off accuracy and computation time. The table belowdisplays the average number of questions needed (Method 1) on the Birds datasetusing different number of attribute classifiers (which were selected randomly):200 (1-vs-all) 288 attr. 100 attr. 50 attr. 20 attr. 10 attr.6.436.727.017.678.819.526ConclusionObject recognition remains a challenging problem for computer vision. Furthermore, recognizing tightly related categories in one shot is difficult even for hu-
Visual Recognition with Humans in the Loop1130.35No CV (5.95)1 vs all (4.31)Attribute (4.11)0.90.3Percent of Testset ImagesPercent Classified Correctly0.80.7
While basic-level category recognition (left) and recognition of low-level visual at-tributes (right) are easy for humans, most people struggle with ner-grained categories (middle). By de ning categories in terms of low-level visual properties, hard classi ca-tion problems can be turned into a sequence of easy ones.