Transcription
This is a repository copy of Sentiment Analysis using KNIME: a Systematic LiteratureReview of Big Data Logistics.White Rose Research Online URL for this n: Accepted VersionProceedings Paper:Graham, G orcid.org/0000-0002-9908-4974 and Meriton, R (2016) Sentiment Analysisusing KNIME: a Systematic Literature Review of Big Data Logistics. In: Proceedings of theEighth International Conference on Emerging Networks and Systems Intelligence.EMERGING 2016: The Eighth International Conference on Emerging Networks andSystems Intelligence, 09 Oct - 13 Sep 2016, Venice, Italy. International Academy,Research, and Industry Association , pp. 96-99. ISBN 9781510830899ReuseItems deposited in White Rose Research Online are protected by copyright, with all rights reserved unlessindicated otherwise. They may be downloaded and/or printed for private study, or other acts as permitted bynational copyright laws. The publisher or other rights holders may allow further reproduction and re-use ofthe full text version. This is indicated by the licence information on the White Rose Research Online recordfor the item.TakedownIf you consider content in White Rose Research Online to be in breach of UK law, please notify us byemailing eprints@whiterose.ac.uk including the URL of the record and the reason for the withdrawal terose.ac.uk/
Sentiment Analysis using KNIME: a Systematic Literature Review of Big Data LogisticsGary GrahamRoy MeritonBusiness SchoolLeeds UniversityLeeds, UKe-mail:g.graham@leeds.ac.ukBusiness SchoolLeeds UniversityLeeds, UKcen5rfm@leeds.ac.ukAbstract— Text analytics and sentiment analysis canhelp researchers to derive potentially valuable thematicand narrative insights from text-based content such asindustry reviews, leading OM and OR journal articlesand government reports. The classification systemdescribed here analyses the aggregated opinions of theperformance of various public and private, medical,manufacturing, service and retail organizations inintegrating big data into their logistics. It explainsmethods of data collection and the sentiment analysisprocess for classifying big data logistics literature usingKNIME. Finally, it explores the potential of text miningto build more rigorous and unbiased models ofoperations management.Keywords-Big data, logistics, sentiment analysis, KNIME,text analytics.I.INTRODUCTIONBig data logistics can be defined as the modelling andanalysis of (urban) transport and distribution systemsthrough large data sets created by GPS, cell phone andtransactional data of company operations, combined withhuman generated activity (i.e. social media, publictransport) [1]. The demands and requirements are literallychanging on a daily basis with the innovation intechnologies with smart computing and big data. All typesof organization whose logistics operation functions in a bigdata environment will have to adapt to changing customerdemands. At the same time they will need to exploit theavailability of big data technology to improve their processand operational capabilities. Big data requires firms to havemore technical and technological supports to handle the fiveV’s of Big Data and analytics that is “Volume”, “Variety”,Veracity”, “Value” and “Velocity” [2]. However, with thegrowth of big data there is privacy surveillance and datamisuse challenges [3]. Organizations also face challengesaround quality, comprehensiveness, collection and theanalysis of data from various sources. Furthermore, big dataalso needs to be robust, accessible, and interpretable if it isto provide organizations with meaningful opportunities andsolutions.The purpose of this paper therefore is to explore the risksand challenges of organizations implementing “big datalogistics” into their operations. Secondly, to investigate theopportunities that big data provides organizations with, toimprove their logistics performance. This will be achievedthrough the text processing of 552 records containingindustry reviews, leading OM and OR journal articles andgovernment reports. We will analyse the opinions of theperformance of various public and private, manufacturing,medical, service and retail organizations in integrating bigdata (analytics) into their logistics.II.KNIME METHODThe KNIME text processing feature was designed anddeveloped to read and process textual data [4][5], andtransform it into numerical data (document and termvectors) in order to apply regular KNIME data mining nodes(for classification and clustering). This feature allows for theparsing of texts available in various formats (here we used.csv) as KNIME data cells stored in a data table. It is thenpossible to recognize and tag different kinds of namedentities such as with positive and negative sentiment, thusenrichening the documents semantically. Furthermore,documents can be filtered (e.g. by the stop word or namedentity filters), stemmed by stemmers for various languagespre-processed in many other ways. Frequencies of wordscan be computed, keywords extracted and documents can bevisualized (e.g. tag clouds). To apply regular KNIME nodesto cluster or classify documents according to theirsentiment, they can be transformed into numerical vectors.Web of Science (WOS) and Scopus are powerfuldatabases which provide different searching and browsingoptions [9]. The search options in both databases are theStandard Basic and Advanced. There are differentsearchable fields and several document types that permit theuser to easily narrow their searching. Both databases sort theresults by parameters such as; first author, cites, relevanceand etc. The Refine Results section in both databases allowsthe user to quickly limit or exclude results by author, source,year, subject area, document type, institutions, countries,funding agencies and languages. The resulting documentsprovide a citation, abstract, and references at a minimum.Results may be printed, e-mailed, or exported to a citationmanager. The results may also be reorganized according to
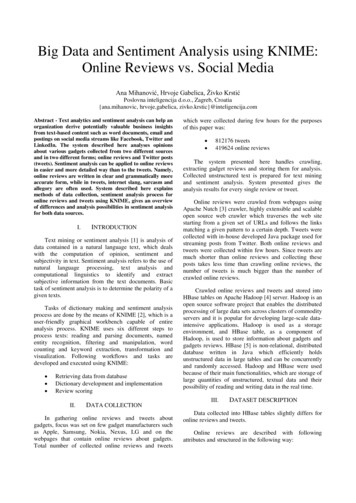
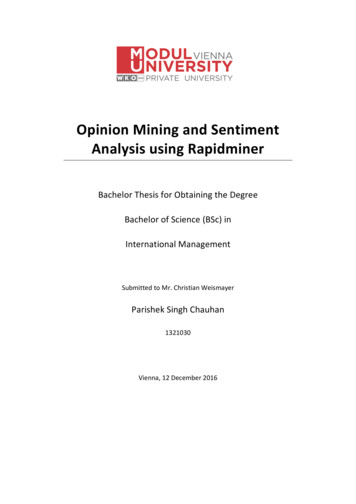
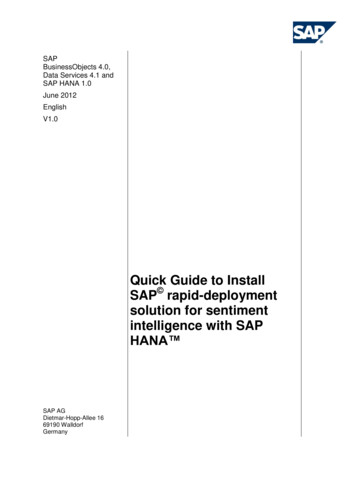
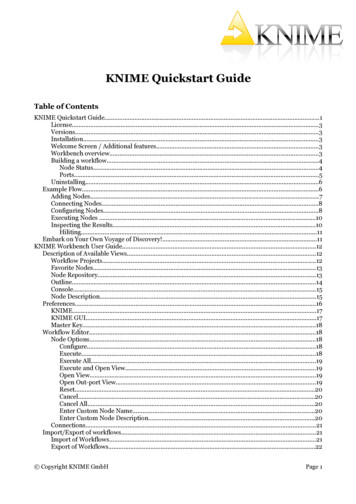
the needs of the researcher by simply clicking on theheadings of each column. Our search of “big data logistics”documents resulted in 552 records being retrieved from aten year period from 2006 to 2016.Table 1 Big data logistics sentimentsThe described data was then loaded into KNIME withthe File Reader node and processed. In this phase, onlyrecords in English language were collected. Language of thetext is set to English and all texts that have differentlanguage values are filtered out, because English dictionaryapplied on reviews and posts written in other languageswould not give results. Dictionary built for sentimentanalysis of the phrase “big data” as it is used with respect tothe term “logistics” was graded only as positive or negative.Scoring or sentiment analysis of the phrase “big datalogistics” is done on the positive-negative level, thereforethe phrase was analysed on the word level, giving each wordassociated with it a positive or negative polarity. Forinstance, efficiency would be scored positive whilst riskswould be scored negatively.For this task, publicly available MPQA subjectivitylexicon was used as a starting point for recognizingcontextual polarity [7], this was expanded with a big datavocabulary built from the authors previous papers [3]. Theexisting dictionary containing of approximately 8000 wordsis expanded to fit the needs for sentiment analysis in a waythat initial portion of sentences are collected, which areseparated into single words with Bag of Words processing.Unnecessary words such as symbols or web URLs arefiltered out and all useful, big data specific words are gradedand added to the dictionary. For instance, “veracity”,“value”, “volume”, “variety” and “velocity”.The records were analysed on the word level giving apositive or negative grade for a term connected to eachphrase. Whilst text analytics of documents is usuallyaccomplished simply with phrases counters and meancalculations, our analytics is frequency-driven. Twoseparate work flows were therefore built, one for calculatingfrequency based on a grade and category, and other one forpositive-negative (sentiment) grading. These results arepresented in Table 1.TF*IDF (Term Frequency*Inverse Document Frequency)[7] method assigns non-binary weights related on a numberof occurrences of a word. Weighting exploits counts from abackground corpus, which is a large collection ofdocuments; the background corpus serves as indication ofhow often a word may be expected to appear in an arbitrarytext. TF*IDF calculation determines how relevant a givenword is in a particular document.Besides term frequencywhich equals the number oftimes word appears in a document, size of the corpus isalso needed. Given a document collection, a word and anindividual document, TF*IDF value can becalculated:T(1)Total score for each word is given by multiplyingTF*IDF value with attitude of a term. Attitude can have oneof three values depending on the word polarity; -1 for wordwith negative polarity, 1 for word with positive polarityand 0 for neutral words. Final weights, which now representattitude of each document , are grouped on the level ofdocument and binned into three bins to give one of threefinal results for each term; positive, negative or neutral(Table. 2).
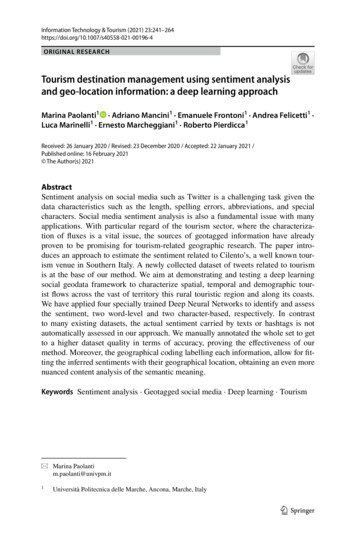
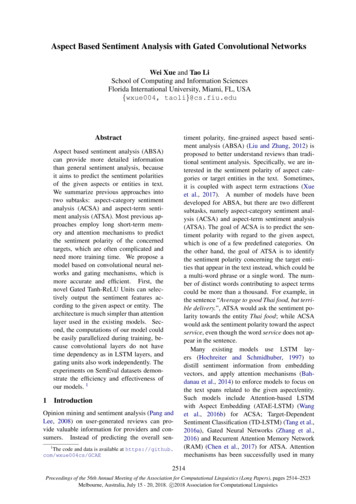
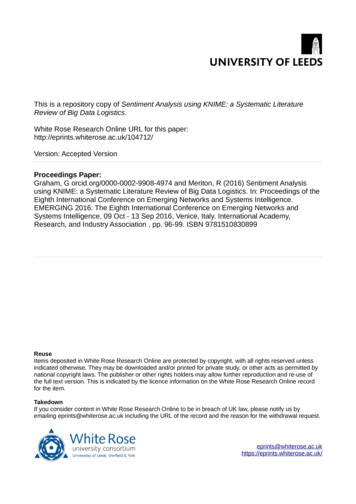
Table 2 TF-IDF Processingbig data. In Figure 2 it can be seen that sentiments are farmore positive (245) than negative (95).Figure 2 Aggregated sentimentsIV.CLASSIFICATION EXPERIMENTIn order to test the validity of the TF*IDF classificationmodel we ran a prototype experiment with the ten mostcommon words extracted (i.e. those with the highestTF*IDF scores) (see Table 3 below).Table 3 Most occurring wordsIII.RESULTSTag clouds were initially used to visualise our initialfindings. A simple tag cloud presented in Figure 1 gives themost used words in the positive (left hand cloud) andnegative used words (right hand allengesFailuresCultureLiabilityComplexWasteThen using the TF*IDF decision tree learner/predictorapproach we tested the accuracy of the classification system(that we had adopted in differentiating the big data logisticssentiments). Our rests are presented in Table 4.Figure 1 Tag clouds of positive/negative sentimentThe attitudes towards big data were classified as“positive”, “neutral” and “negative”. Neutral grades can beavoided, and we accomplished this by removing grade binsand removing a bin for neutral grade. The positive andnegative grades were aggregated for all terms associated with
Table 4 Classification uePo FalsePo TrueNe FalseNe False No Recall PrecisionSensitivitySpecificityF MeasureAccuracy CohenKappa133112010.29510.279 NegFalseNegRecallPrecisionSensitivitySpecificityF MeasureAccuracyCohen's -0.810912.7173.7281 12.717-6.0956 38.4034theoretical frameworks. Furthermore, it could be adopted tobuild much more grounded and unbiased coding systems ofqualitative data. Our work confirms that of Foss Wamba etal., [2] and Mehmood et al., [3], that is, we can confirm thereis a growth in opinion on big data, not only at strategic andpolicy levels, but also with respect to its operationalimplementation. Thematic patterns and frameworkcategories need building from our extracted key terms. Then,linkages and co-occurrences need exploring to establish agrounded approach for building theory from KNIME andother data mining tools [4[10][11]. As well as positivesentiments theoreticians need to factor in more negative andrisk constructs to enable more robust and accurate modeldevelopment. More in-depth analysis and more discretemodelling are clearly needed to assist in the implementationof big data initiatives [2].REFERENCES[1]Our model shows a predictive accuracy of 88% inclassifying the textual data. We then tested using thehierarchical classification function in Knime the ability ofthe classification model to deal with the addition of features.From Figure 3 we can see by feature 4 that the modelpeaked at 100% accuracy and then maintained this level ofaccuracy as features kept being added to it.Figure 3 Model features accuracySo this initial test prototype of the model seems to have ahigh degree of accuracy and validity in dealing withsentiment classification. However, this is only a prototypeof the decision model, so more robust testing will be neededin the future. Specifically, this will provide more stringentMPLA testing for variance.V CONCLUSIONSIn this paper, we have presented a novel approach toextracting key words and predicting “positive” and“negative” sentiments. We proved the validity of ourapproach by examining different classifiers that utilizedtwenty features extracted from the TF*IDF processing [7].This model is only a prototype to highlight the textprocessing potential of KNIME [6][8]. In the future, weintend to build comparisons between a range of industrialand retail sectors. We see the role of KNIME potentially asan important mediating step in the framing and building ofBlanco, E.E. and Fransoo, J. C. (2013). “Reaching 50 millionnanostores: retail distribution in emerging megacities”. TUE WorkingPaper – 404. January.[2] Fosso Wamba, S., Akter, S., Edwards, A., Chopin, G. and Gnanzou,D. (2015). “How ‘big data’ can make big impact: Findings from asystematic review and a longitudinal case study”. InternationalJournal of Production Economics, 34, 2, pp. 77-84.[3] Mehmood, R., Meriton, R., Graham, G., Hennelly, P. and Kumar, M.(2016). “Exploring the influence of big data on city t
The KNIME text processing feature was designed and developed to read and process textual data [4][5], and transform it into numerical data (document and term vectors)inordertoapplyregularKNIMEdataminingnodes forthe parsingoftextsavailableinvariousformats(here