Transcription
APPENDIX 7-B. SYSTEM CURVE DERIVATION FOR FURNACE FANSTABLE OF ON . 7-B-1FURNACE FANS REFERENCE SYSTEM CURVES . 7-B-2FIELD STUDIES . 7-B-3DETERMINATION OF REFERENCE SYSTEM CURVES FOR DOEFURNACE FAN TEST PROCEDURE . 7-B-4Other reference system curves . 7-B-6DISRIBUTION OF SYSTEM CURVES USED IN LCC ANALYSIS . 7-B-6LIST OF TABLESTable 7-B.3.1Table 7-B.3.2Table 7-B.4.1Table 7-B.4.2Table 7-B.4.3Table 7-B.4.4Table 7-B.5.1Single Family Field Data ESP at Cooling Airflow Setting. 7-B-3Manufactured Home Field Data. 7-B-4Evaporator Coil Pressure Data . 7-B-4Filter Pressure Data . 7-B-4Fraction of Installations with Evaporator Coil in ESP. 7-B-5Summary of Weighted Average Reference System ESP Values. 7-B-5Reference System ESP Distribution Parameters Values by ProductClass . 7-B-6LIST OF FIGURESFigure 7-B.1.1Figure 7-B.5.1Figure 7-B.5.2Figure 7-B.5.3Figure 7-B.5.4Sample of System Curves with a Typical Fan Curve . 7-B-1External Static Pressure Distribution for Non-Weatherized GasFurnace Fan; Oil Furnace Fan; Electric Furnace / Modular BlowerFan; Hydronic Air Handler Fan (Heat/Cool) with Central AirConditioning . 7-B-7External Static Pressure Distribution for Non-Weatherized GasFurnace Fan; Oil Furnace Fan; Electric Furnace / Modular BlowerFan; Hydronic Air Handler Fan (Heat/Cool) without Central AirConditioning or Weatherized Gas Furnace Fan . 7-B-7External Static Pressure Distribution for Manufactured Home NonWeatherized Gas Furnace Fans; Manufactured Home ElectricFurnace / Modular Blower Fan with Central Air Conditioning. 7-B-8External Static Pressure Distribution for Manufactured Home NonWeatherized Gas Furnace Fans; Manufactured Home ElectricFurnace / Modular Blower Fan without Central Air Conditioning. 7-B-87-B-i
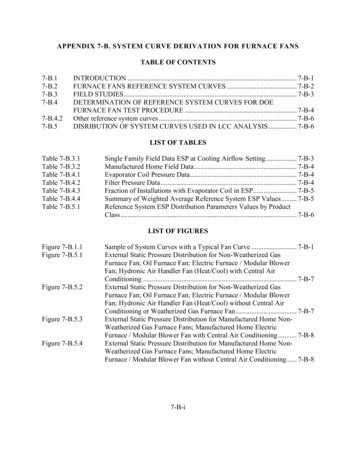
APPENDIX 7-B. SYSTEM CURVE DERIVATION FOR FURNACE FANS7-B.1INTRODUCTIONThe system curve of the air-distribution system is a graphical representation of theairflow through the supply and return ducts in a house for different static pressures. The airflowand pressure drop at which the furnace will operate can be determined by the intersection of thesystem curve of the house and the fan curve of the furnace fan.1 Figure 7-B.1.1 shows anexample of a plot of system curves intersecting a furnace fan curve.DOE modeled system curves as quadratic curves, which is standard in heating,ventilation, and air conditioning (HVAC) design and fan selection handbooks.2 The curves arebased on Bernoulli’s equations for fluid flow and are expressed as the following equation:Q Where: airflow (cfm), static pressure (in.w.g.), and a constant coefficient.16001200Airflow (CFM)QPα𝑃𝛼800Highest 1%400medianLowest 10%1200 CFM Generic Single-StageFurnace Model (Heating Tap)00.000.250.500.751.00External Static Pressure (in. w.g.)Figure 7-B.1.1Sample of System Curves with a Typical Fan Curve7-B-1
7-B.2FURNACE FANS REFERENCE SYSTEM CURVESIn DOE’s proposed furnace fan test procedure, the reference system curve is defined asfollows:where:𝐾𝑟𝑒𝑓 𝐸𝑆𝑃𝑟𝑒𝑓𝑄𝑚𝑎𝑥 2Kref a constant that characterizes the reference system;ESPref Reference System External Static Pressure (ESP); andQmax amax ESPref 2 bmax ESPref cmaxThe operating point in the maximum airflow-control setting is defined by the referencesystem criteria: ESPref and Qmax. External static pressure (ESP) is the portion of the fan totalpressure that exists by virtue of degree of compression external to the HVAC product in whichthe furnace fan is contained. ESP does not include the pressure drop across appurtenancesinternal to the HVAC product. In the field, ESP is measured as the difference in pressurebetween the HVAC product inlet and outlet points, and includes the ductwork, inlet filter, andcoil outside of the unit if applicable.In the field there are four distinct reference system ESPs associated with specificequipment:a) Units with Cooling Option (Coil Outside of Unit): This includes non-weatherized gasfurnaces and oil-furnaces. Reference system is measured at the maximum default cooling airflowcontrol setting. ESP includes a fraction of units in the field that include the evaporator coil.b) Heating only units: This includes heating-only hydronic air-handlers. a Reference system ismeasured at the default heating airflow control setting. ESP does not include evaporator coil.b) Units with Coil inside Unit: This includes weatherized gas and oil-fired furnaces. Referencesystem is measured at the maximum default cooling airflow control setting. ESP does not includeevaporator coil.c) Manufactured Home Units: This includes manufactured home gas or oil-fired furnaces.Reference system is measured at the cooling airflow control setting for these units. ESP includesa fraction of units in the field that include the evaporator coil.aUnits like First Company’s FWA series: http://www.firstco.com/products/fwa hw.asp.7-B-2
7-B.3FIELD STUDIESDOE gathered field data from available studies and research reports to determine anappropriate ESP value to propose for the reference system. DOE compiled over 1300 field ESPmeasurements from 27 studies that included furnace fans in single family and manufacturedhomes in different regions of the country. Table 7-B.3.1 summarizes the field data for singlefamily homes at cooling airflow setting. Table 7-B.3.2 summarizes the field data formanufactured homes at cooling airflow setting. The average measured ESP values are the actualvalues measured in each study. Some studies did not include the evaporator coil or filter in theESP measurement. To account for this DOE added the filter pressure drop to all adjusted ESPvalues (“Adj. w/o Coil” and “Adj. w/ Coil”). In addition, DOE subtracted the pressure drop ofthe evaporator coil for “Adj. w/o Coil” and added the pressure drop of the evaporator coil for“Adj. w/ Coil” when appropriate. See next section for the determination of average filter andevaporator pressure drop values.Table 7-B.3.1Single Family Field Data ESP at Cooling Airflow SettingStudySampleAverage ESP (in. w.c.)SizeMeasured Adj. w/o Coil Adj. w/ Coil3Blasnik et al. 1995400.410.410.61Blasnik et al. 19964280.480.480.685Parker 199790.550.550.756Proctor et al. 1995400.530.530.73Proctor et al. 19967360.510.510.718Proctor et al. 1998150.450.450.65Proctor 19989360.420.420.6210Proctor 2005780.480.480.68Proctor et al. 20071141.010.811.0112Proctor 200050.500.500.7013Proctor 2001690.540.540.74Proctor 200314690.530.530.7315Proctor 1996a80.450.450.65Proctor 1996b16920.310.520.7317Wilcox et. al. 2006510.770.570.7718Dickenhoff 1998130.540.540.74Baylon et al. 2005191480.360.570.7820Ueno 2010 (2008 Study)40.900.700.90Ueno 2010 (2009 Study)2011.120.921.1221Pigg 2008 (2007 Study)760.730.530.73Pigg 2008 (2005 Study)21370.530.530.7322Pigg 2003310.550.550.75Weighted Average8900.500.520.731ESP measurement includes Coil2ESP measurement includes Filter7-B-3Notes1111111111111,211,211
Table 7-B.3.2Manufactured Home Field DataAverage ESP (in. w.c.)StudySampleSizeMeasuredAdj. w/o CoilAdj. w/CoilBaylon et al. 1995231640.180.180.3824Davis et al. 2000360.230.230.43Davis et al. 2004251000.120.120.3226Ecotope 2006690.230.230.43Baylon et al. 200927890.120.120.32Weighted Average4580.170.170.371ESP measurement does not include Coil2ESP measurement does not include Filter7-B.4Notes11111DETERMINATION OF REFERENCE SYSTEM CURVES FOR DOEFURNACE FAN TEST PROCEDUREUsing field data from 3 studies, DOE estimated average filter and coil pressures in orderto adjust field data that did not include the filter or coil. On average, the pressure drop measuredfor the evaporator coil was 0.20 in w.c. (as shown in Table 7-B.4.1) and the pressure drop for thefilter was 0.21 in w.c. (as shown in Table 7-B.4.2).Table 7-B.4.1Evaporator Coil Pressure DataStudySample SizePigg 2008 (2007 Study)21Pigg 2008 (2005 Study)21Wilcox et. al. 200617Weighted AverageTable 7-B.4.2751951145Filter Pressure DataStudySample SizePigg 2008 (2007 Study)21Pigg 2008 (2005 Study)21Wilcox et. al. 200617Weighted Average763746159Average Pressure Drop(in. w.c.)0.200.190.210.20Average Pressure Drop(in. w.c.)0.250.210.160.21Using EIA’s RECS 2005 data, DOE estimated the fraction of furnace installations withand without a coil in the ESP. For units with a cooling option (coil outside unit), DOE looked atall households with either a gas or oil-fired furnace and determined that 72.9% of these7-B-4
households had central air-conditioners. b For manufactured home units DOE looked at allmanufactured home households with either a gas or oil-fired furnace and determined that 50.2%of these households had central air-conditioners. DOE estimated that these two fractions wouldrepresent the fraction of installations with evaporator coil in the ESP. Table 7-B.4.3 data showsthe results for each of the distinct reference systems. None of the heating only units or units withcoil inside are assumed to have an evaporator coil in the ESP.Table 7-B.4.3Fraction of Installations with Evaporator Coil in ESPProduct DescriptionFraction of Installations withEvaporator Coil in ESPUnits with Cooling Option (Coil Outside Unit)72.9%Heating only units0%Units with Coil inside0%Manufacture Home50.2%Table 7-B.4.4 presents the final results of this analysis for each distinct reference systemcurve used in DOE’s NOPR furnace fan test procedure. The results take into account the fractionof units with the coil included in the ESP.Table 7-B.4.4Summary of Weighted Average Reference System ESP ValuesProduct DescriptionAirflow Control Weighted Average ESP(in. w.c.)SettingUnits with Cooling Option (Coil Outside Unit)Cooling0.65Heating only unitsHeating0.50Units with Coil insideCooling0.50cManufacture HomeCooling0.30(All Values Rounded)The results are determined as follows:1) for units with cooling option (coil outside unit), 72% of the furnace fans are installedwith CAC (see Table 7-B.4.3), so 72% * 0.73 in. w.c. 28% * 0.52 in. w.c., which isrounded to 0.65 in w.c.;2) for manufactured homes furnace fans, 50% of the furnaces are installed with CAC(see Table 7-B.4.3), so 50% * 0.17 in. w.c. 50% * 0.37 in. w.c., which is rounded to0.30 in w.c.;3) for heating only units and units with coil inside the weighted average ESP is roundedfrom 0.52 in. w.c. to 0.50 in w.c.bFor simplicity, electric furnaces are excluded since they are mostly associated with heat pumps. Also, RECS doesnot provide information to distinguish which households have hydronic air-handlers. Adding electric furnaces andhydronic equipment will increase the fraction of households with central air-conditioners, since this equipment tendsto be located in warmer climates.cManufactured home external static pressure is much smaller due to the fact there is no return air ductwork inmanufactured homes. Also HUD requirements stipulate that the ductwork for cooling should be set at 0.3 in. w.c.7-B-5
7-B.4.2Other reference system curvesManufacturers Rating for Cooling – 0.5 in.w.c. at cooling airflow setting [manufacturerproduct literature]DOE test procedure for Cooling - 0.1 to 0.2 in.w.c. for conventional split systems [Subpart BAppendix M of Title 10 Part 430 of the Code of Federal Regulations (CFR)]DOE test procedure for Furnaces – 0.12 – 0.58 in.w.c. minimum static pressure values dependon equipment type as follows [Subpart B Appendix N of Title 10 Part 430 of the Code of FederalRegulations (CFR), which references ANSI/ASHRAE 103, table 4 and 5]:a) Gas furnaces and Oil furnaces (w/ temp rise greater than 65 deg) - 0.18 to 0.33 in. w.c.(depending on input capacity)b) Oil furnace (w/ temp rise less than or equal to 65 deg) – 0.38 - 0.58 in w.c. (depending oninput capacity)c) Electric furnaces - 0.12 to 0.25 in.w.c. (dependant on Standard Air Quantity (SCFM))Canadian Furnace Fan Standard – 0.3 inches WC (Recommended practice) and 0.6 inchesWC (Common Practice) at heating airflow setting [CSA. C823-11: Performance of air handlersin residential space conditioning systems. May 2011.]HUD for Manufactured Home with comfort cooling certificate – 0.3 inches WC at coolingairflow setting [Title 24 of the HUD code PART 3280--Manufactured Home Construction andSafety Standards, Part 3280.715 (a) (3) (ll)]7-B.5DISRIBUTION OF SYSTEM CURVES USED IN LCC ANALYSISFor the LCC analysis, DOE used the field data above to generate normal distributions forthe various equipment installation variations as shown in Table 7-B.5.1. Figure 7-B.5.1 toFigure 7-B.5.4 show the external static pressure distributions used in the analysis.Table 7-B.5.1Reference System ESP Distribution Parameters Values by Product ClassProduct ClassesHousehold AverageStandardHasESPDeviation(in. w.c.)Central AC (in. w.c.)Non-Weatherized Gas Furnace Fan; Oil Furnace Fan;Yes0.730.12Electric Furnace / Modular Blower Fan; Hydronic AirNo0.520.12Handler Fan (Heat/Cool)Weatherized Gas Furnace FanYes0.520.12Manufactured Home Non-Weatherized Gas FurnaceYes0.370.06Fans; Manufactured Home Electric Furnace / ModularNo0.170.06Blower Fan7-B-6
Figure 7-B.5.1External Static Pressure Distribution for NonWeatherized Gas Furnace Fan; Oil Furnace Fan;Electric Furnace / Modular Blower Fan; HydronicAir Handler Fan (Heat/Cool) with Central AirConditioningFigure 7-B.5.2External Static Pressure Distribution for NonWeatherized Gas Furnace Fan; Oil Furnace Fan;Electric Furnace / Modular Blower Fan; HydronicAir Handler Fan (Heat/Cool) without Central AirConditioning or Weatherized Gas Furnace Fan7-B-7
Figure 7-B.5.3External Static Pressure Distribution forManufactured Home Non-Weatherized Gas FurnaceFans; Manufactured Home Electric Furnace /Modular Blower Fan with Central Air ConditioningFigure 7-B.5.4External Static Pressure Distribution forManufactured Home Non-Weatherized Gas FurnaceFans; Manufactured Home Electric Furnace /Modular Blower Fan without Central AirConditioning7-B-8
REFERENCES1.Michael R. Lindeburg, P., Fans and Ductwork. In Mechanical Engineering ReferenceManual for the PE Exam, P. Michael R. Lindeburg, Editor. Tenth ed. 1997. ProfessionalPublications, Inc.: Belmont, CA. p. 20-1, 20-262.American Society of Heating Refrigeration and Air-Conditioning Engineers, ASHRAE1997 Handbook - Fundamentals. 1997. Atlanta, GA.p. 3.12.3.Blasnik, M., J.P. Proctor, T.D. Downey, J. Sundal, and G. Peterson. 1995a. Assessmentof HVAC Installations in New Homes in Nevada Power Company’s Service Territory.Research Project 3841-03, Final Report. Palo Alto, CA: Electric Power ResearchInstitute, Inc. TR-105309.4.Blasnik, M., T.D. Downey, J.P. Proctor, and G. Peterson. 1996. Assessment of HVACInstallations in New Homes in APS Service Territory. Research Project Final Report.Phoenix, AZ: Arizona Public Service Company, Inc.5.Parker, D.S. 1997. Measured Air Handler Fan Power and Flow. Memorandum to ArminRudd. Cocoa, FL. Florida Solar Energy Center6.Proctor, J.P., M. Blasnik and T.D. Downey. 1995. Southern California Edison CoachellaValley Duct and HVAC Retrofit Efficiency Improvements Pilot Project. San Dimas, CA:Southern California Edison Company.7.Proctor, J.P., M. Blasnik, T.D. Downey, J. Sundal, and G. Peterson. 1996. Assessment ofHVAC Installations in New Homes in Nevada Power Company’s Service Territory. 1995Update. Las Vegas, NV: Nevada Power Company.8.Proctor, J.P., M. Blasnik. 1998. New Jersey Testing.9.Proctor, J.P. 1998. New Jersey Testing in Existing Housing.10.Proctor, J.P. 2005. Proctor Engineering Group (PEG) analysis of data collected byConservation Services Group (CSG) field personnel during the summer of 2005 on 76 airconditioner installations in New Jersey.11.Proctor, J.P. 2007. Performance of Furnace as an Air Handler (HDAC Testing inCalifornia).12.Proctor, J.P. 2000. Cochella Valley CA.13.Proctor, J.P. 2001. LIPA Baseline 2001. Long Island New York.14.Proctor, J.P. 2003. A120 Long Island Participants and non-Participants.7-B-9
15.Proctor, J.P. 1996a. Eastern US testing.16.Proctor, J.P. 1996b. Southern Indiana Gas and Electric Co. Testing.17.Wilcox, B. J. Proctor, R. Chitwood, and K. Nittler. 2006. Furnace Fan Watt Draw and AirFlow in Cooling and Air Distribution Modes. 2008 California Building Energy EfficiencyStandards.18.Dickenhoff, D. 1998. California Fan Testing.19.Baylon D., S. Strand, B. Davis, D. Robison, and E. Kruse. 2005. Analysis of Heat PumpInstallation Practices and Performance: Market Research Report. Northwest EnergyEfficiency Alliance20.Ueno. May 2010. ECM Efficiency Better (and Worse) Than You Think. Home Energy.(Two Studies reported 2008 and 2009)21.Piggs, S. 2008. Central Air Conditioning in Wisconsin: A Compilation of Recent FieldResearch. Energy Center of Wisconsin. (Two studies reported 2005 and 2007)22.Piggs, S. 2003. Central Electricity Use by New Furnaces: A Wisconsin Field Study.23.Baylon, D., B. Davis, L. Palmiter. 1995. Manufactured Home Acquisition Program:Analysis of Program Impacts. Prepared for Bonneville Power Administration underContract No. DE-AM79-91BP13330, Task Order #71945.24.Davis, B, A. Roberts, D. Baylon. 2000. Summary of SGC Manufactured Home FieldData (1997-98 Sittings in Idaho and Washington). Prepared for Idaho Department ofWater Resources- Energy Division.25.Davis, B. and D. Baylon. February 2004. "Summary of SGC Manufactured Home FieldData (2001-02 Sitings)." Prepared for Northwest Energy Efficient Manufactured Homes(ODOE), Northwest Energy Efficiency Alliance, Idaho Department of Water Resources,Energy Division.26.Ecotope, Summary of Results of Field Testing on Newer NEEM Homes With MasticDuct Systems,"" memorandum to Tom Hewes and Brady Peeks of Oregon Dept ofEnergy, 10 June 2006. "27.Baylon, D. and B. Davis. January 2009. "Summary of NEEM Manufactured Home FieldData." Submitted to Oregon Department of Energy.7-B-10
The system curve of the air-distribution system is a graphical representation of the airflow through the supply and return ducts in a house for different static pressures. The airflow and pressure drop at which the furnace will operate can be determined by the intersection of the system c